Here’s the video version of the article:
Summary
- The recent dollar weakness has boosted prices of precious and industrial metals, alongside mining stocks. Silver has led gold, while the miners have outperformed the underlying metals.
- The outsized returns of silver and the miners relates to their high sensitivity to the dollar. Their betas to dollar moves are big, making them levered bets on further dollar weakening.
- Across a dozen episodes of a falling dollar going back to the early-1970s, silver and copper proved to be winning bets. Over time, silver has become a better bet against the dollar than gold.
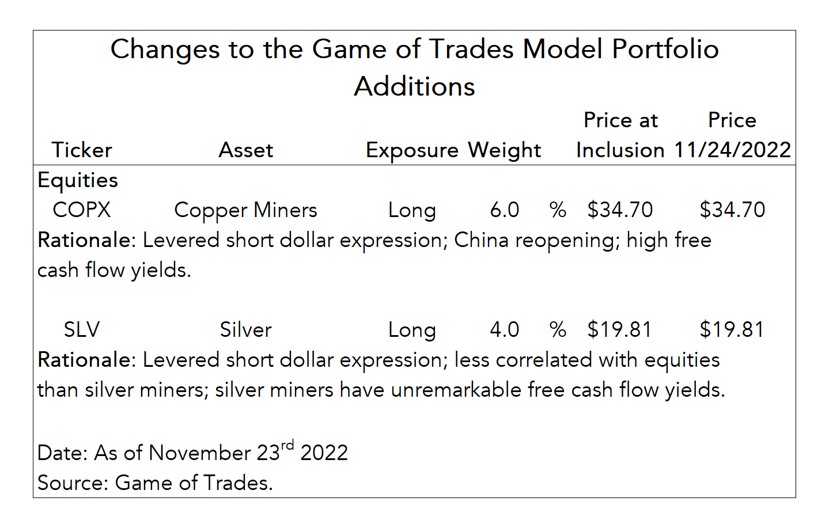
- We’re adding a 10% allocation to metals and miners in our model portfolio, with a 6% long position on copper miners (COPX) and 4% on silver (SLV).
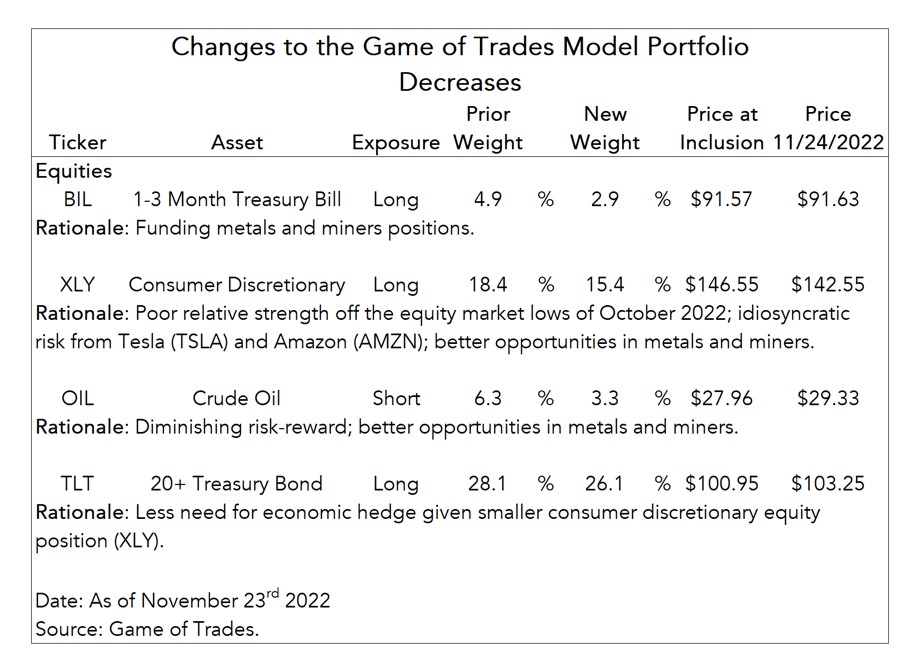
- That’ll be funded via cash, as well as by trimming our long positions on consumer discretionary stocks (XLY) and bonds (TLT), and our short position on oil (OIL).
- Next week we’ll be extending our analysis on the implications of a falling dollar for non-U.S. stocks. We’ll assess whether we should be adding them to our model portfolio.
The Recent Dollar Weakness Boosted Metals
In our update on the U.S. dollar last week, we presented our thesis on why we expect further dollar downside over the next year following its most recent peak in late-October. We expect the dollar to decline about 8% from today’s levels driven by the following developments:
- An improving outlook of the energy crisis in Europe due to ample natural gas supplies
- The reopening of China’s economy, alongside stimulus for its troubled real estate sector
- Decelerating inflation in the U.S. easing the Fed’s aggressive monetary policy
As a result, we expect the high level of uncertainty surrounding the global economy to fall and U.S. rate differentials with the rest of the world to recede, degrading the appeal of holding dollars.
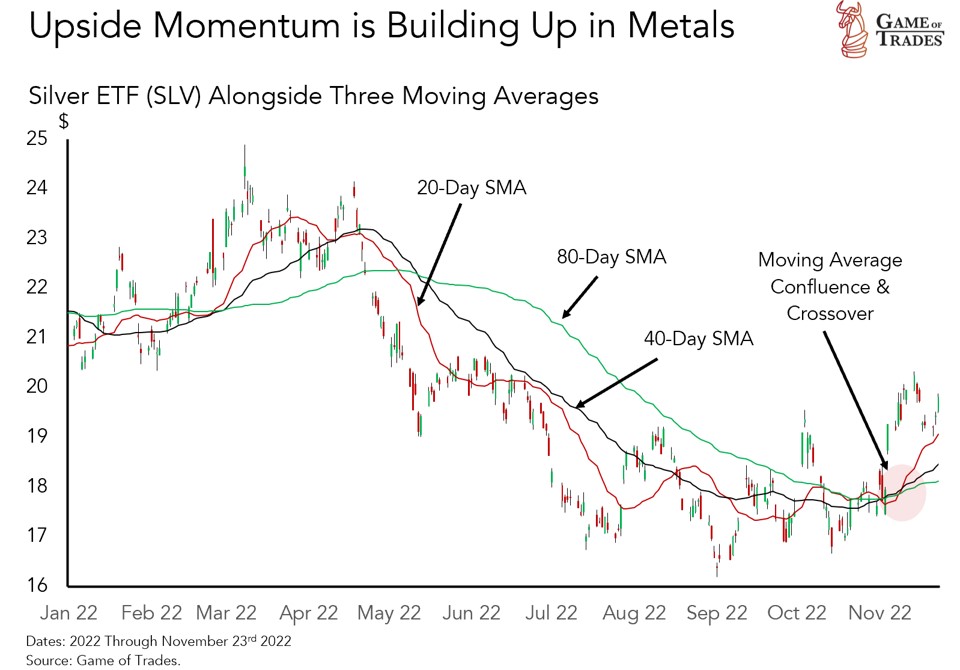
The dollar’s recent weakness has seen a surge in the price of both precious and industrial metals. We can see an example of that in the chart below that documents the price of SLV, an ETF that invests in silver. Since early-November, the confluence of moving averages turning higher speaks to upside momentum.
In this research we’ll make the case for adding metals and miners to our model portfolio to express our view of a weakening dollar. We’ll start by comparing the returns among precious and industrial metals, including miners, during the recent weakening in the dollar. That can give us an early indication for who the potential winners could be in a regime of dollar weakness. We’ll also take a look at their historical performance across a dozen episodes of dollar weakening going back to the early-1970s. That will inform us as to what metals have fared best when the greenback was falling. We’ll put everything together to assess the odds of success when evaluating which metals and miners are worth adding to our model portfolio.
Silver Besting Gold, Miners Outperforming
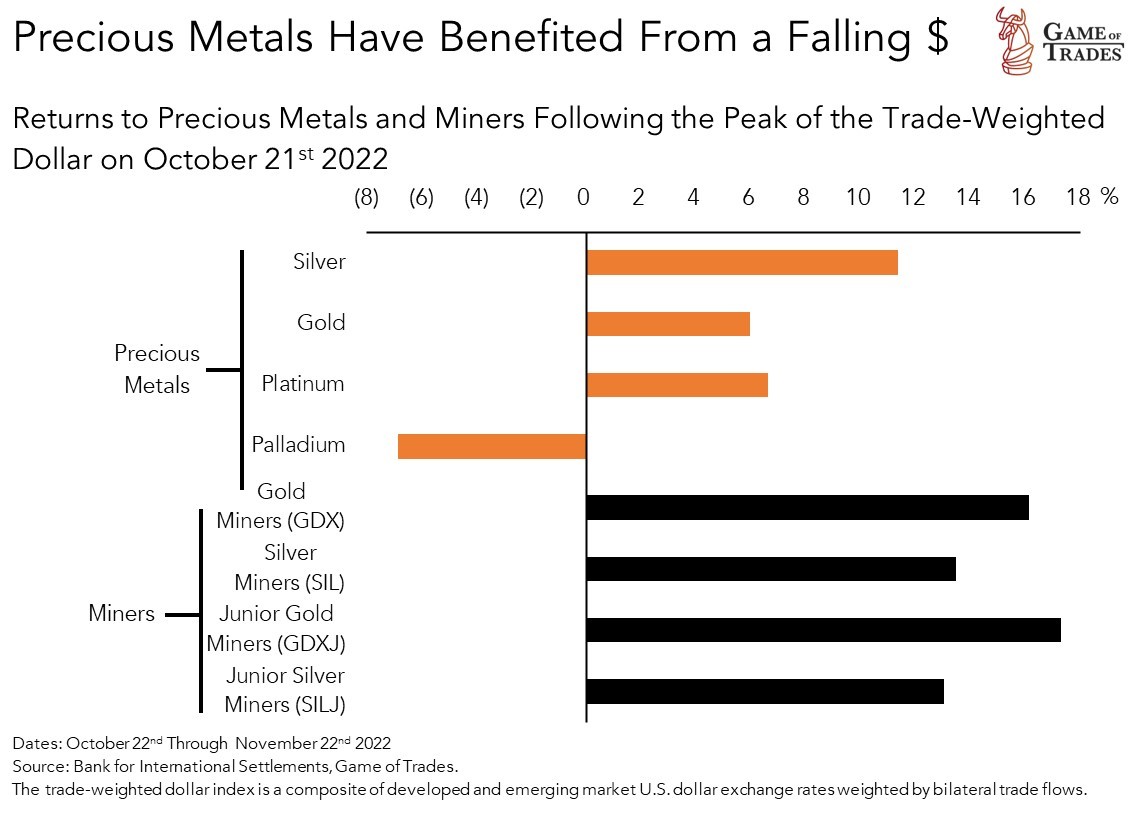
We can start out by looking at the returns of precious metals following the peak in the trade-weighted dollar of October 21st. That can give us early indication of how the market is expressing the short-dollar bet. Silver has outperformed other precious metals like gold, as shown below. Gold and silver miners have outperformed physical markets, as evident by the bars in the bottom-half of the chart. Part of that has to do with the rebound in equity markets more recently. Miners are, of course, correlated with equities given they’re publicly-traded businesses.
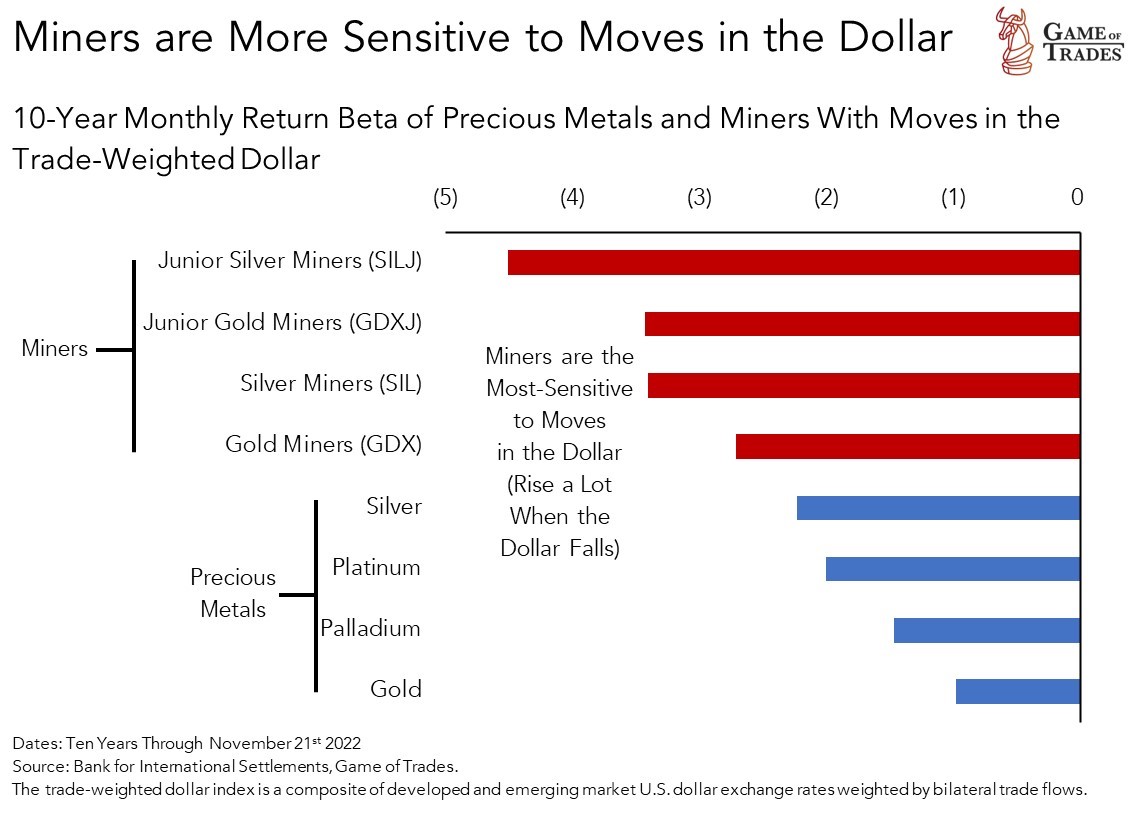
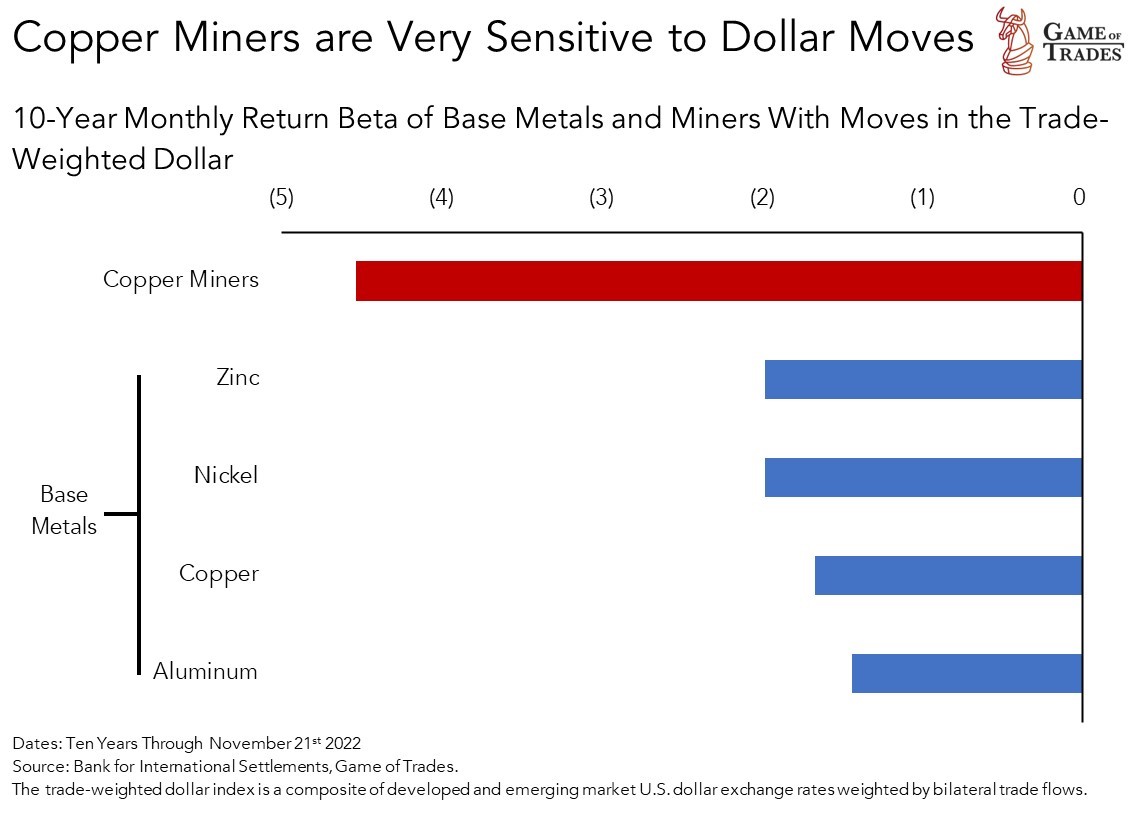
Moreover, the outperformance of miners makes sense because that group is more sensitive to a falling dollar than the underlying commodities are.[1] We can capture that sensitivity by comparing the historical beta of the monthly returns of miners and precious metals with moves in the dollar, as shown below. A beta of (4.5) for the junior silver miners, for example, means that the group has generally risen by 4.5% for every 1% drop in the dollar (i.e., negative beta). Physical gold vehicles, like GLD for example, have a relatively small beta or sensitivity to the moves in the dollar. Of course, beta is a backward-looking variable and sensitivities to the dollar could change over time. Nevertheless, they provide an indication for direction and magnitude for metals when the dollar is falling.
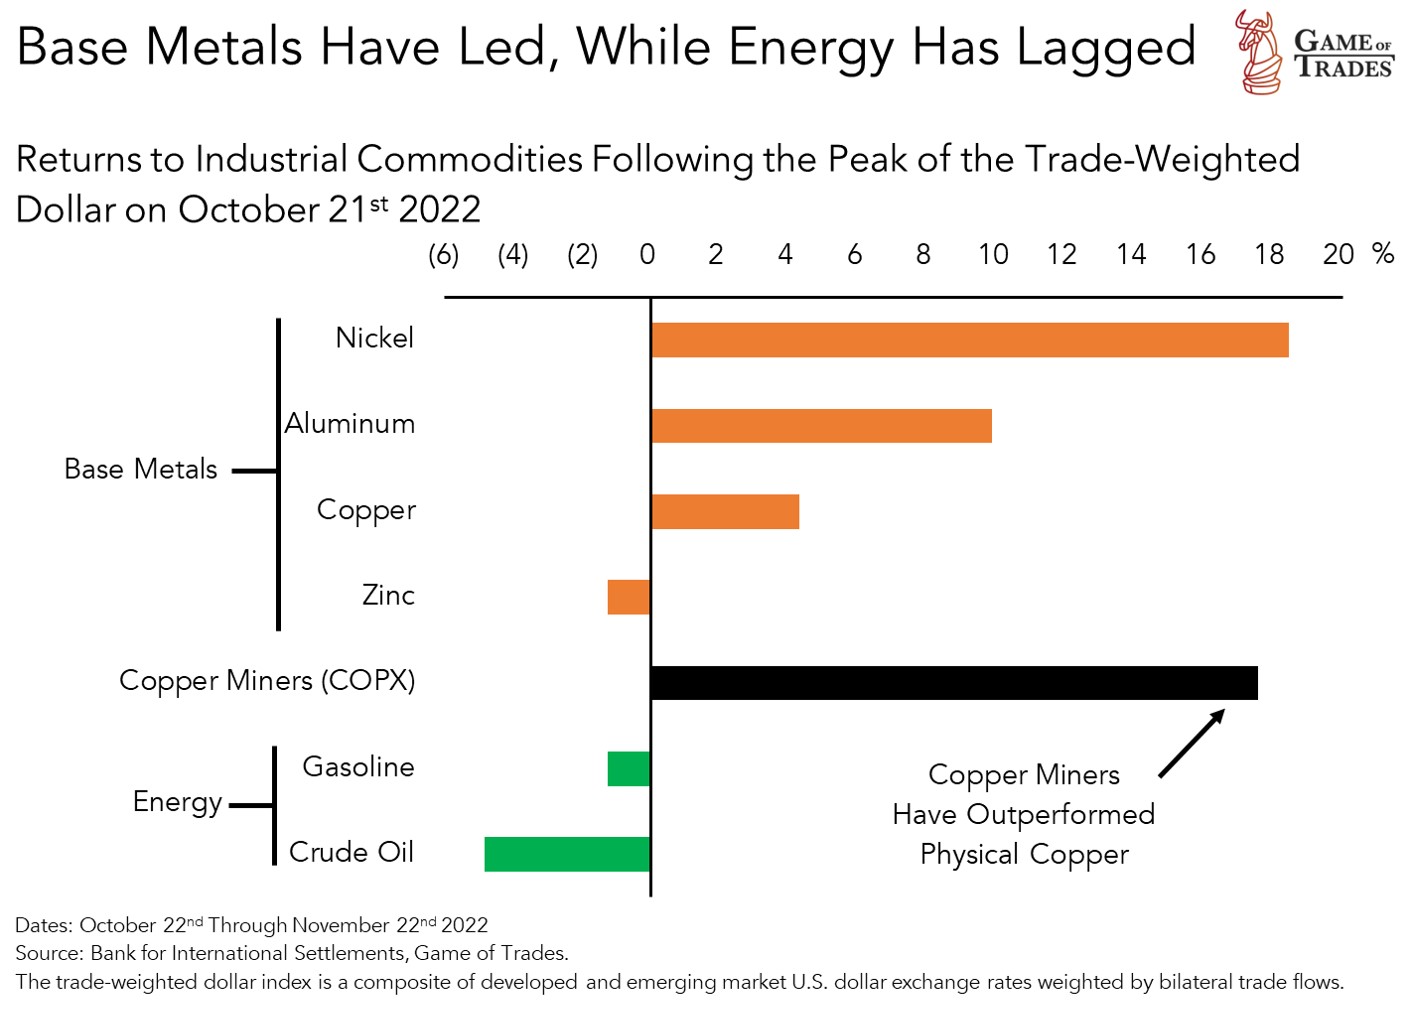
We can do the same analysis for the industrial metals. Since the recent peak in the dollar, they’ve also seen price appreciation. Nickel has bested aluminum and copper. Much like the case of the precious metals, the copper miners (COPX) have outperformed physical copper.
The result of that may not be too surprising after looking at the chart below. The beta of copper miners to moves in the dollar is close to 3x that of physical copper. That makes copper miners a more levered bet on a falling dollar and a reopening in China than betting on the underlying metal itself.
Of note, energy commodities like oil and gasoline have underperformed by a wide margin, as was shown in the second-to-last chart. That’s very unusual by the standards of history considering that oil prices tended to rise when the dollar fell. We believe a starting point of oil being overvalued relative to the dollar explains the weakness. That overvaluation is something we highlighted in an article back in mid-August. A big part of the premium in oil was due to its outsized gain in the post-pandemic economic reopening relative to the rise in the dollar. As demand has normalized, the premium has deflated.
We excluded natural gas from the analysis as it shows poor statistical relationship with moves in the dollar. That was also true of agricultural commodities.
In the next section we take a look at the history of the last 50 years to assess whether a falling dollar has always been a positive for metals and who the typical winners have been.
History Favors Silver and Copper as Anti-Dollar Bets
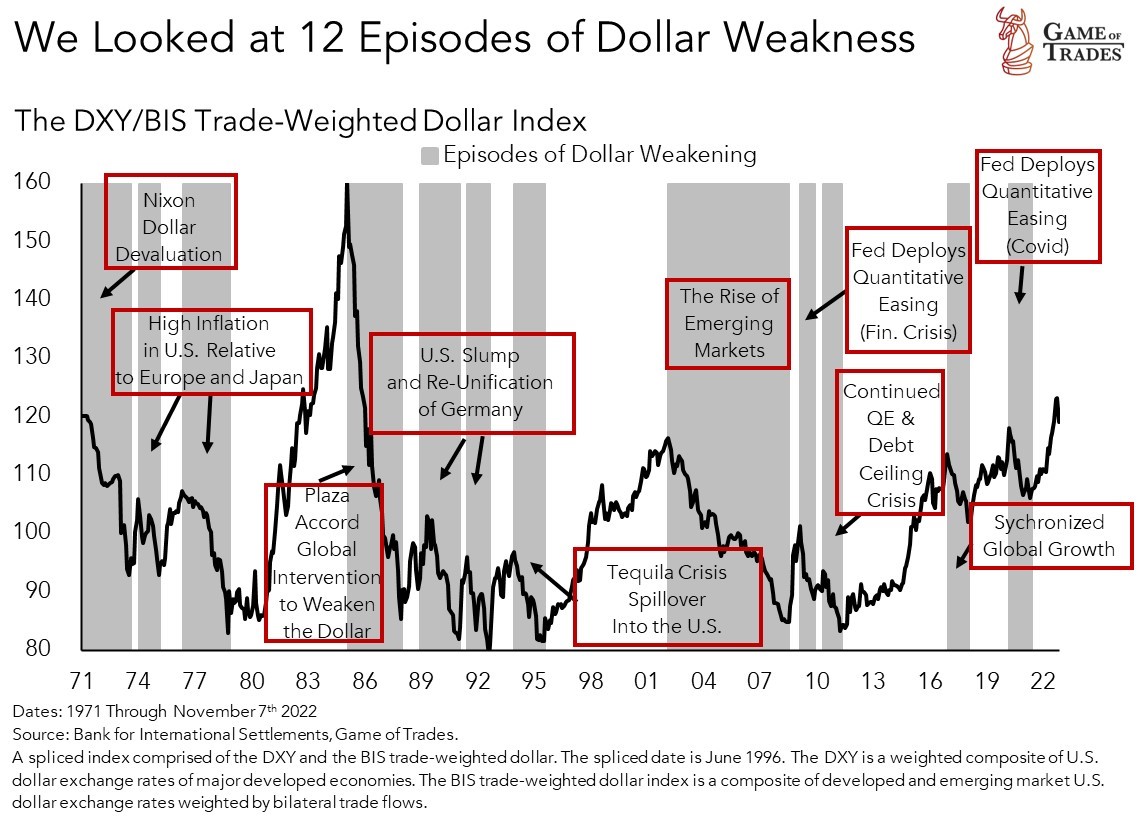
As shown earlier, in recent weeks we’ve seen metals outperform. But, has that always been the case? To assess the odds of success for metals, we took a look at how they performed across 12 major episodes of dollar weakening going back to the early-1970s. The gray bars in the chart below highlight the episodes when the dollar saw persistent and meaningful weakening.[2] The episodes include the Plaza Accord dollar devaluation of the 1980s and the rise of the emerging markets in the 2000s, among others.
Let’s start by comparing the performance of gold and silver across these episodes. One of the classic questions many investors ask is whether silver is a better bet than gold. When it comes to betting on dollar depreciation, the better bet is silver, as shown in the chart below. It’s true that gold outperformed in the earlier part of the history, particularly in the 1970s given that it was seen as a store of value against the high-inflation regime. That’s something we’ve highlighted previously in an article on the hedging capabilities of gold versus Treasuries.
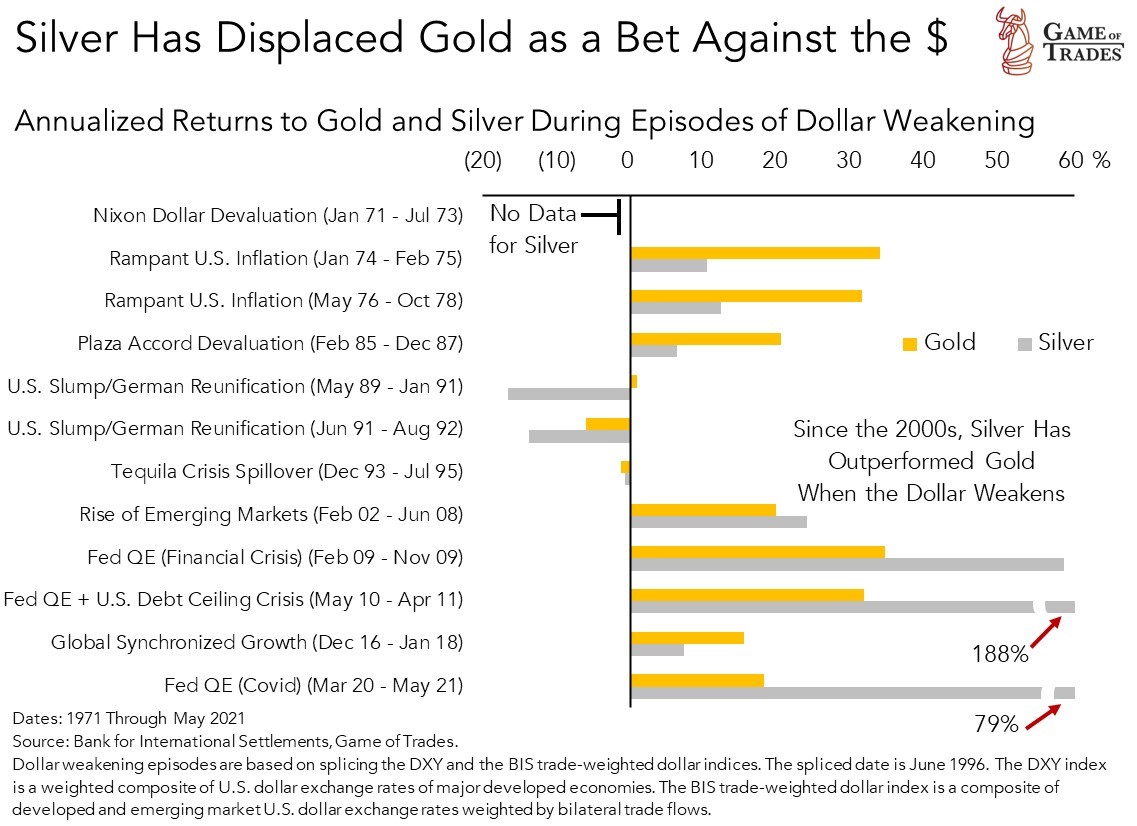
In the last couple of decades, however, silver has been the better bet on a falling dollar. Across the episodes, silver produced a return of 23% per year, compared to gold’s 16%. That’s because a falling dollar translated to loosening financial conditions, boosting global growth. With silver seeing more use in industrial applications than gold, silver got a bigger bid. Gold, on the other hand, has become more of a hedge on falling real yields. That’s because the threat of inflation was supplanted with that of deflation, as global growth slowed down; at least prior to the pandemic. The outperformance of silver relative to gold was biggest when the Fed deployed QE in the aftermath of the financial crisis and at the onset of Covid.
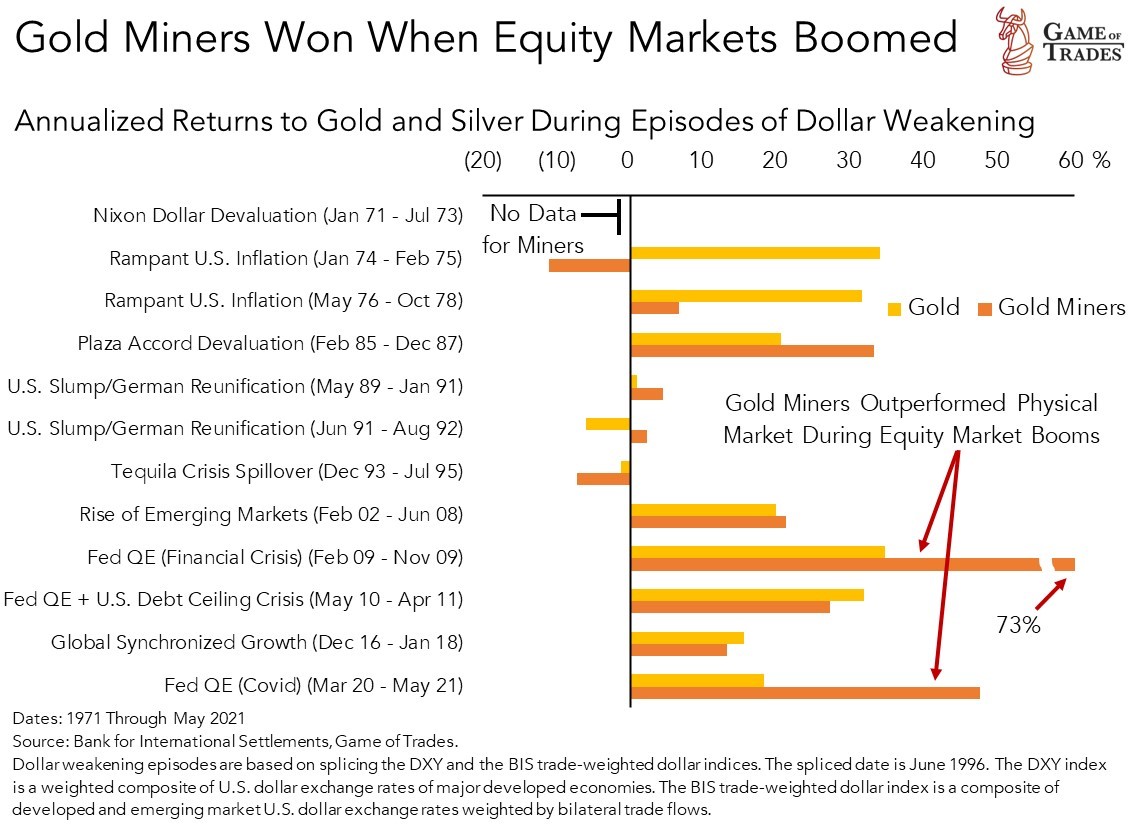
We also looked at the returns of gold miners across the episodes, and compared them with those of gold itself. We found that gold miners have outperformed the underlying metal. Across the episodes, gold returned around 16% per year, while the gold miners generated 38%, with the same hit ratio (i.e., share of episodes with positive relative returns). The outperformance of the gold miners was boosted by the financial crisis and Covid stock market recoveries. Given that miners have higher correlation with equities due to being publicly-traded businesses, they benefited more than the yellow metal from the rising tide of a revaluation of the stock market.
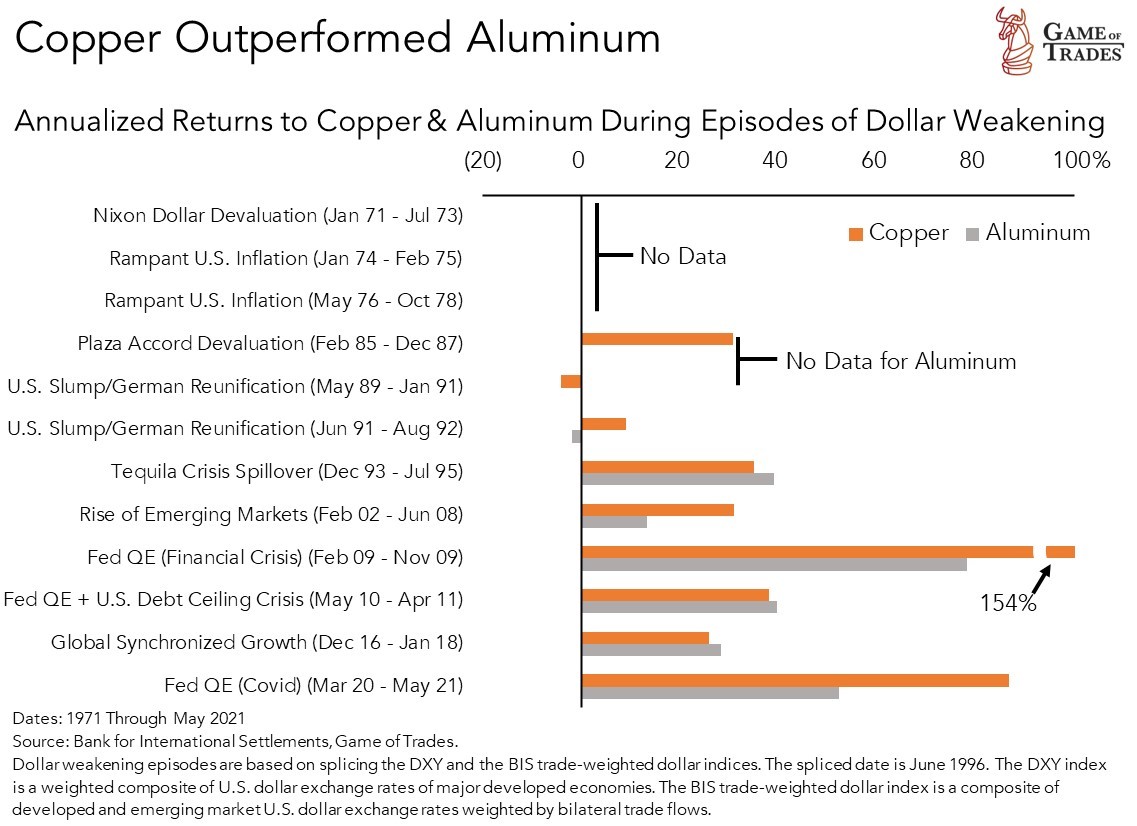
Moving on to the industrial metals, the chart below compares the performance of copper with that of aluminum across the episodes of dollar weakening. Copper proved the winner here, posting returns of 31% per year compared to 19% for aluminum.
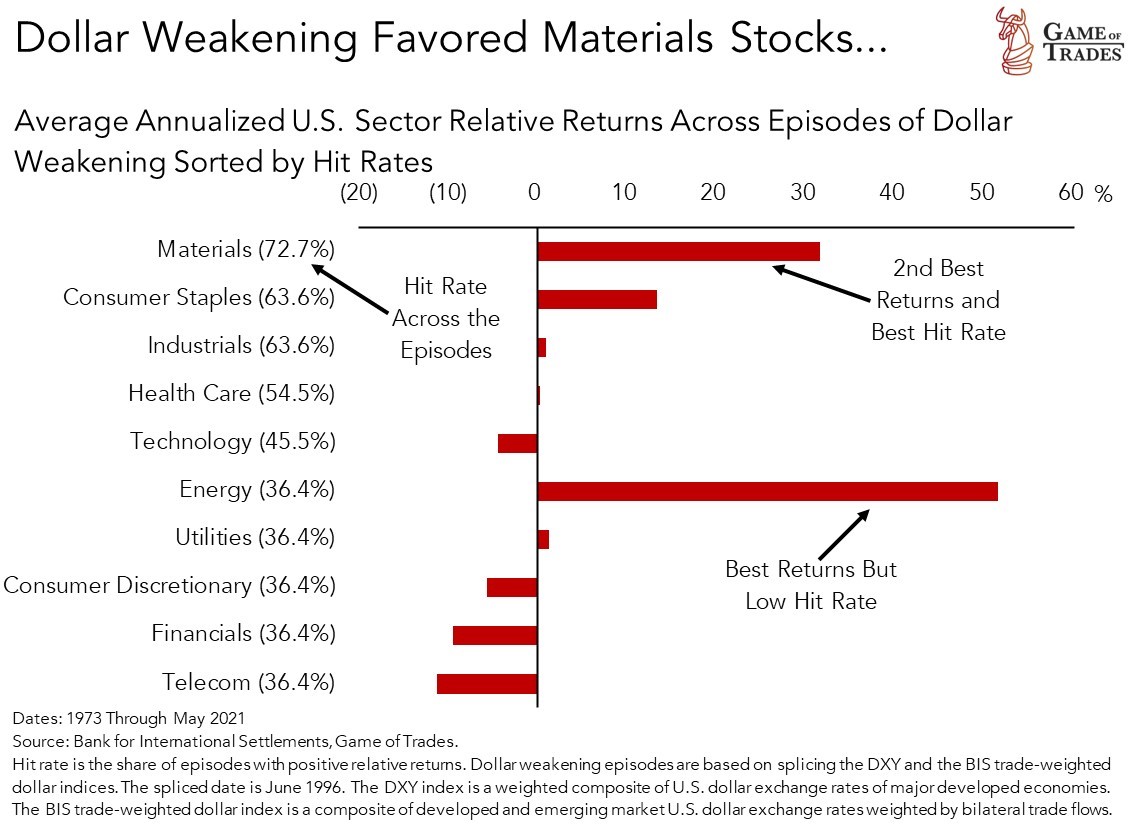
The outperformance of metals across the episodes is also evident when looking at the returns by sector in the U.S. equity market, as shown below. Materials, a group that encompasses metals and mining businesses, as well as chemicals and industrial materials, outperformed. Materials posted the second-best returns, leading the U.S. equity market by 32 percentage points per year, while generating the highest hit rate (i.e., share of episodes with positive returns). Energy posted the best returns, but did so with a low hit rate of 36%.
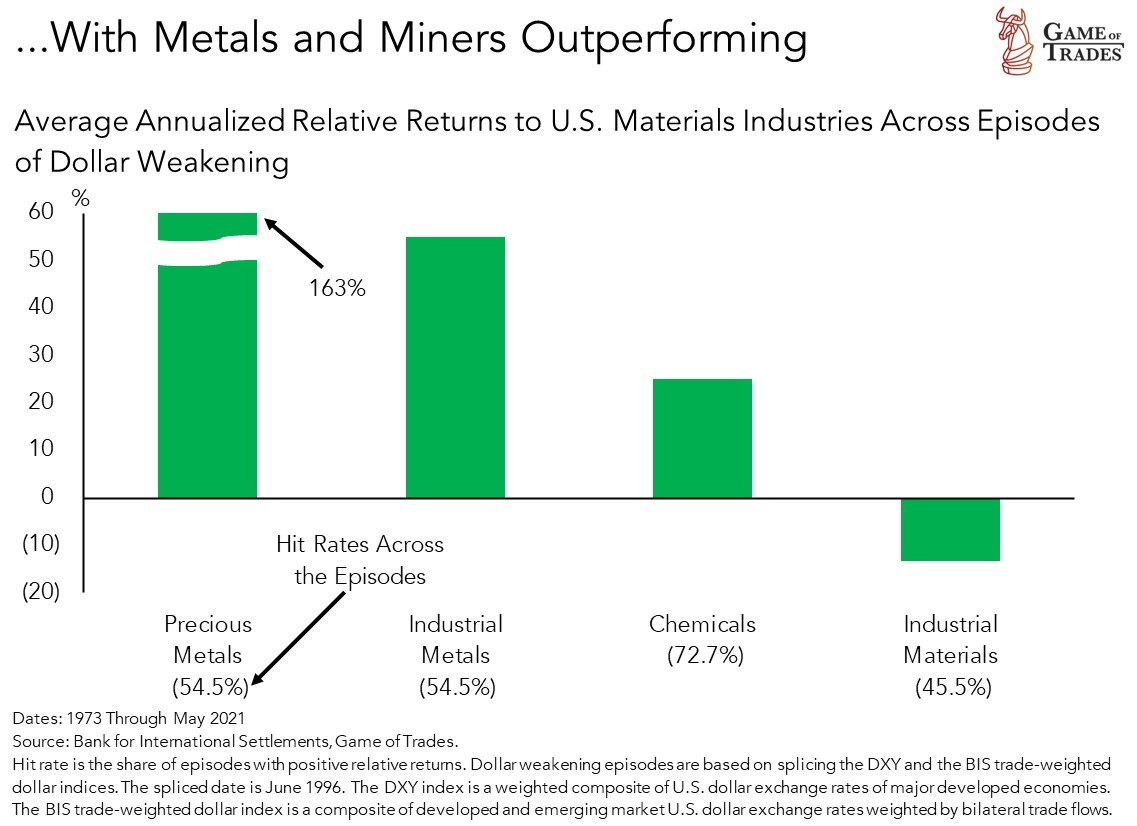
Among the materials sector, miners of precious metals generated the best returns across the dozen episodes of dollar weakening, outperforming the U.S. market by 163 percentage points per year. Miners of industrial metals were a contender, outperforming the market by 55 points per year.
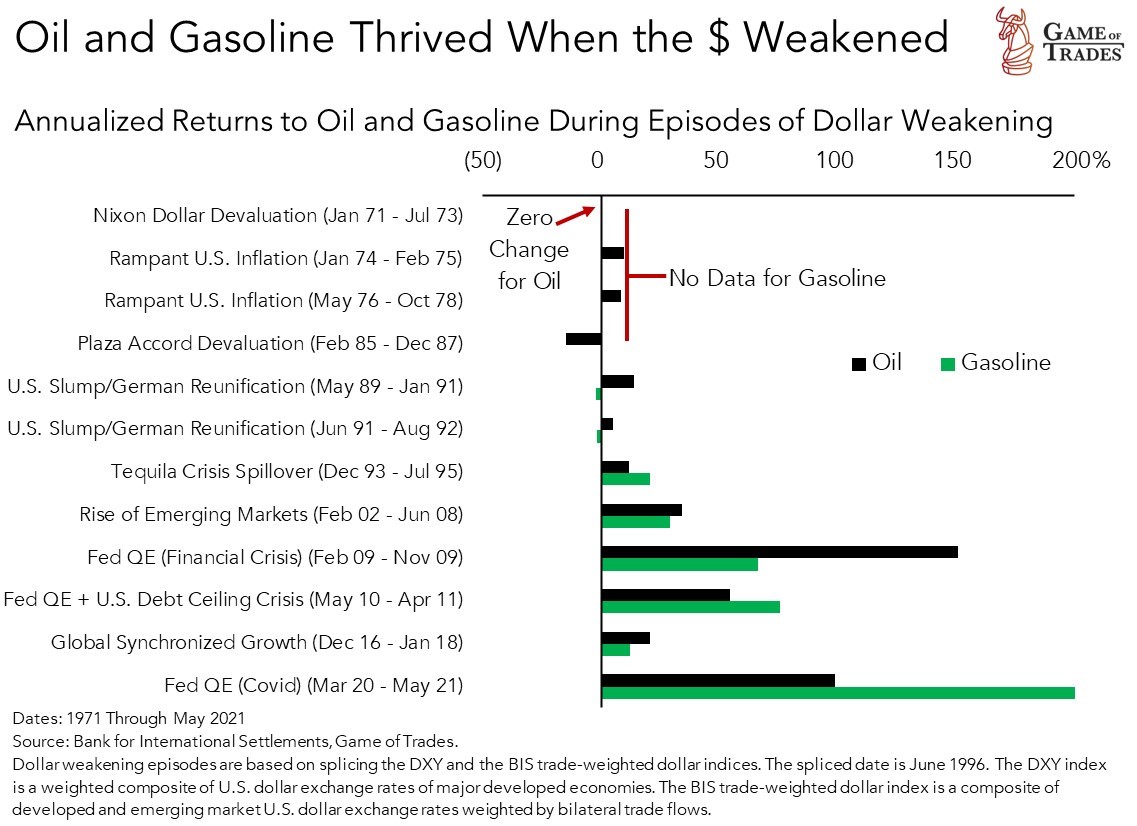
For the sake of comparison, the chart below repeats the analysis for oil and gasoline across the dozen episodes. A falling dollar has generally seen energy commodities rise, as the loosening of financial conditions led to a pick-up in global growth. That was particularly true when coming out of global economic collapses like the financial crisis and the global pandemic. As we mentioned earlier, however, oil and gasoline have slumped since the recent peak in the dollar. That’s because the nascent dollar weakness is reflecting falling uncertainty for the global economy. Hence, the premium imbued to the price of a barrel of oil has dissipated. In other words, oil has been a driver of global uncertainty this year following Russia’s invasion of Ukraine.
Conclusion: Adding Silver (SLV) and Copper Miners (COPX) to the Model Portfolio
Following up from our call last week for further dollar weakness, we’re adding exposure to that theme in our model portfolio. Consistent with the findings laid out in this article, we’re adding a 10% position comprising physical silver through the SLV ETF and copper miners through the COPX ETF. We believe this combination offers the optimal expression to bet on dollar downside.
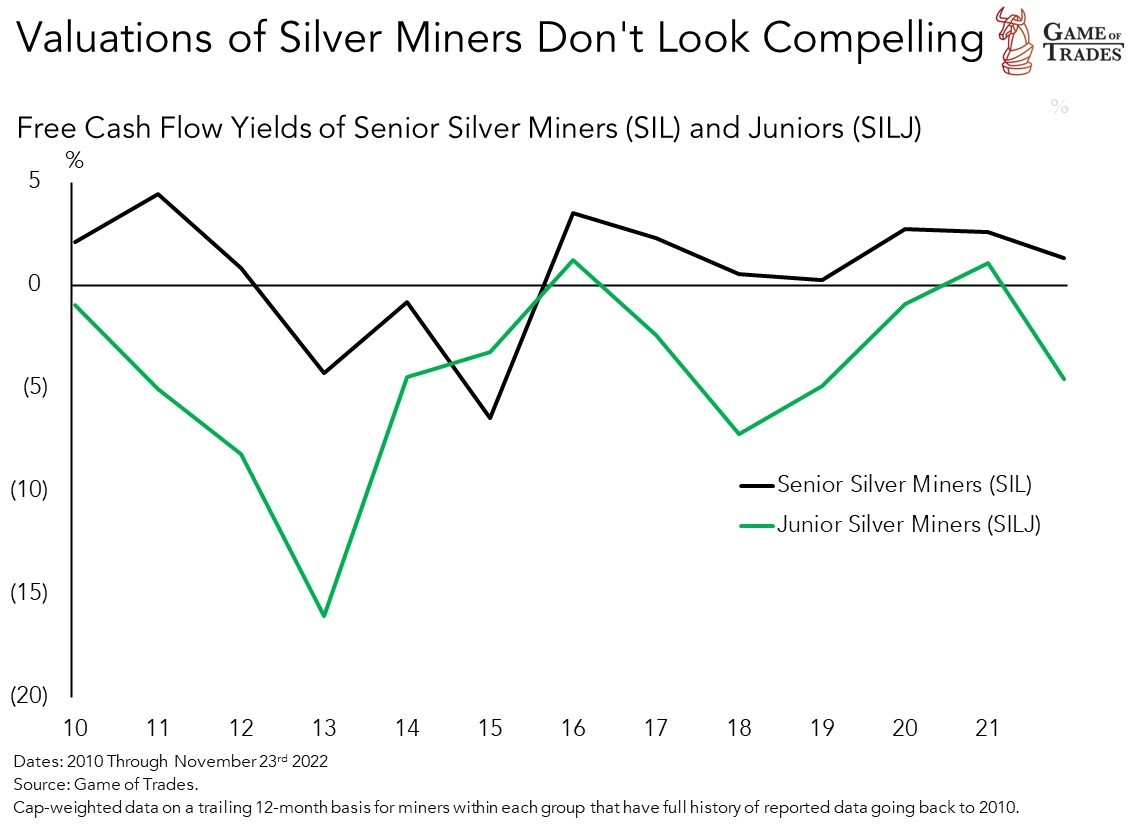
As documented in the article, silver has been a more successful expression of dollar weakness than gold in the last two decades. Moreover, based on our estimates, silver offers a risk-reward ratio that’s close to 30% higher than gold’s. Given silver’s lower correlation to equities, as compared to silver miners for example, our portfolio optimizer finds the addition a valuable one. Moreover, as shown in the chart below, the valuations of silver miners, based on free cash flow yields, don’t look compelling relative to the history of the last several years.[3]
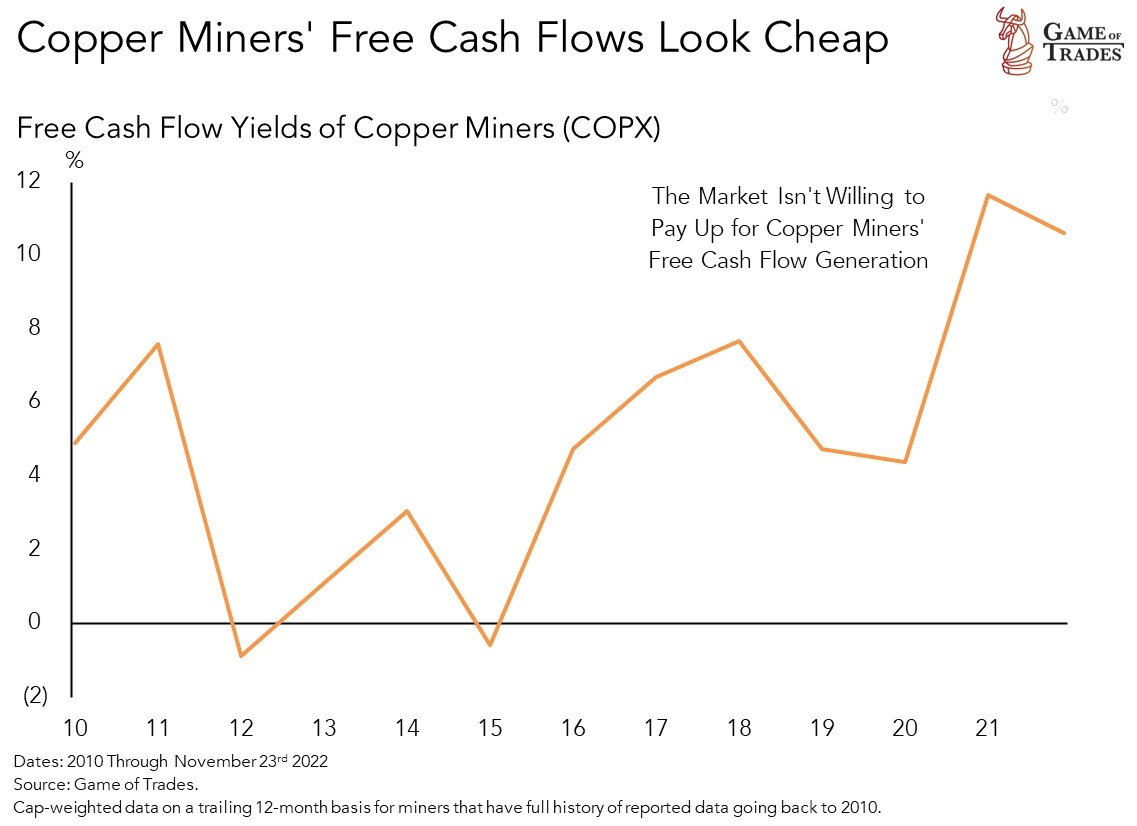
On the other hand, the free cash flow yields of the copper miners look a lot more attractive. Their high level today relative to the history of the last 10+ years indicates there’s a lot of skepticism around their free cash flow generation. That means we’re getting paid to be contrarians. In fact, copper miners offer a risk-reward ratio that’s two-times that of the underlying copper metal. Their fate is tied to that of China’s reopening, and that’s a bet we’re willing to make. As the Chinese authorities push to loosen restrictions to boost growth, we’re seeing cases rise and new restrictions put in place. The risk to our thesis is that the authorities reverse course and double-down on lockdowns. We believe, however, that the incentive to reopen the Chinese economy is now bigger than before. Global trade, a huge driver of China’s economic growth, is slowing down. The Chinese authorities are likely to stimulate organic growth to offset that deficit.
Another reason to favor copper miners is that they offer secular appeal given the metal’s use in global electrification projects. The high free cash flow yields of the miners offer a favorable starting point to bet on that long-term theme.
To fund our addition to metals and miners, we’re taking from our cash allocation and trimming our short oil (OIL), long consumer discretionary equities (XLY) and long bonds positions (TLT). As oil prices have fallen, the risk-reward of our short oil position has diminished. Our negative view on oil was documented in an article back in June, when the commodity peaked. Trimming our short oil bet doesn’t mean we see upside in oil, rather the runway for downside looks less ample than five months ago. Separately, we’re trimming our exposure to consumer discretionary stocks given their poor relative strength coming off the equity market lows of October. They group also faces idiosyncratic drags from Tesla (TSLA) and Amazon (AMZN) as the market fared little tolerance toward their lackluster Q3 earnings reports amidst their high valuations. Finally, we’re also reducing our long bond exposure (TLT) as the smaller consumer discretionary equities position calls for a smaller economic hedge.
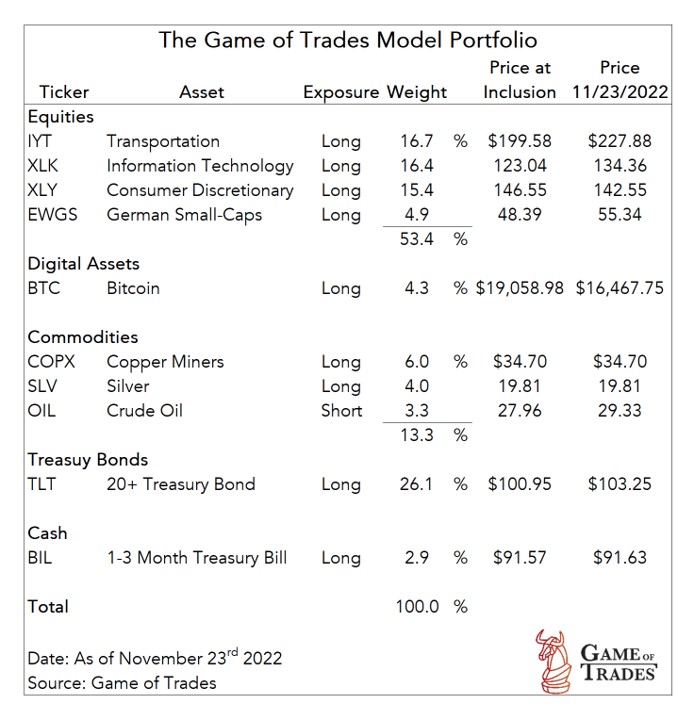
The additions and subtractions to our model portfolio are documented in the tables below, while the updated model portfolio is shown following them. Next week, we’ll follow-up our short-dollar thesis with our assessment on whether we should reduce our U.S. exposure in favor of non-U.S. equities. Stay tuned for that.
Footnotes
[1] Junior miners are generally speculative in nature. They’re engaged in the exploration and development of mineral deposits. As a result, they produce much less revenue and income than their larger competitors, the senior or major miners. Junior minors are generally highly-levered (i.e., debt-financed) and at risk of bankruptcy if the debt is due before exploration yields mineral deposits.
[2] Before 1996, the dollar represented in the chart is based on the DXY index, a weighted composite of U.S. dollar exchange rates of major developed economies like the euro-dollar (EURUSD) and the dollar-yen (USDJPY). Since 1997, the dollar represented in the chart is the trade-weighted dollar. That’s a composite of developed and emerging market U.S. dollar exchange rates weighted by bilateral trade flows, like the dollar-yuan (USDCNH) or the dollar-Mexican peso (USDMXN).
[3] Free cash flow yield is the free cash flow-per-share divided by the share price. A rising free cash flow yield indicates that the free cash flow generation (i.e., numerator) is rising relative to the share price (i.e., denominator). That implies that investors are growing skeptical of the free cash flow generation, unwilling to pay up for it.
Great content and great presentation
Strong work.
I won’t buy the copper. China isn’t reopening and they are doubling down on the Zero-Covid policy
It would be nice to see historical performance of your model portfolio, I know its new addition but would be nice to see how it is performing throughout buy and sell positions. Also, what is your thoughts on Bitcoin, and this is also a question about stop loss policy if the trade doesn’t go the way it was planned due to unpredictable events.
On a fundamental basis I am reading there will be a copper market deficit of 8 million tons by 2032.
To fill the gap the world will need 8 very large copper mines which would require over $100 Billion in investments.
I realize this is a time frame longer than observed by this service but I think it is reason to hold at least “some” longer term.
Very good info and nice to see metals back. However would PSLV be better/safer choice to invest in silver rather than SLV?
43% copper demand comes from building materials. Given China and US real estate prices are going down, new construction will be quite low. This will negatively impact demand. At the same time copper use is quite heavy in EVs and Solar energy (20% demand). Looks to me copper price may fall in short term but will rise post recession as Construction and EV sales pick up. Attaching reference demand distribution of copper. What do you think?
https://geology.com/usgs/uses-of-copper/
[…] We added COPX in November as a bet on a falling dollar and a reopening in China. Since inclusion, COPX has outperformed the S&P 500 by 10 pp. […]
[…] also increased our allocation to SLV, a physical Silver ETF. We’ve had silver in our portfolio since November, when we initiated it as a levered bet on the dollar […]