As investors closely monitor the yield curve’s signals of an impending economic downturn in the United States, it becomes crucial to understand its historical reliability and the potential implications for the stock market. This article delves into the significance of the yield curve as a recession predictor, examines recent market dynamics, and provides insights into the potential impact on the economy and stock market.
The Yield Curve’s Historical Reliability
For decades, the yield curve has served as a reliable indicator of an impending recession in the US. Since 1963, an inversion of the yield curve has consistently preceded economic downturns, making it a vital tool for forecasting. This inversion, where short-term interest rates exceed long-term rates, typically occurs around 12 months before a recession.
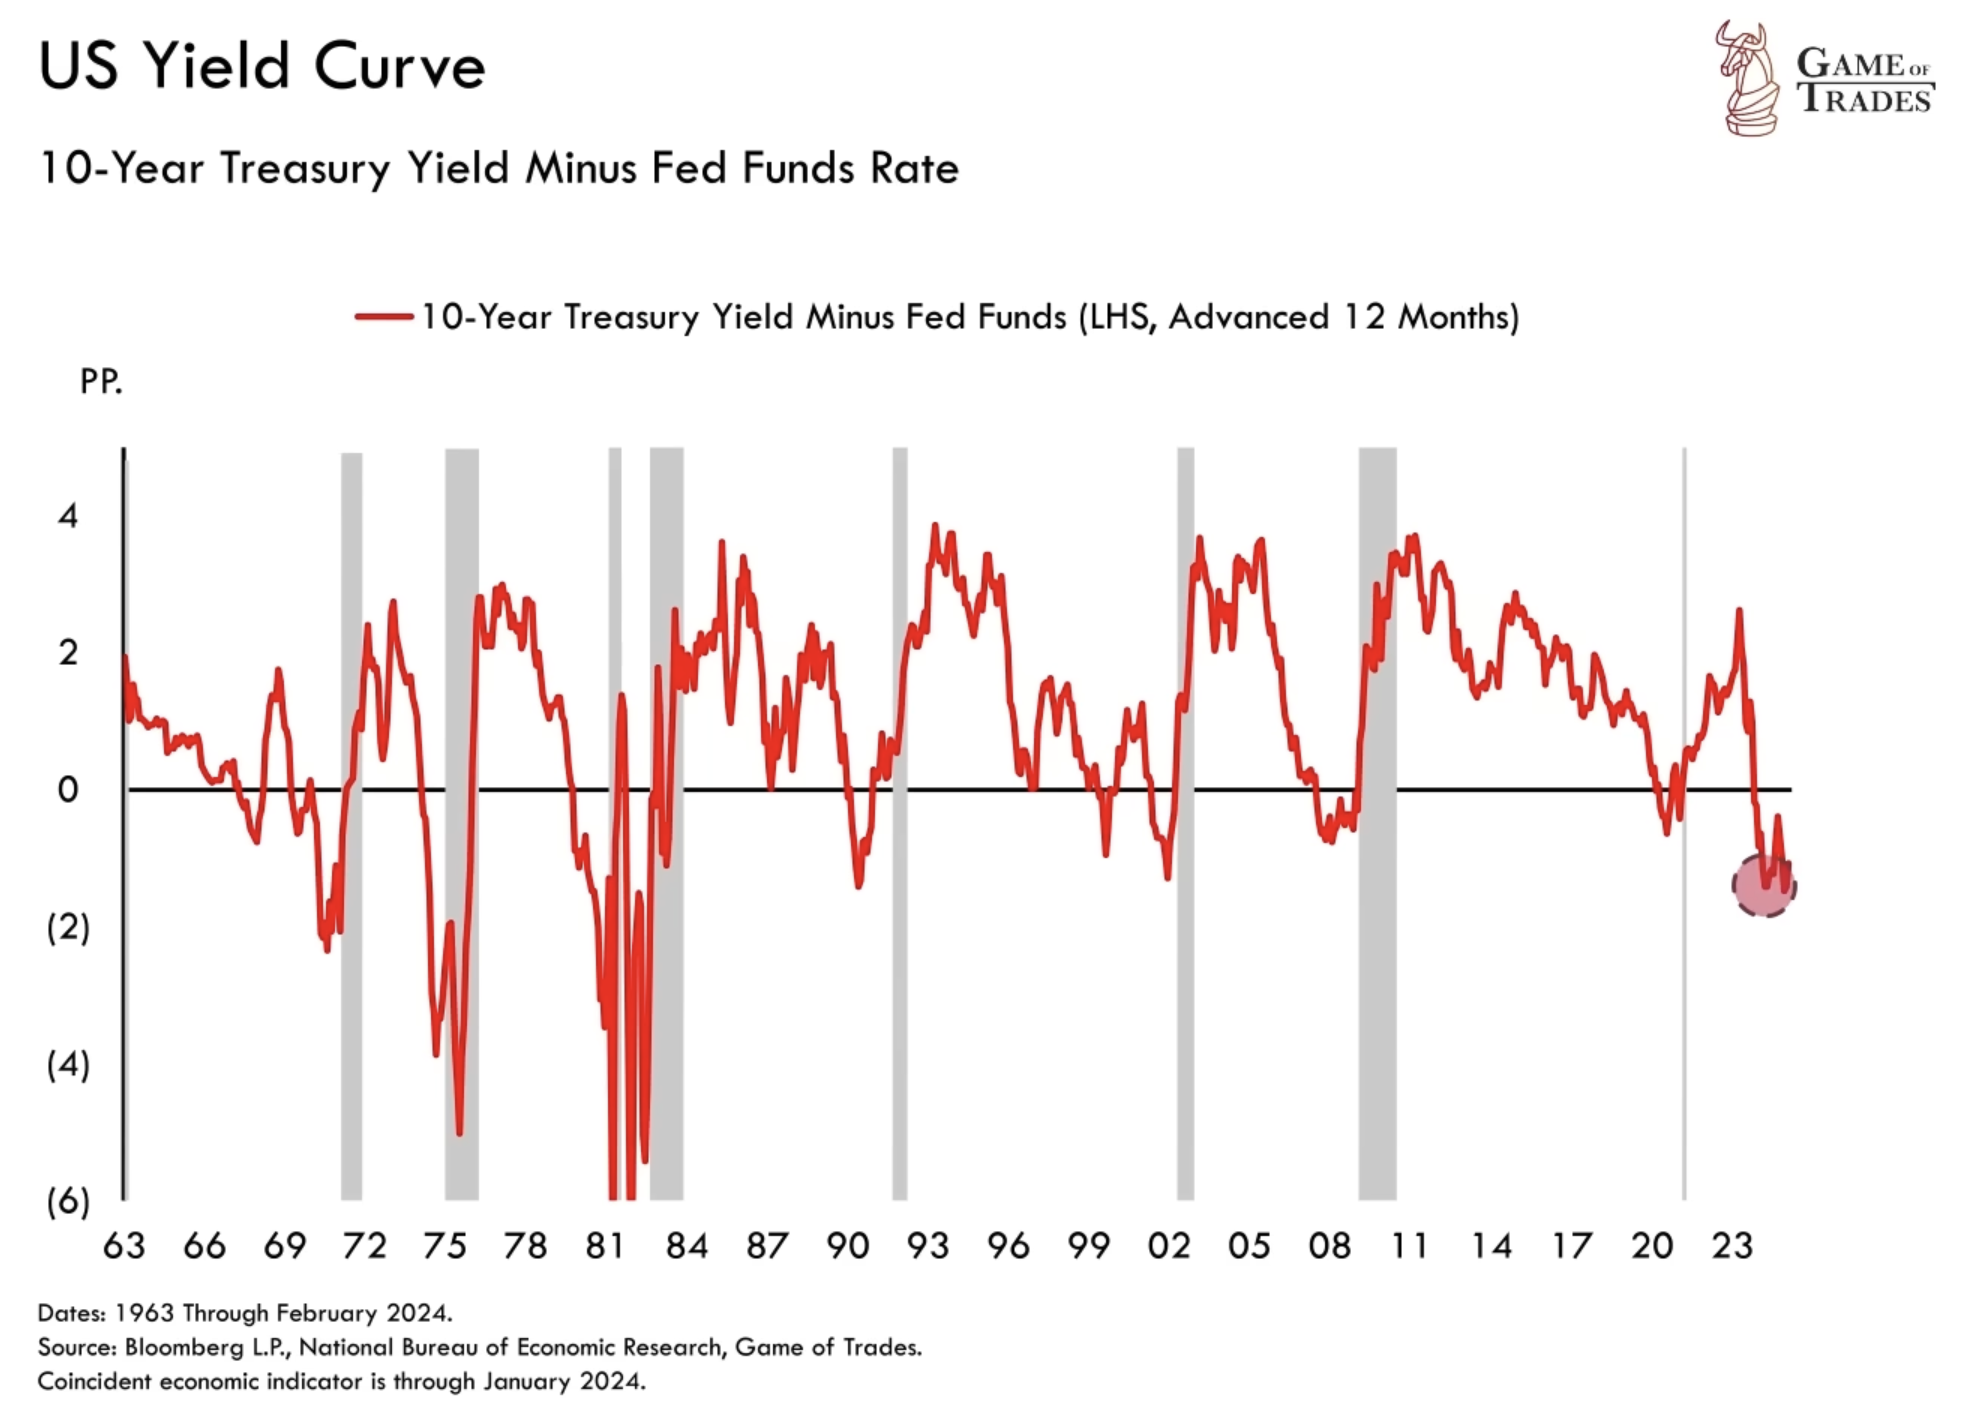
To assess the likelihood of future economic growth or contraction, economists often compare economic indicators to the yield curve advanced by 12 months. This analysis provides valuable insights into the direction of the US economy. Historically, a yield curve inversion has indicated an imminent economic downturn within the next year, although there is some variability in this time lag.
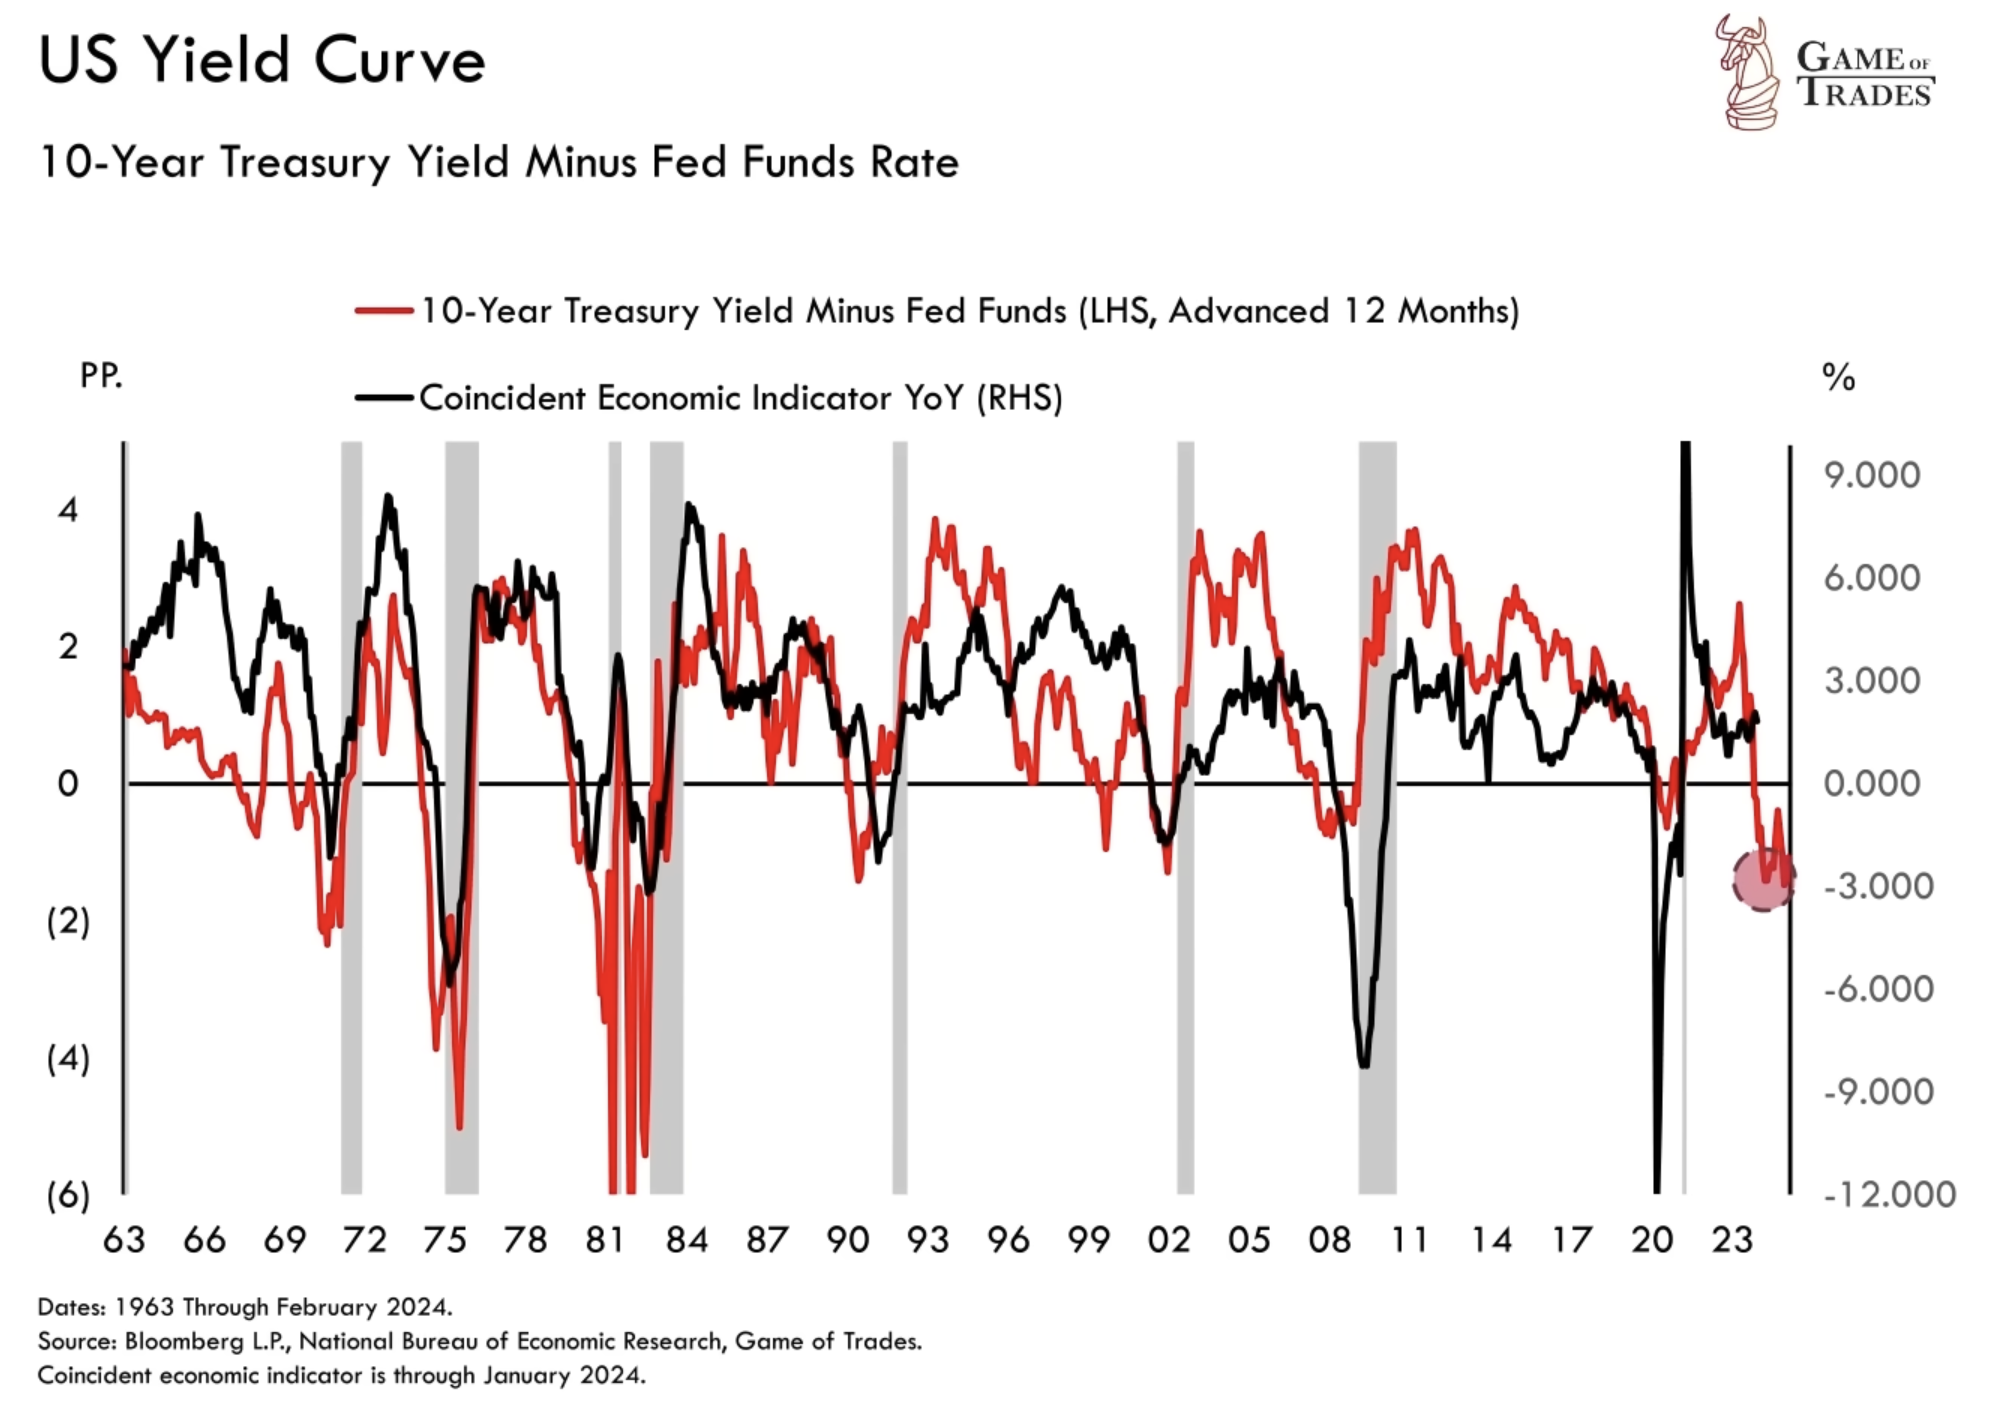
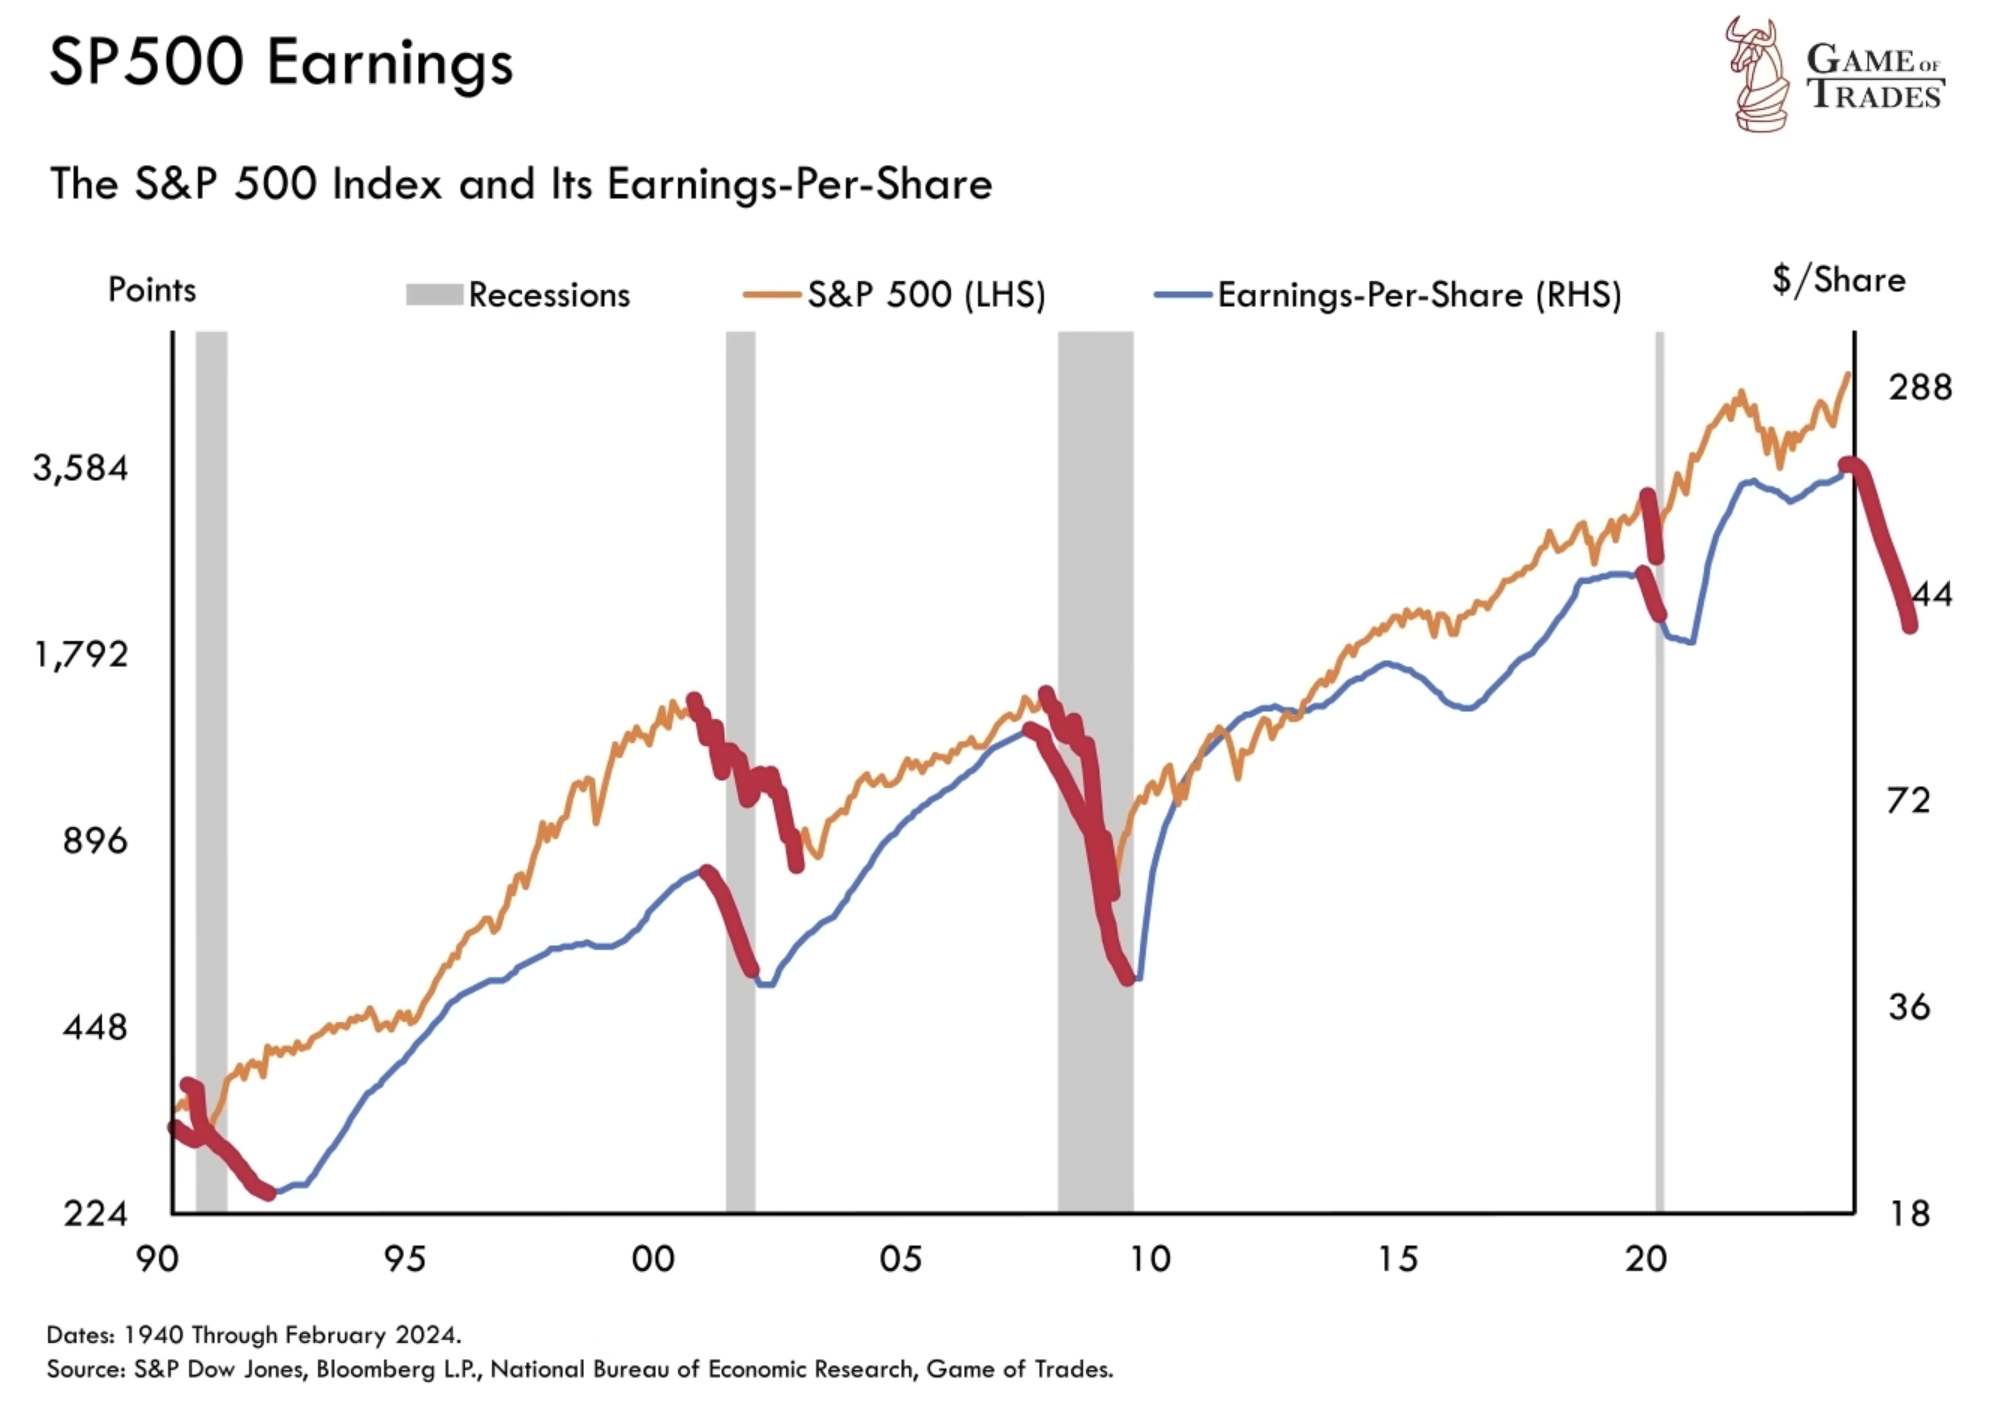
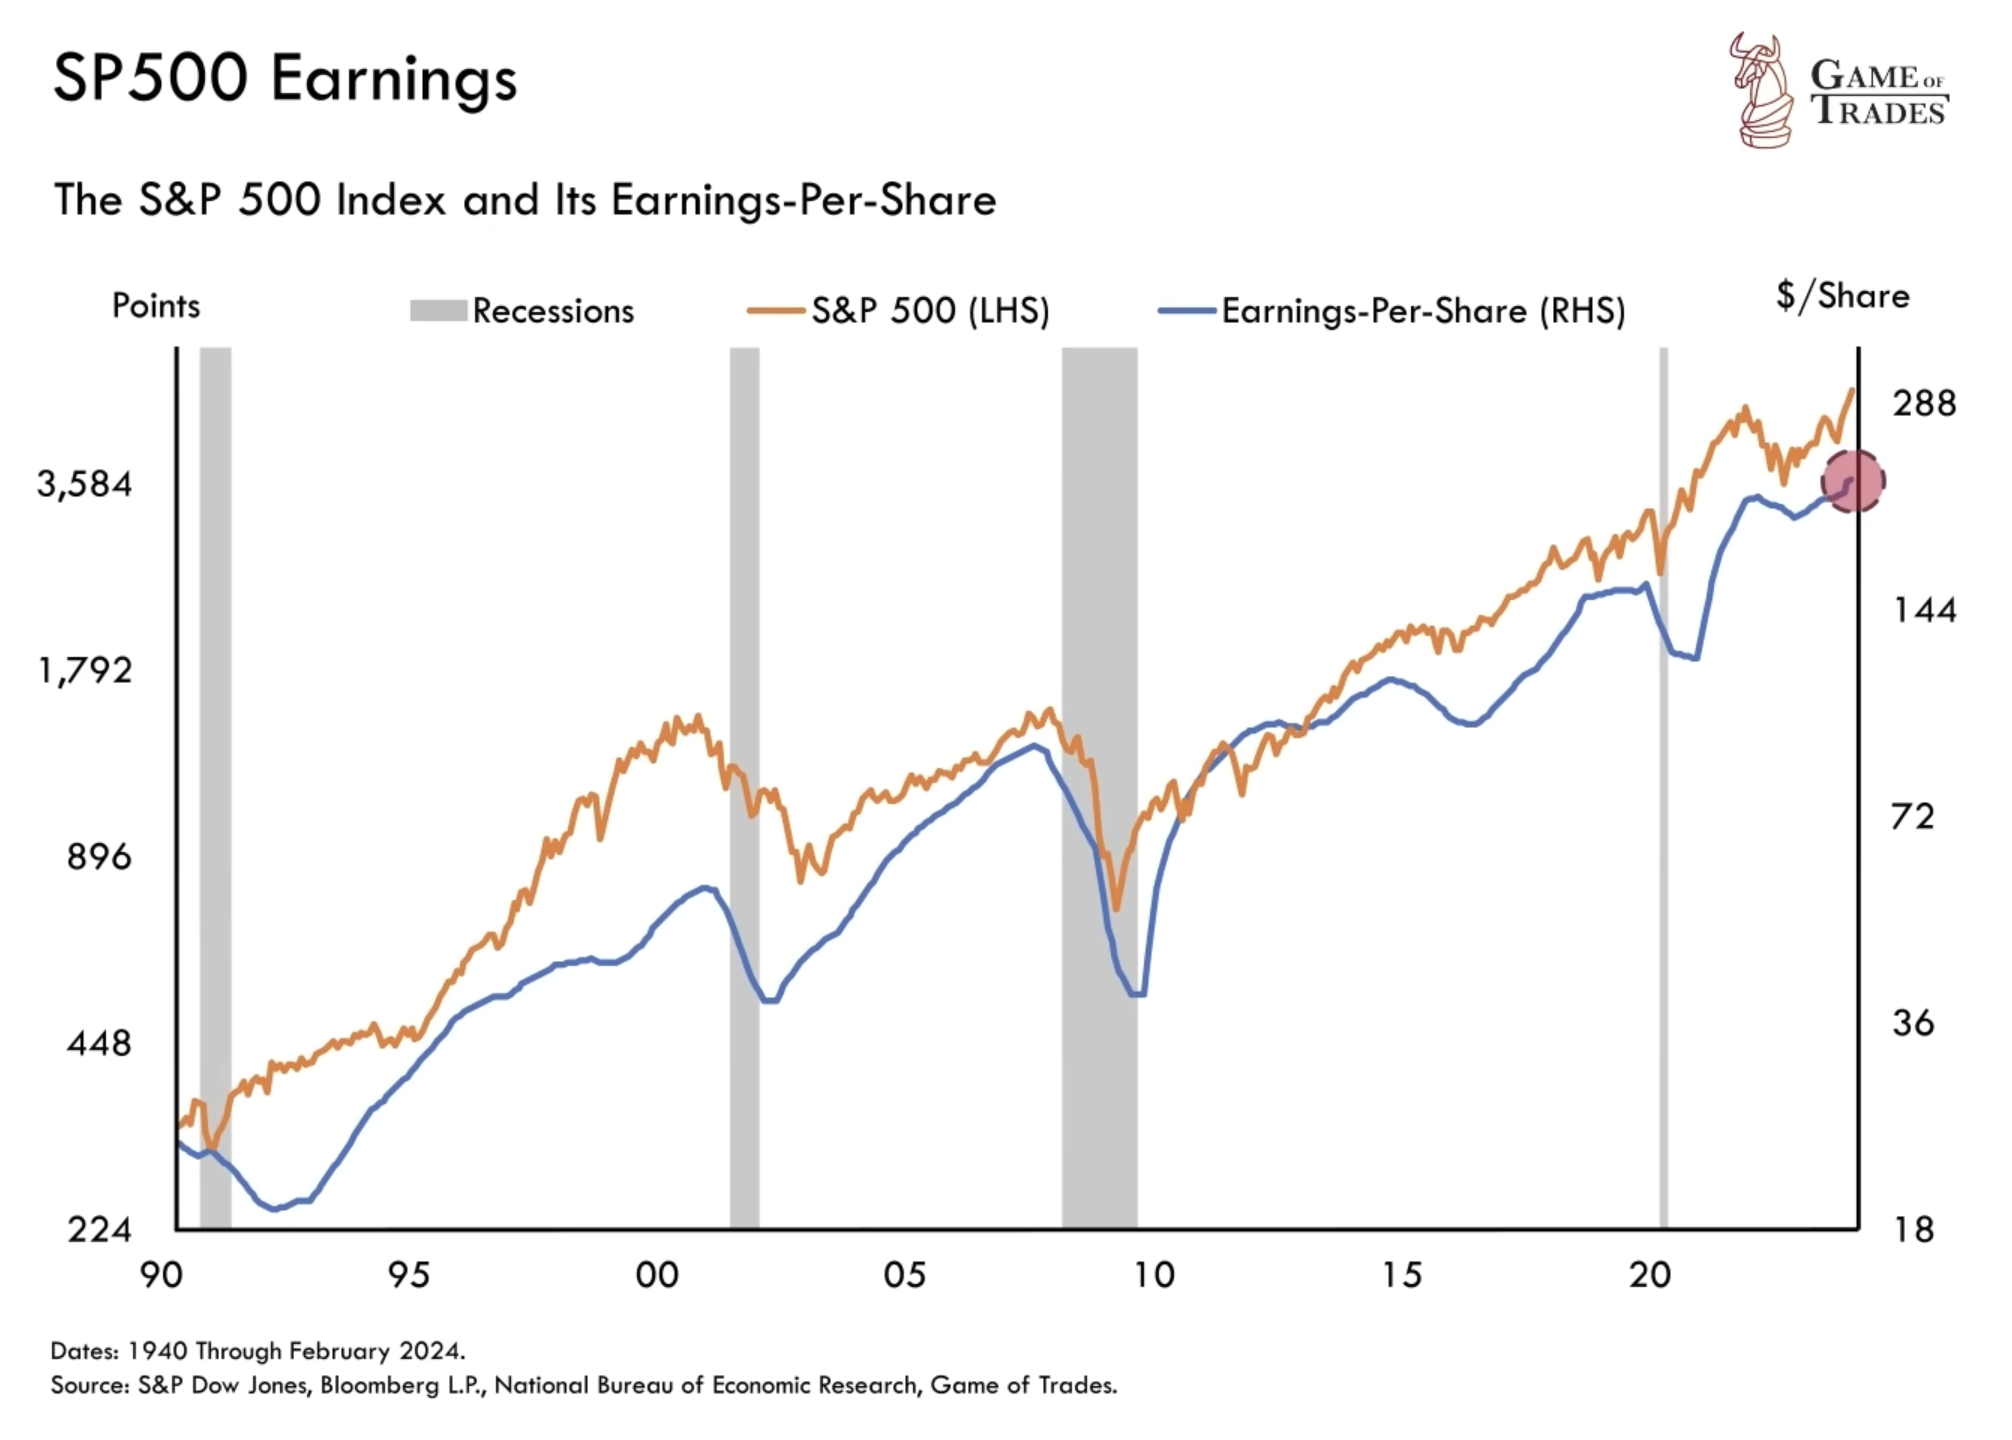
Based on historical recessions, a yield curve inversion followed by a recession would typically lead to declining S&P 500 earnings and subsequent market decline. However, despite the prolonged yield curve inversion, the anticipated recession and the downturn in earnings followed by negative market impact has not materialized as expected. This deviation from historical patterns raises questions about the current economic landscape.
Resilient Stock Market Earnings
Contrary to expectations, stock market earnings have remained stable over the past year, defying forecasts of a decline. This miscalculation underestimates the underlying strength of the economy. Importantly, the some current economic indicators do not exhibit the same warning signs seen during the peaks of 2007 and 2000, suggesting a different market dynamic for now.
Labor Market Resilience: Initial Jobless Claims and Recession Signals
Traditionally, upward trends in initial jobless claims have signaled impending job losses and recessions. However, in the current economic environment, initial claims continue to trend lower, indicating a resilient labor market. While this suggests a favorable employment landscape, it does not guarantee the absence of a recession, as historical instances have shown reversals in claims for unexpected reasons leading to economic downturns.
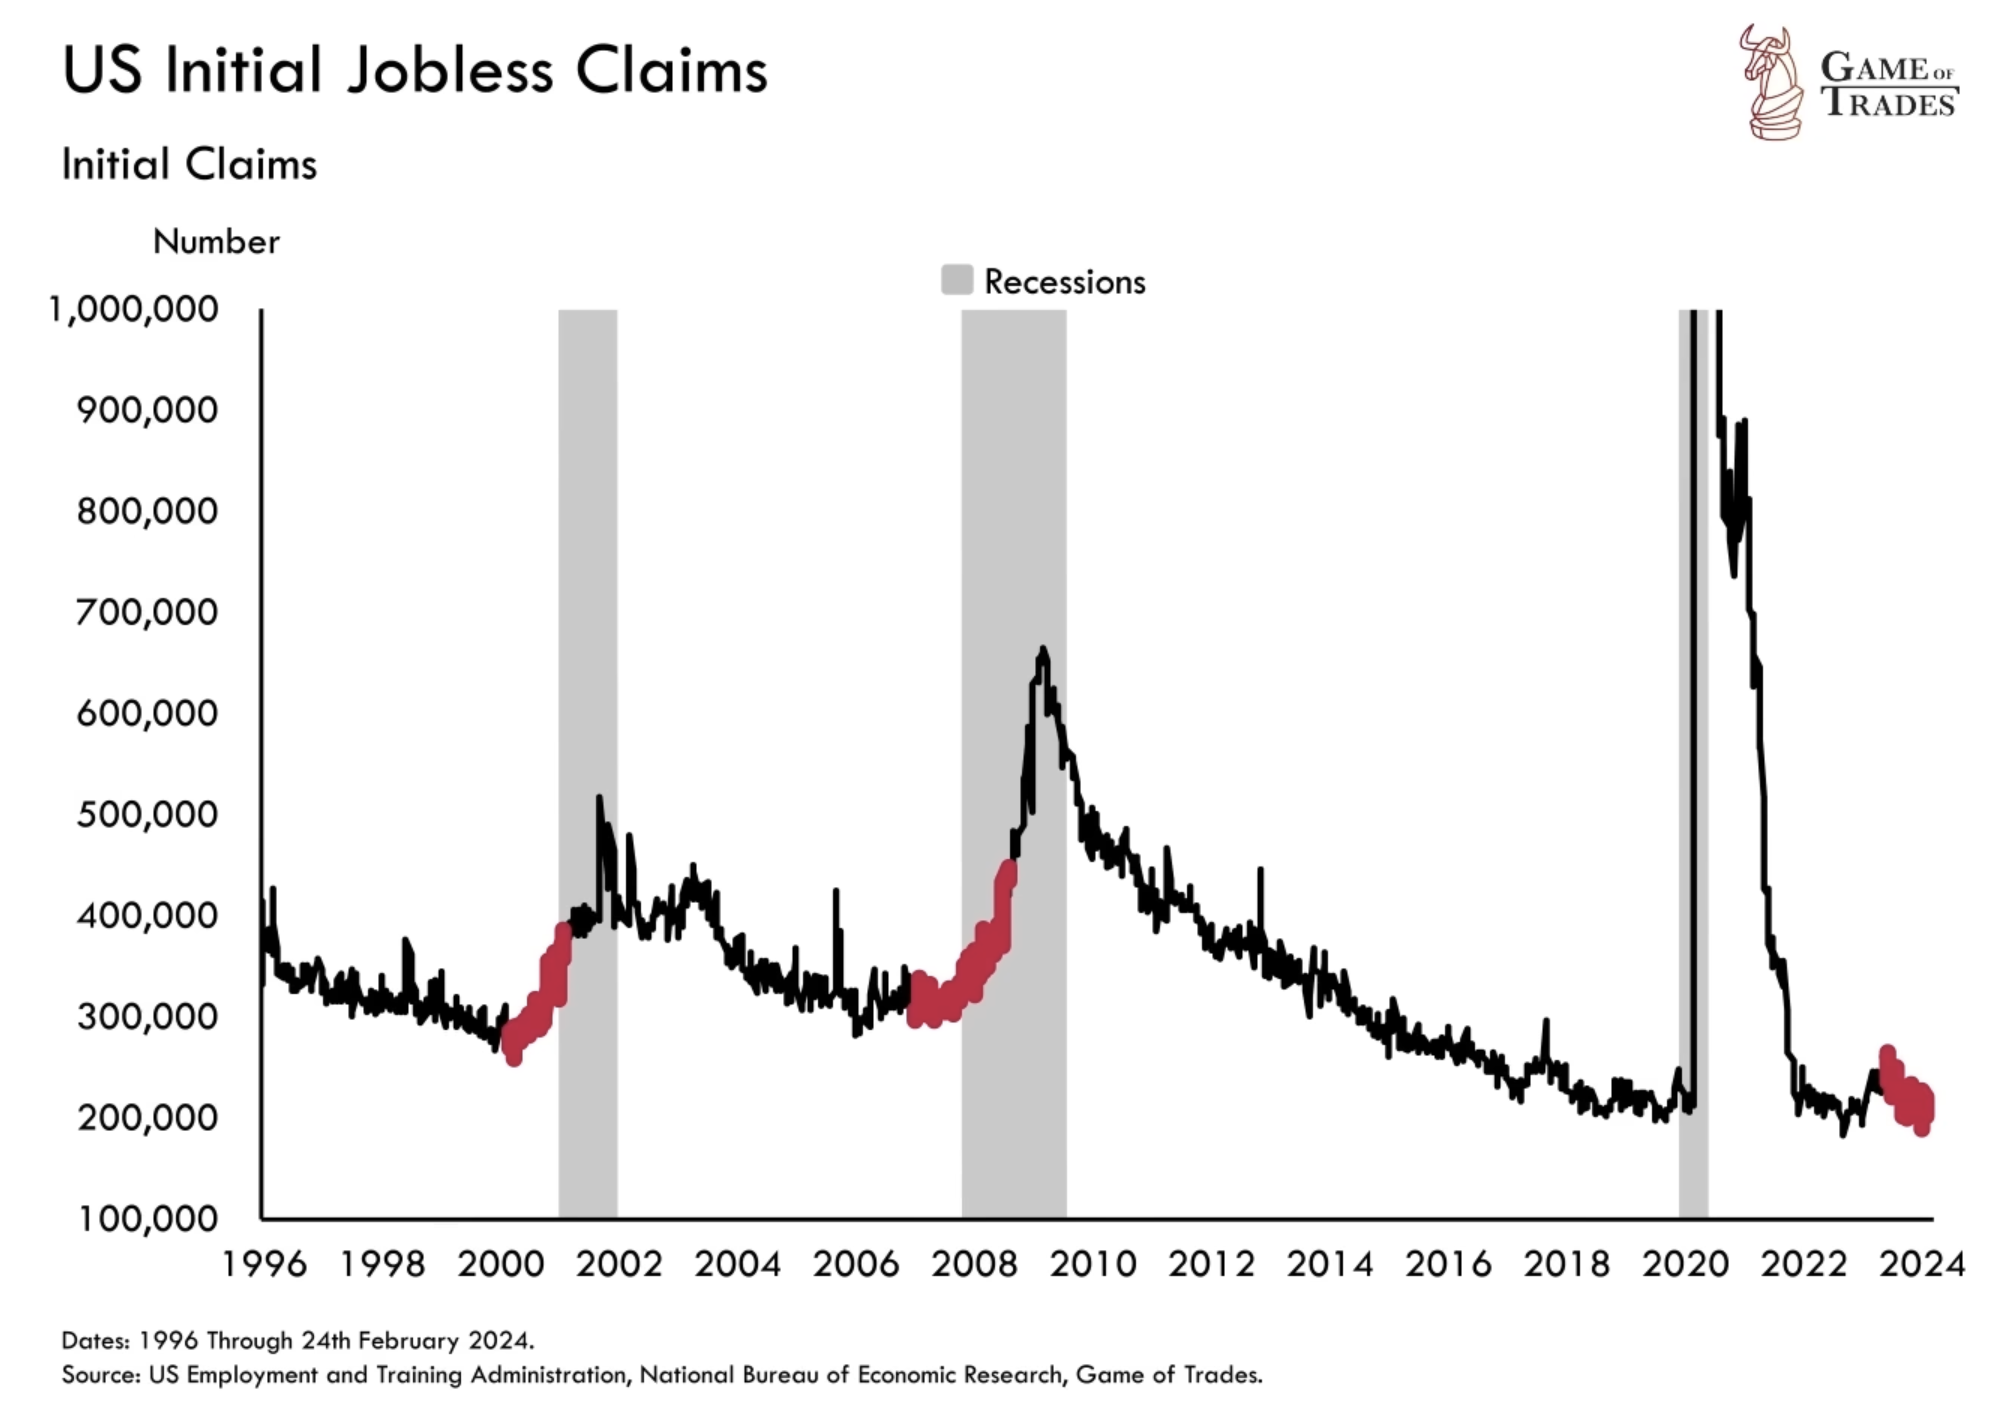
The absence of a clear catalyst for potentially rising initial claims may seem perplexing. However, similar occurrences were observed in 2007 and 2000 when unexpected increases in claims transpired without apparent reasons. Job losses can be part of the natural business cycle, and unforeseen events can trigger changes in employment dynamics. Therefore, it is essential to consider broader economic factors when analyzing employment data.
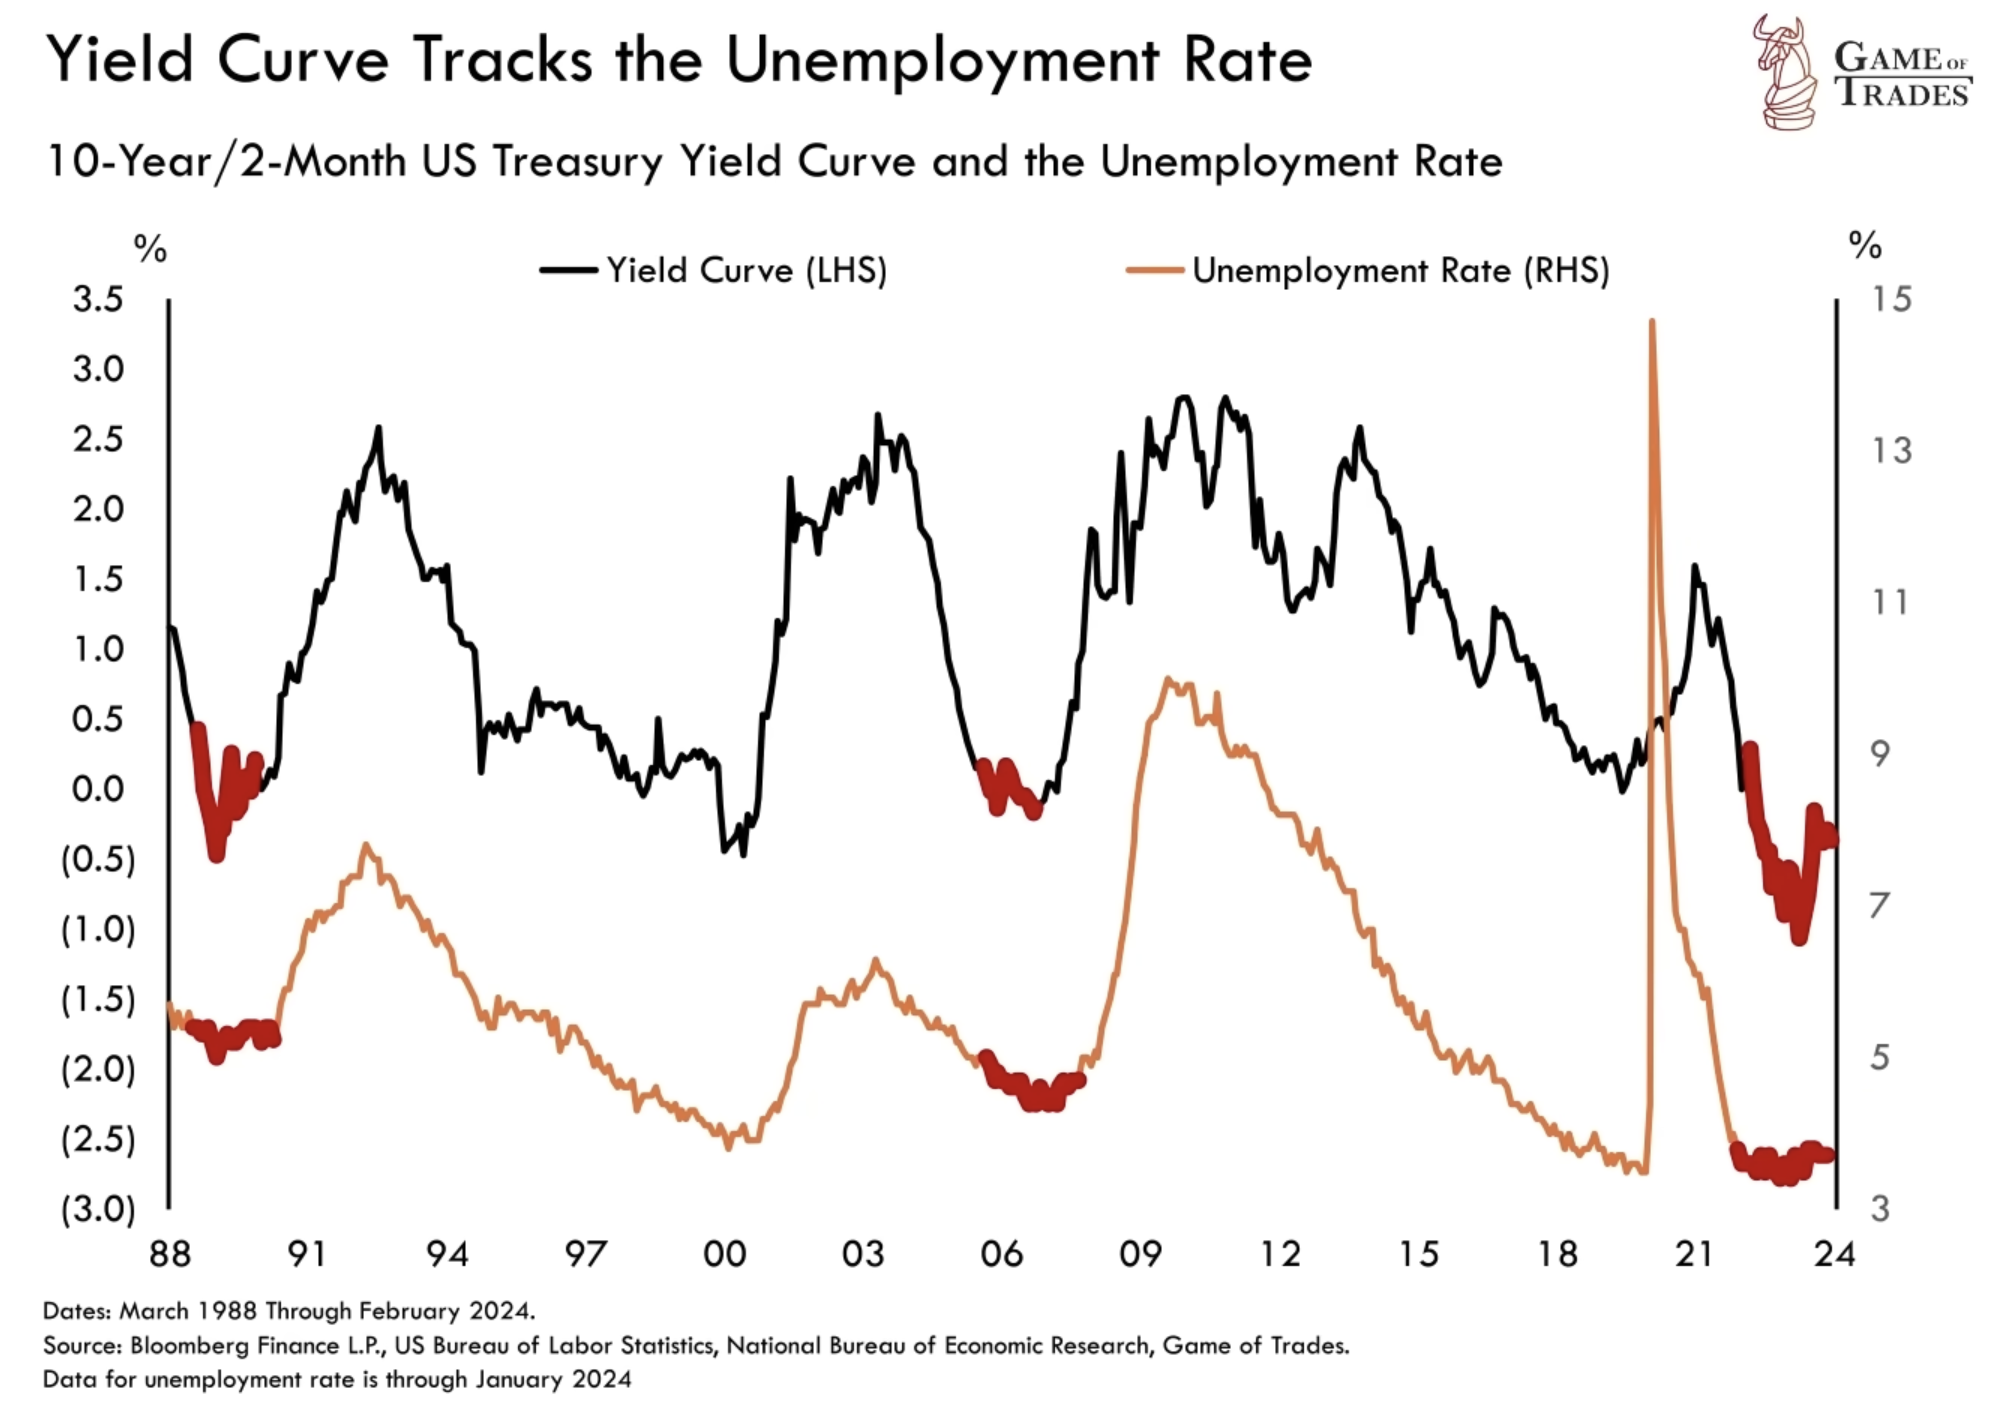
Yield Curve Steepening and Employment
Historically, when the yield curve steepens after an inversion, the unemployment rate tends to rise. Although recent observations show some steepening without a noticeable impact on unemployment, it is premature to conclude that the current yield curve will not lead to an increase in joblessness, as seen in previous recessions.
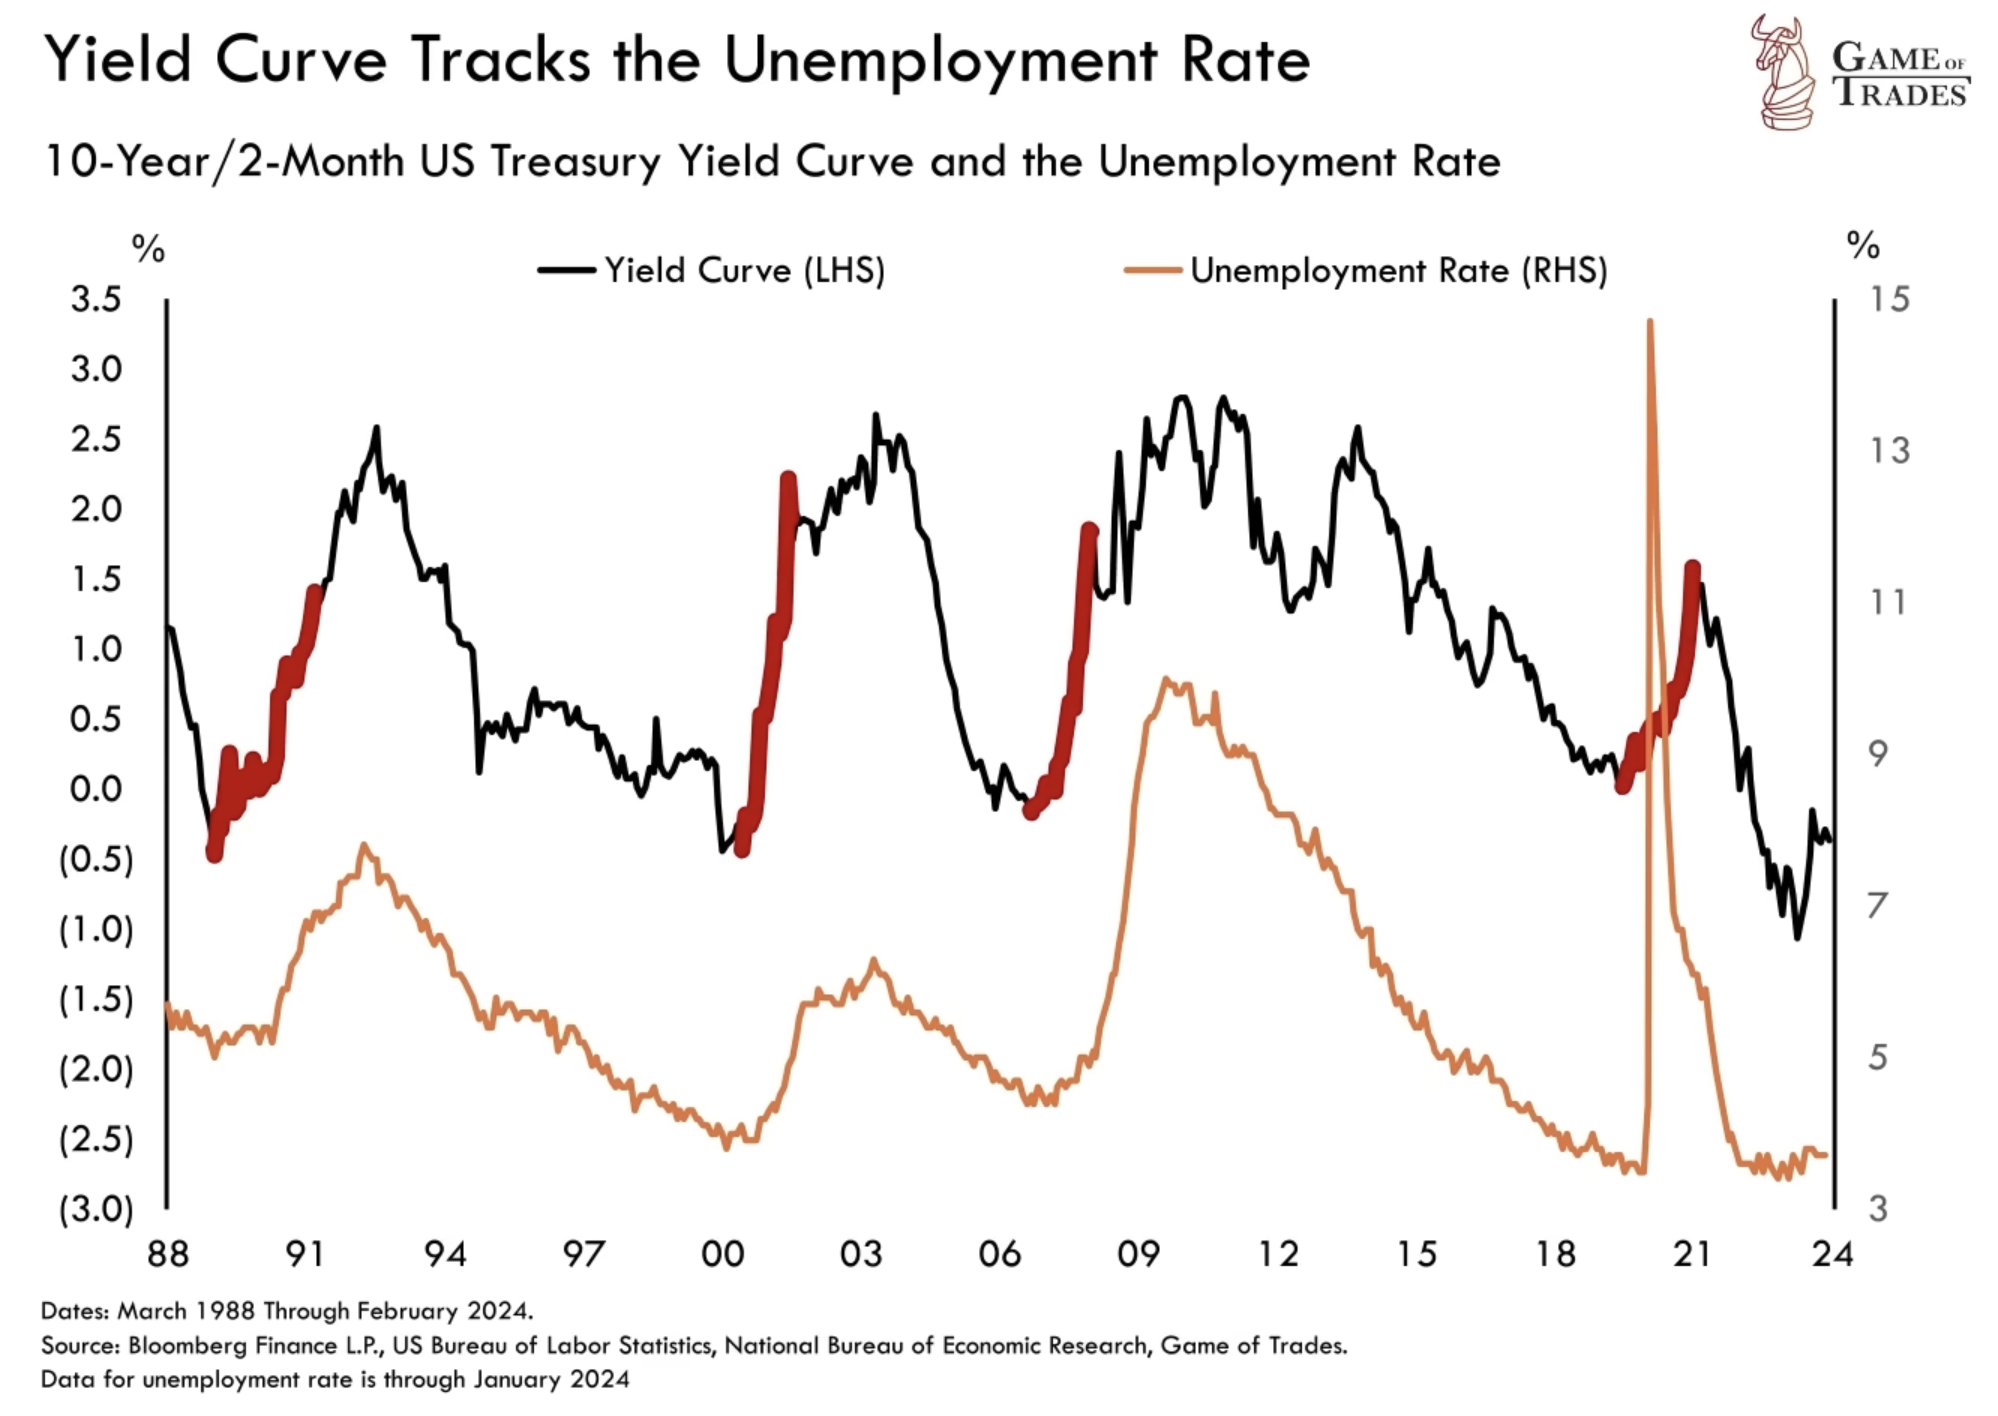
Despite the prolonged yield curve inversion, the unemployment rate has remained low, and the economy has demonstrated resilience. Similar instances were observed in 2006 and 1989 when prolonged yield curve inversions coexisted with low unemployment rates and a robust economy. These periods highlight the challenge of timing market behavior solely based on the yield curve inversion, emphasizing the importance of considering other economic indicators.
Market Analysis: Breakout Patterns and Vulnerabilities
The stock market has recently broken out of a significant basing pattern, with the 100 and 200-day moving averages pointing upwards, indicating strong momentum. However, caution is advised as the market appears overextended and vulnerable to a potential near-term pullback, as seen in previous instances in August 2023, August 2022, March 2022, and November 2021.
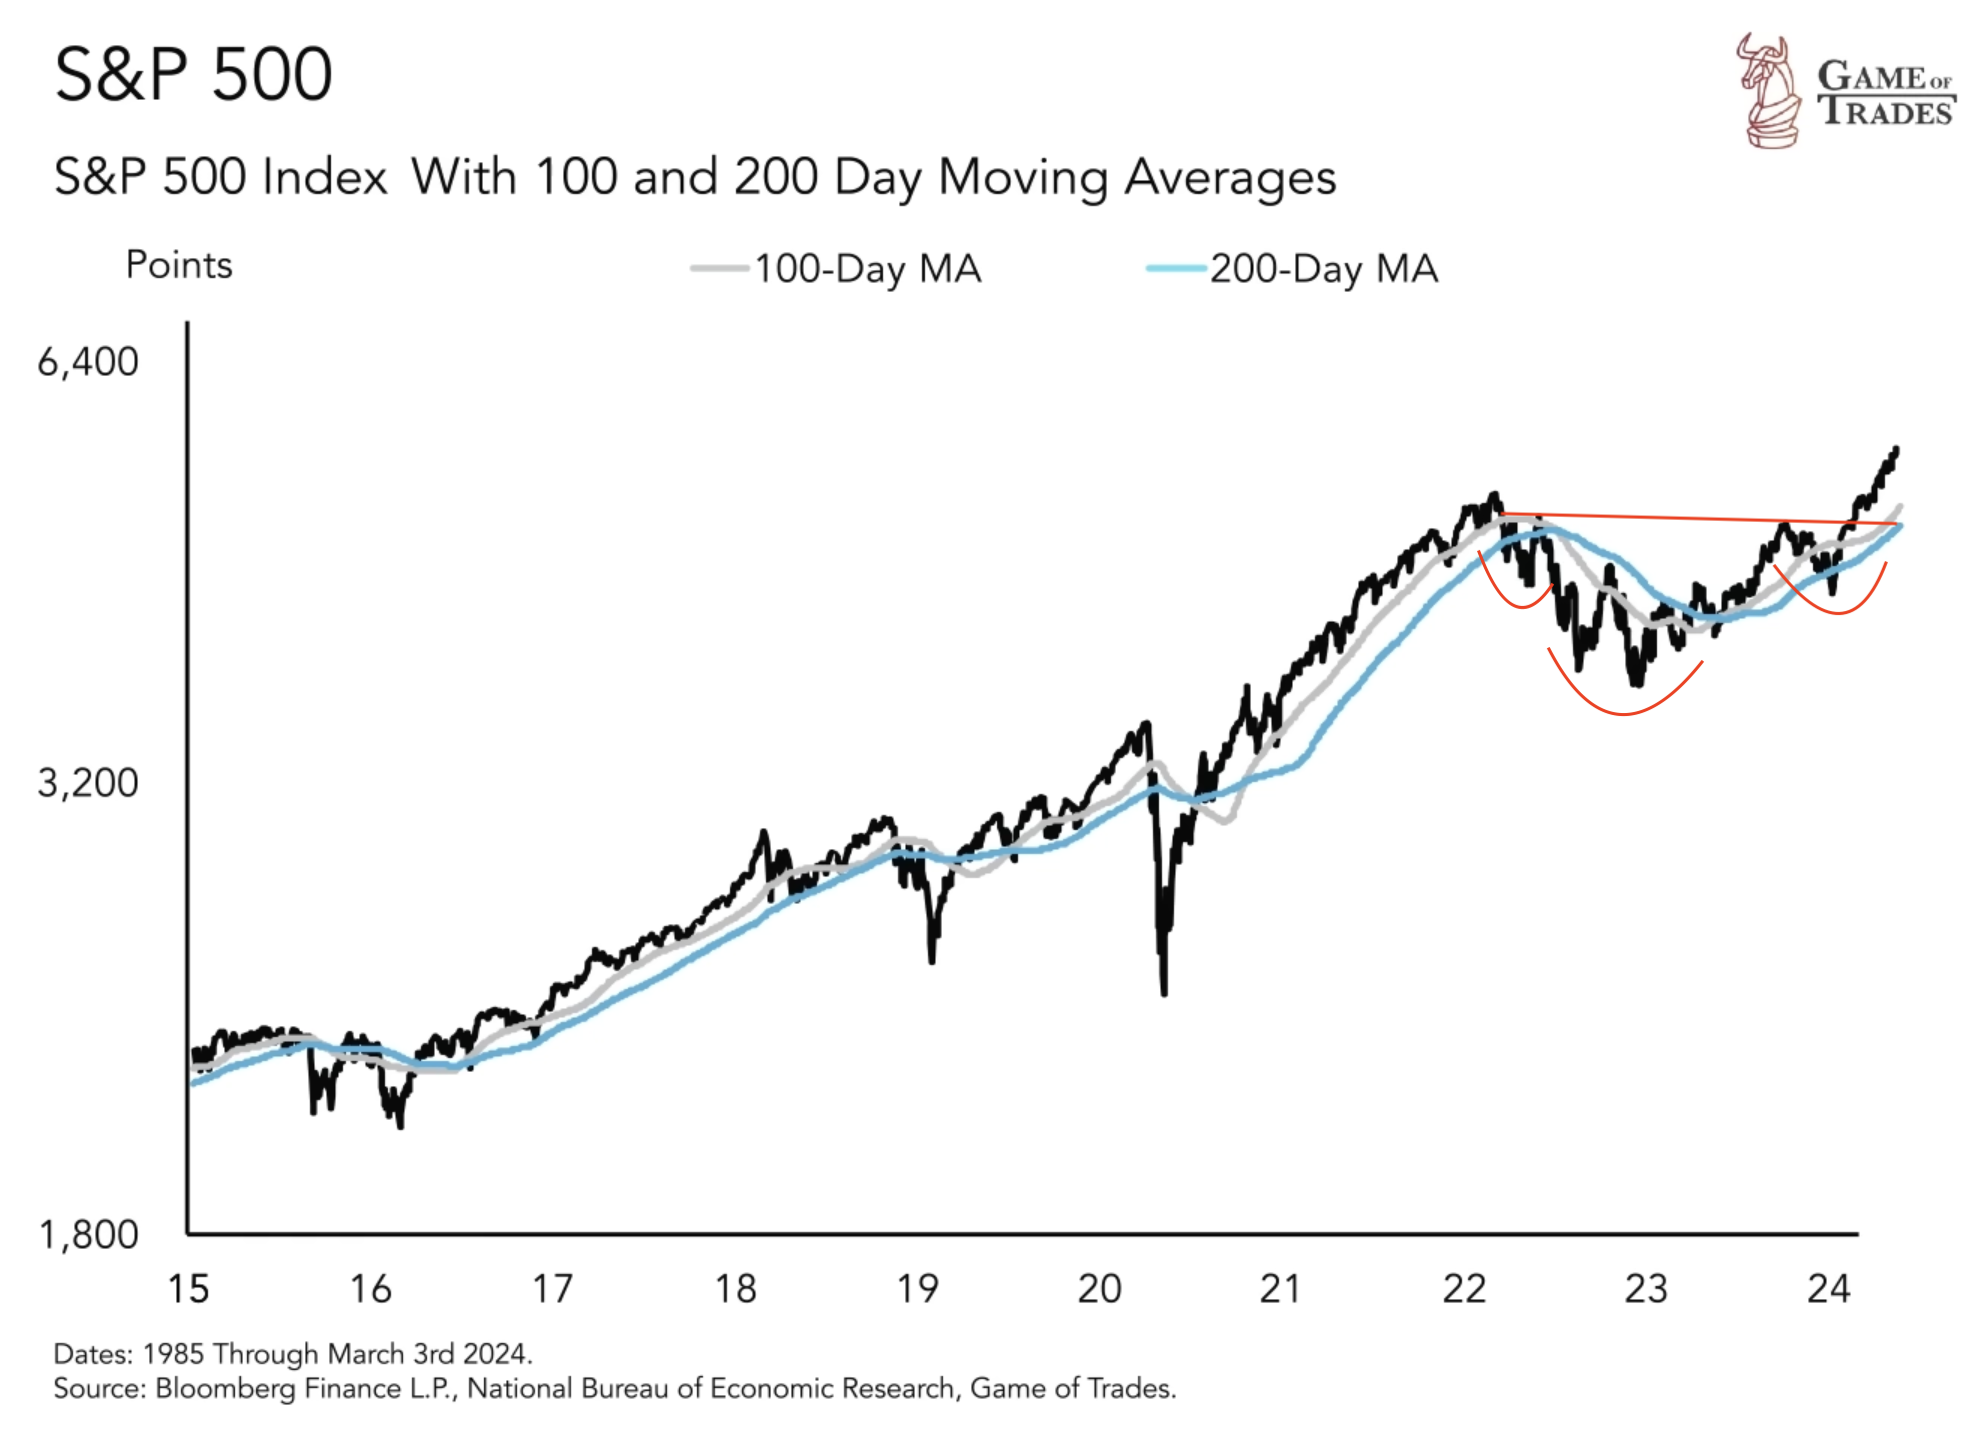
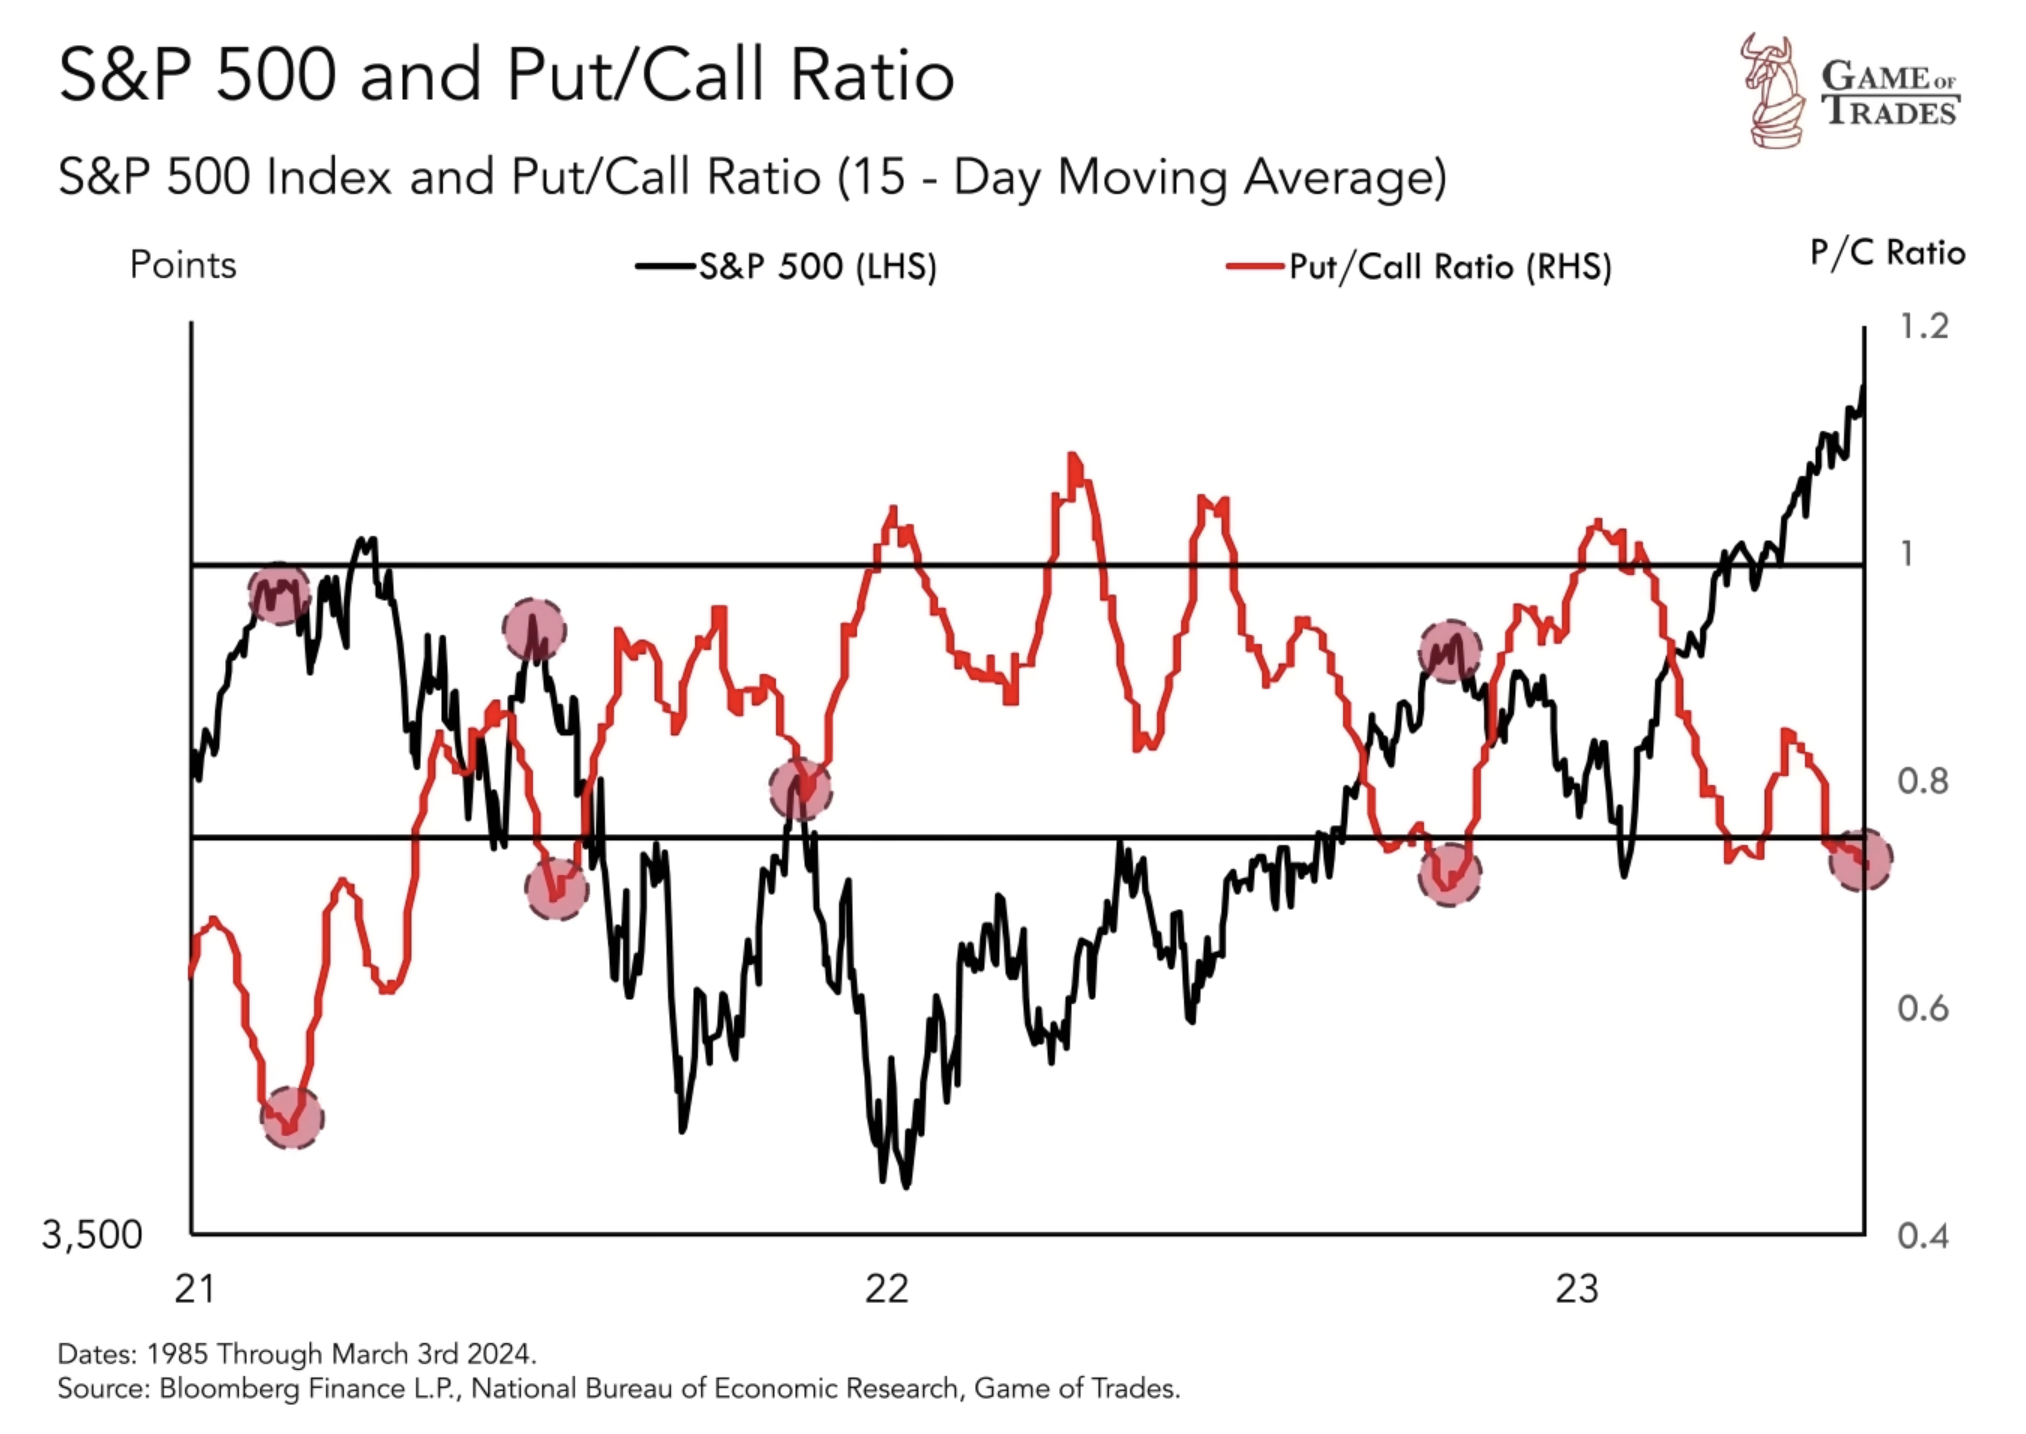
The current extremely low put-call ratio, indicating a higher number of call options compared to put options, raises concerns about market complacency. Historically, such low ratios have coincided with market tops, suggesting that more investors are betting on upward moves. However, it is important to note that the put-call ratio is not a foolproof signal and should be considered alongside other market indicators.
Conclusion
While the stock market may face a near-term pullback, it is important to acknowledge the predictive power of the yield curve in signaling an impending recession. However, the current yield curve does not appear to indicate an immediate massive stock market top. Investors should closely monitor economic indicators, market dynamics, and risk management strategies to navigate this complex landscape effectively. A confluence of factors is extremely important in determining a high probability outcome. Click here to get free trial for 7 days! Subscribe to our YouTube channel and Follow us on Twitter for more updates!
Read more: Is a US Recession Inevitable?


