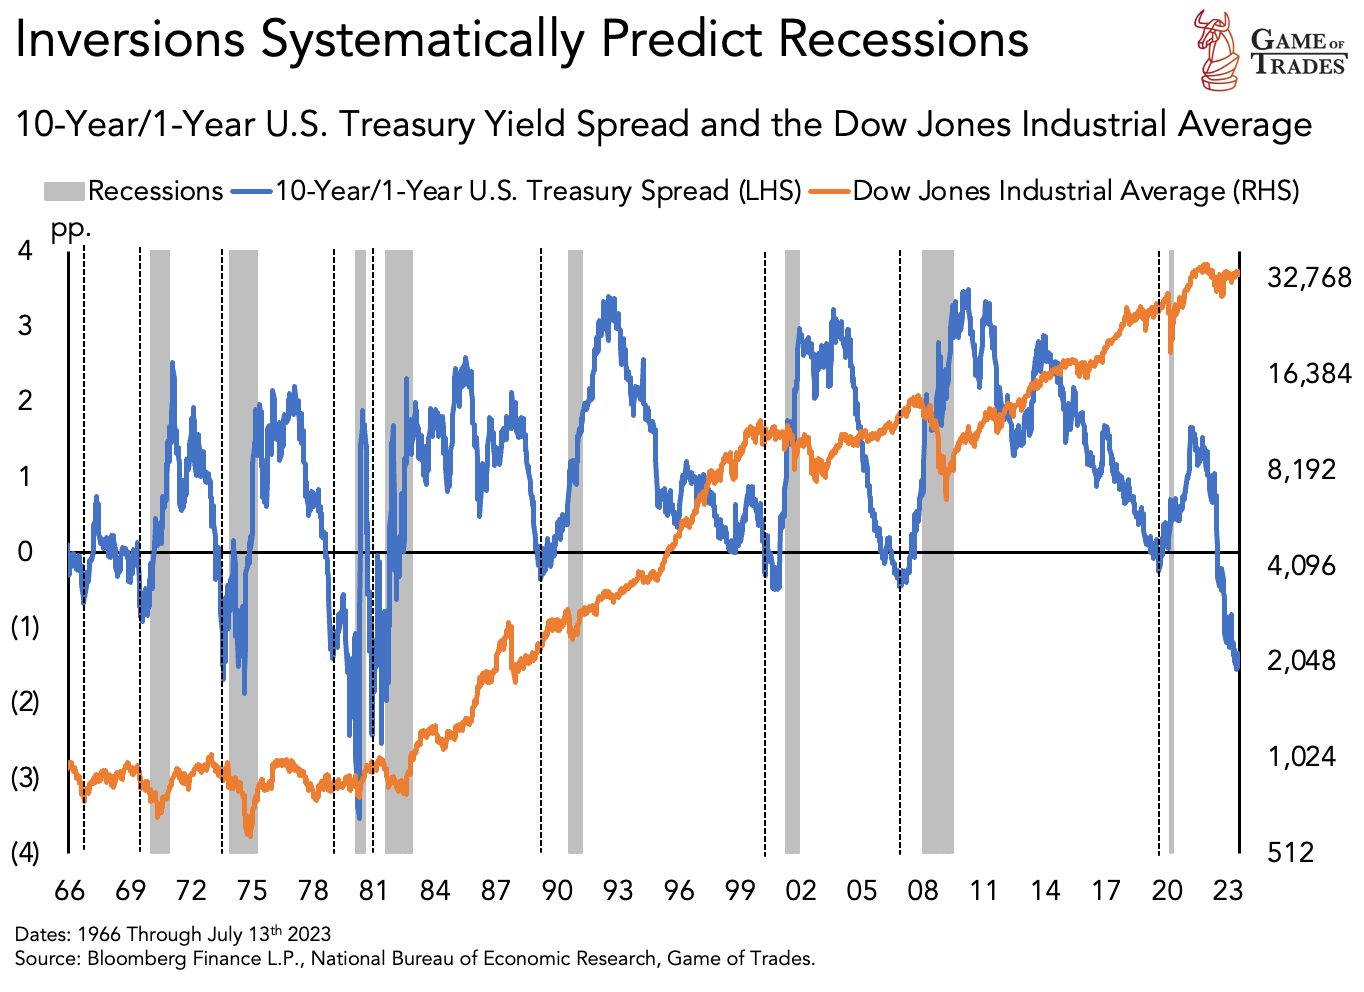
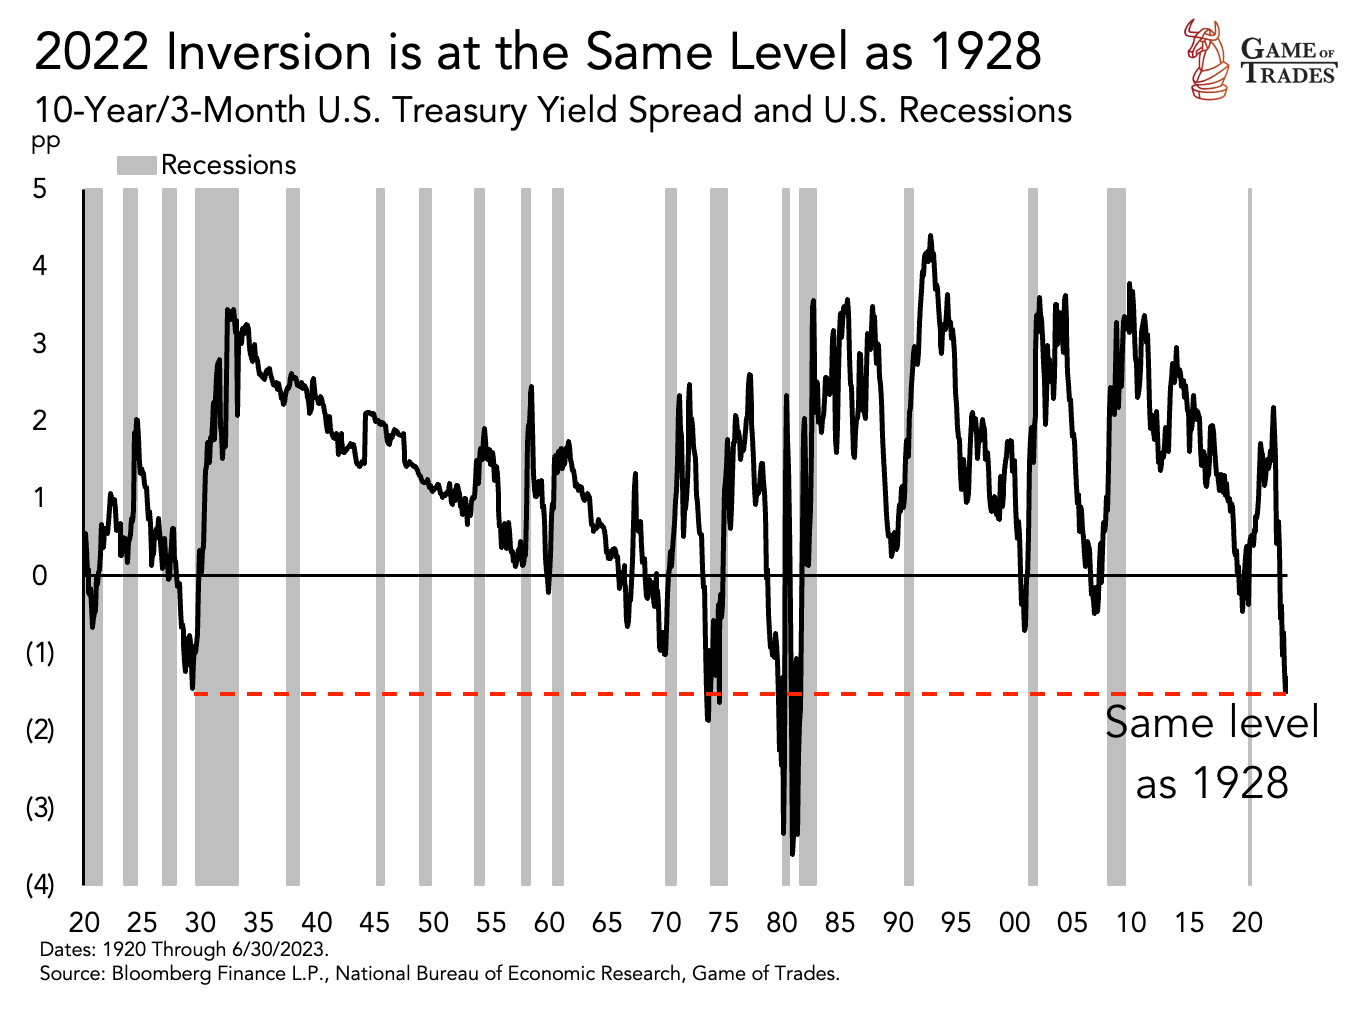
An inverted yield curve occurs when long-term interest rates fall below short-term rates. Yield curve inversions have long been regarded as potential indicators of an impending recession. This article delves into a comparative analysis of 5 key inversion periods: 1928, the 1970s, 1989, 2000, and 2006, to provide insights into the current 2022/2023 inversion. This article explores the historical patterns, market reactions, and potential explanations for the divergence observed in today’s market.
Yield Curve Inversions and Recessions in the 1960s and 1970s
During the 1960s and 1970s, yield curve inversions were followed by recessions relatively quickly (within 12 months). Notable examples include the recessions of 1969, 1974, 1979, and 1981. In each case, equities experienced a downturn.
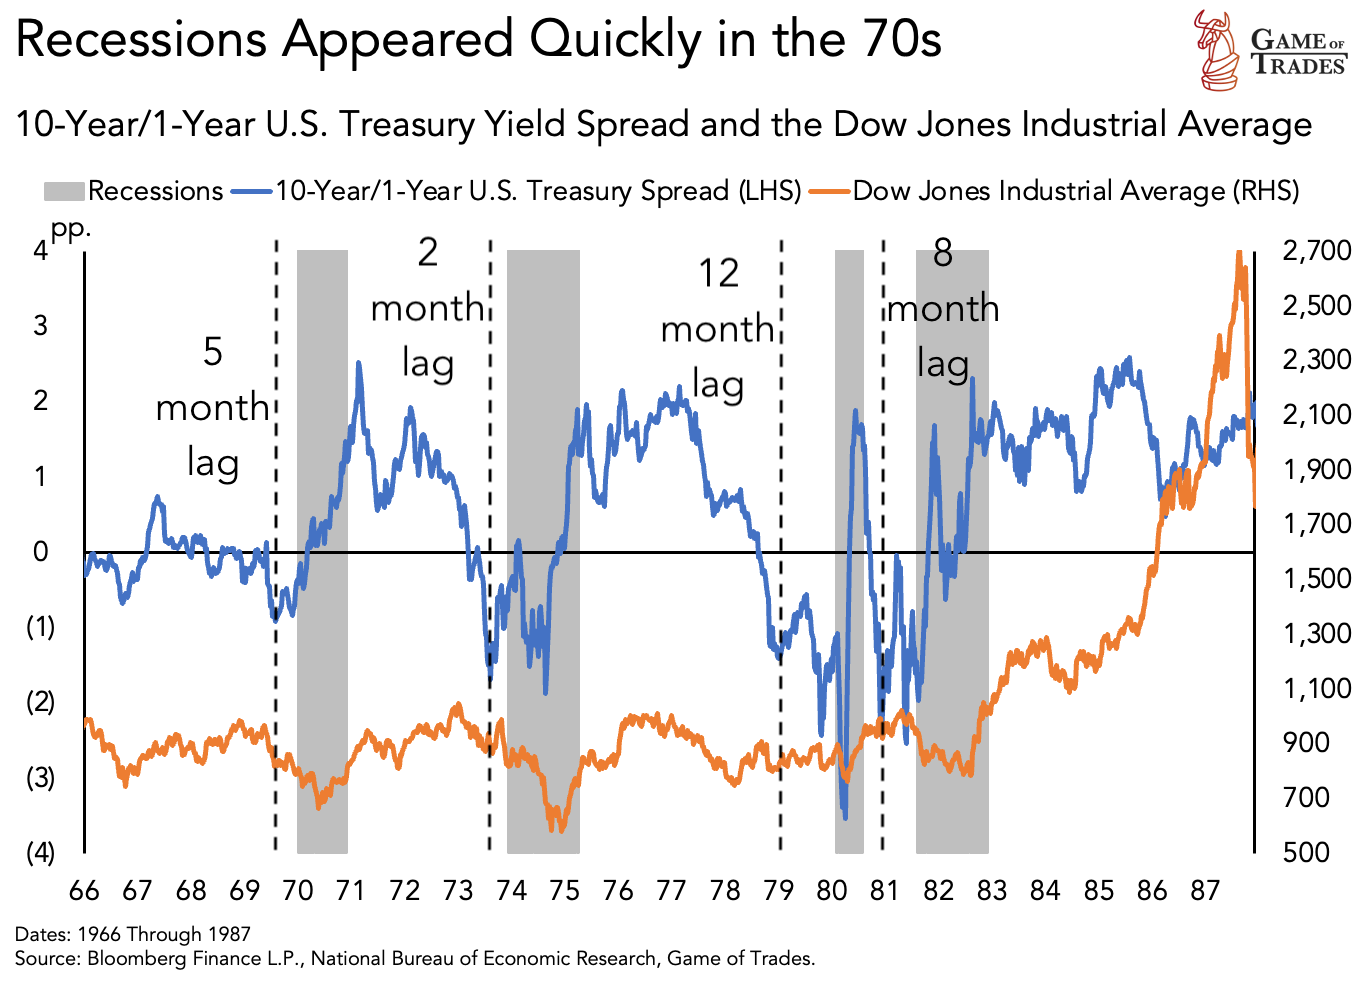
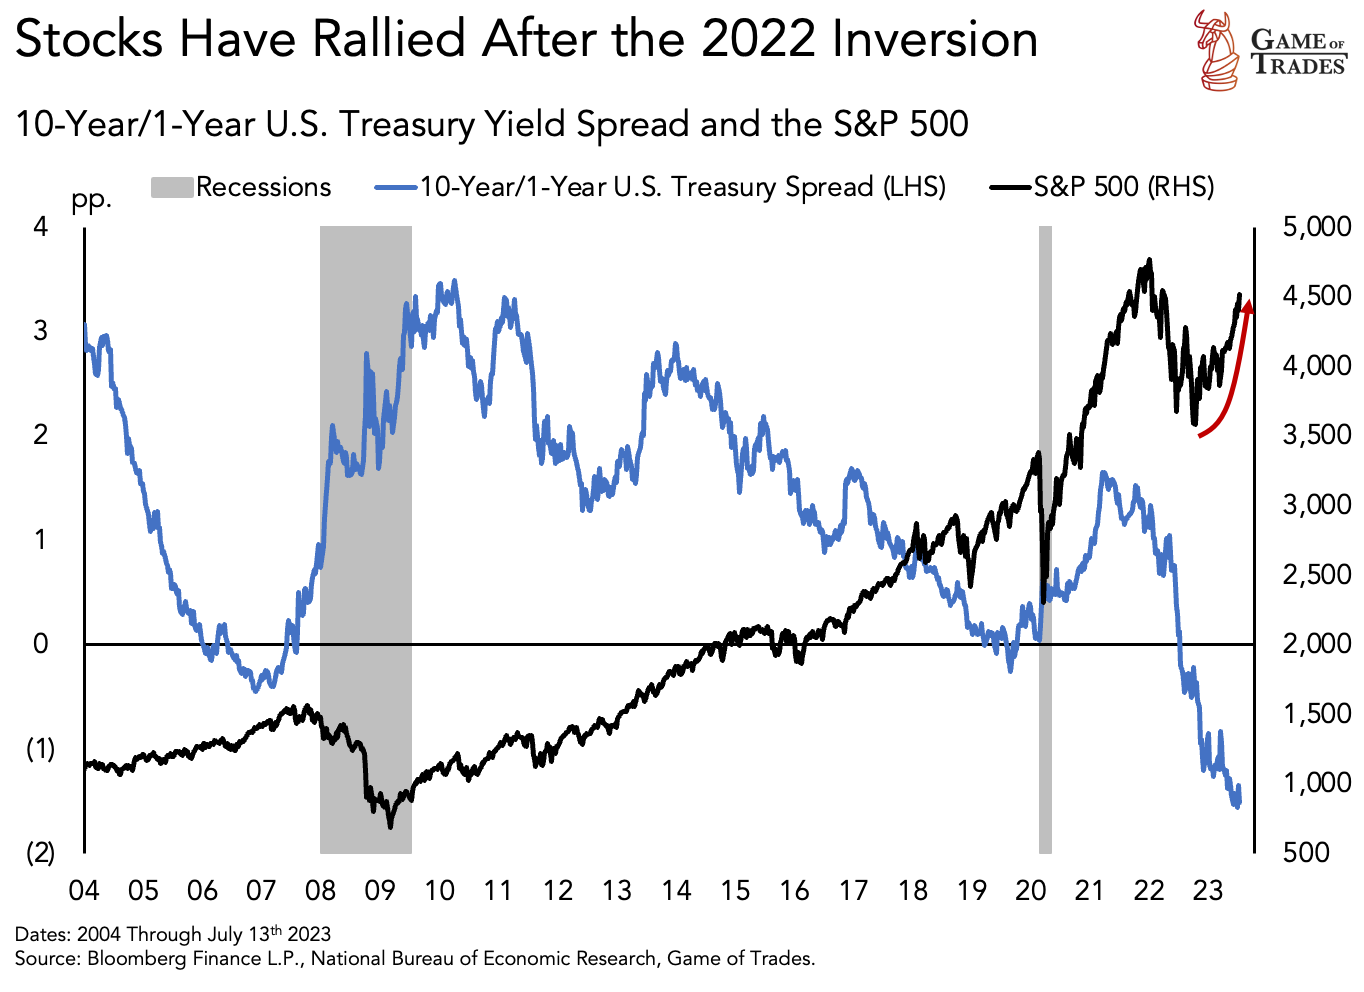
Contrary to the 1970s pattern, today’s scenario does not mirror the rapid onset of recessions following yield curve inversions. Despite the yield curve inversion in August 2022, markets have continued to trend upwards 11 months later, with the economy still not entering a recession.
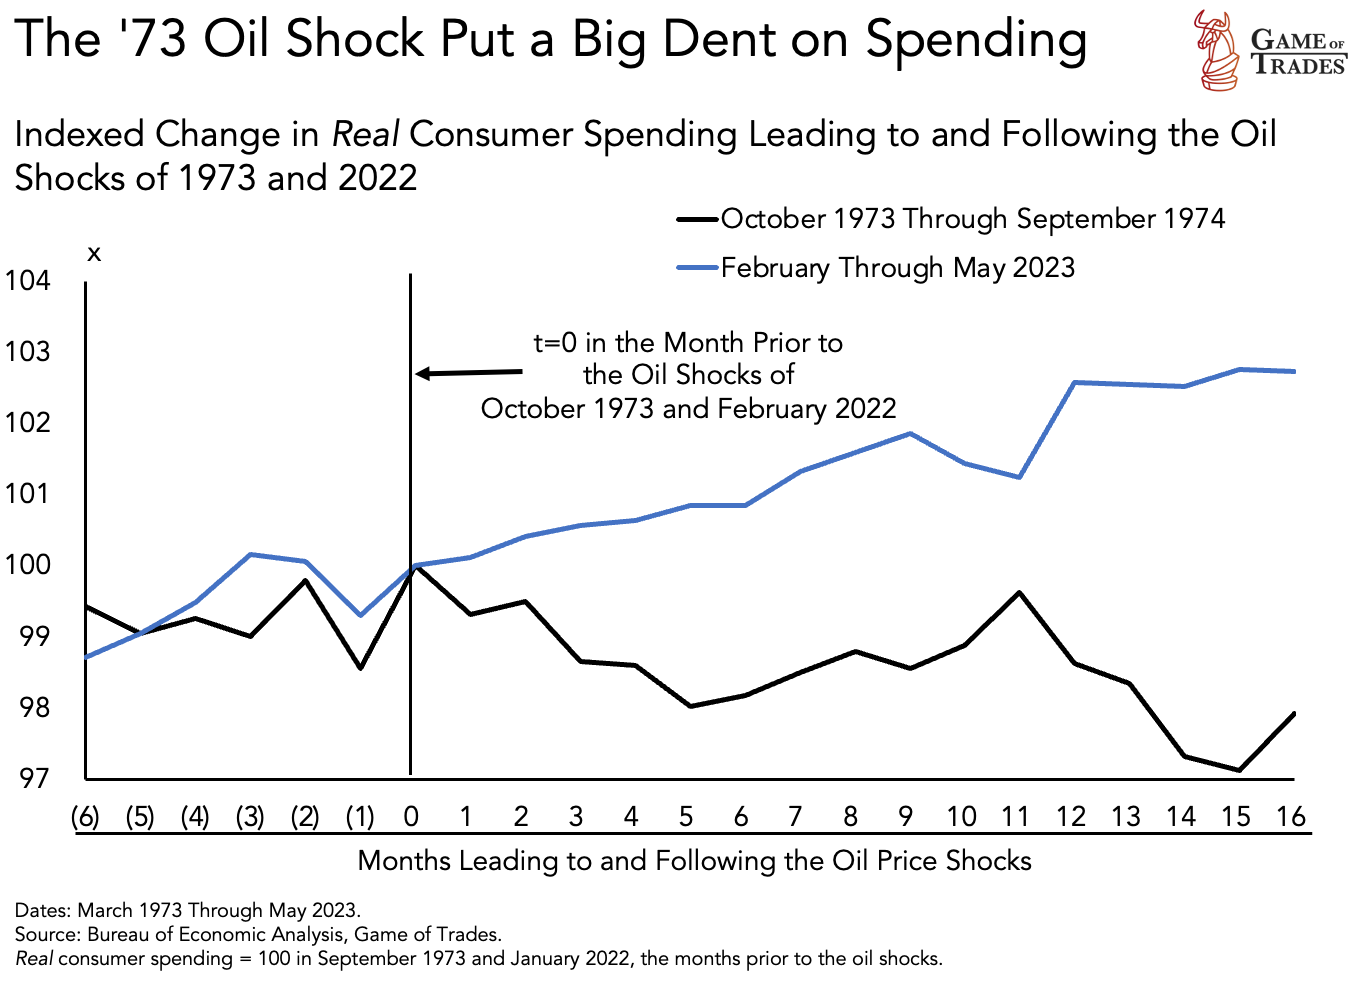
Explaining the Divergence: The Role of Oil Shocks
A potential explanation for the divergence between the 1970s and today could be the oil shocks of the 1970s. In 1973 and 1979, sudden rises in oil prices dampened consumer spending and triggered recessions. In contrast, consumer spending remained robust after the 2022 oil shock caused by the Ukraine war.
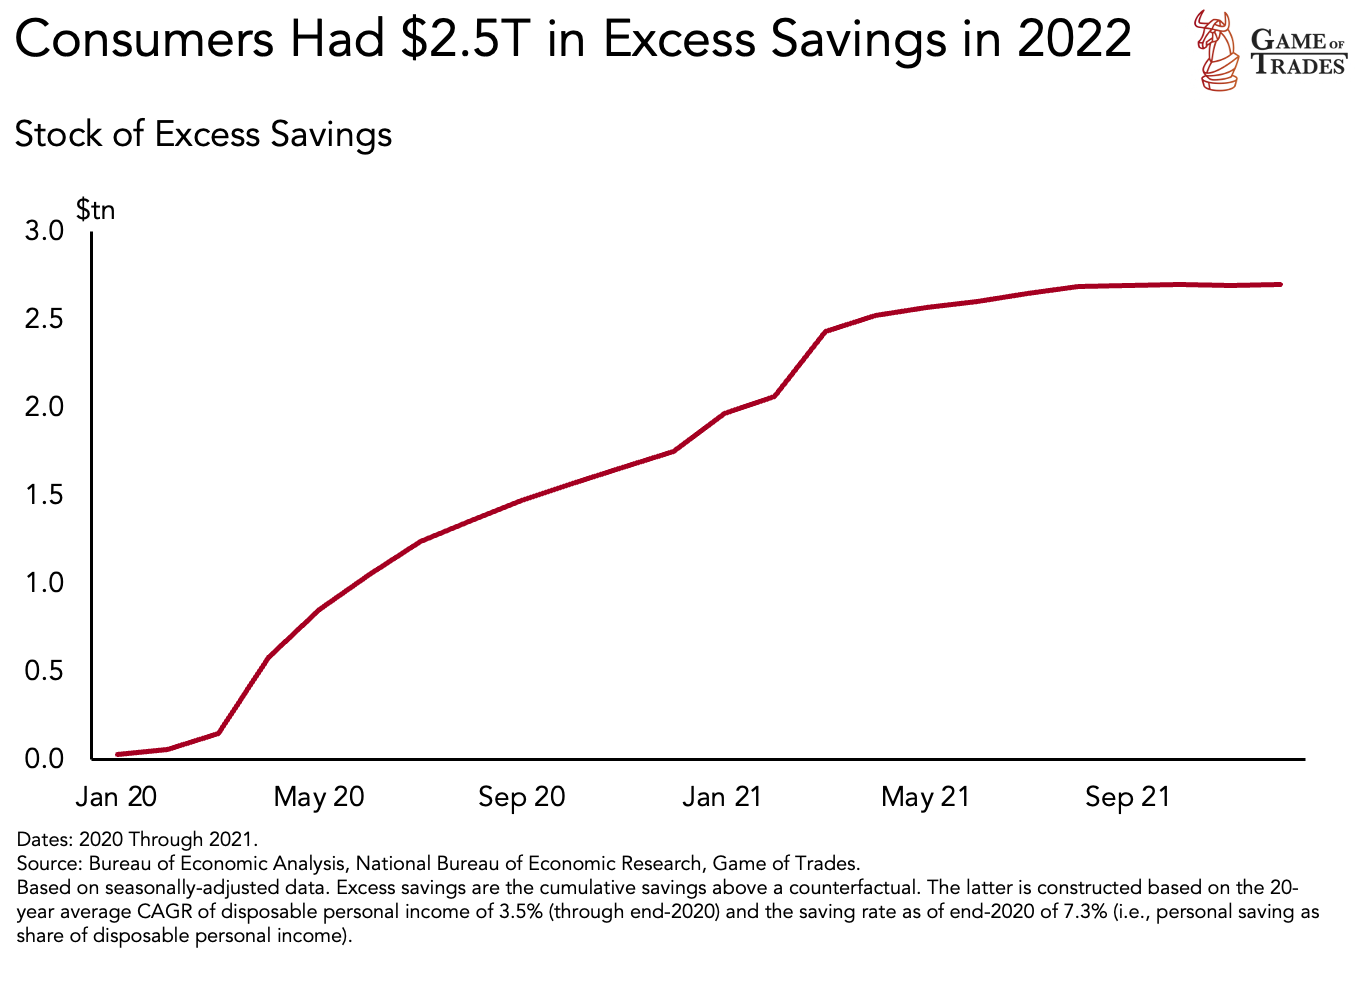
The Role of Excess Savings in Resilient Consumers
The resilience of consumers in 2022 can be attributed to the $2.5 trillion in excess savings accumulated during the pandemic. High savings helped consumers weather the tough macro environment caused by tight monetary policy. This accumulation of savings could explain why a recession has not yet occurred.
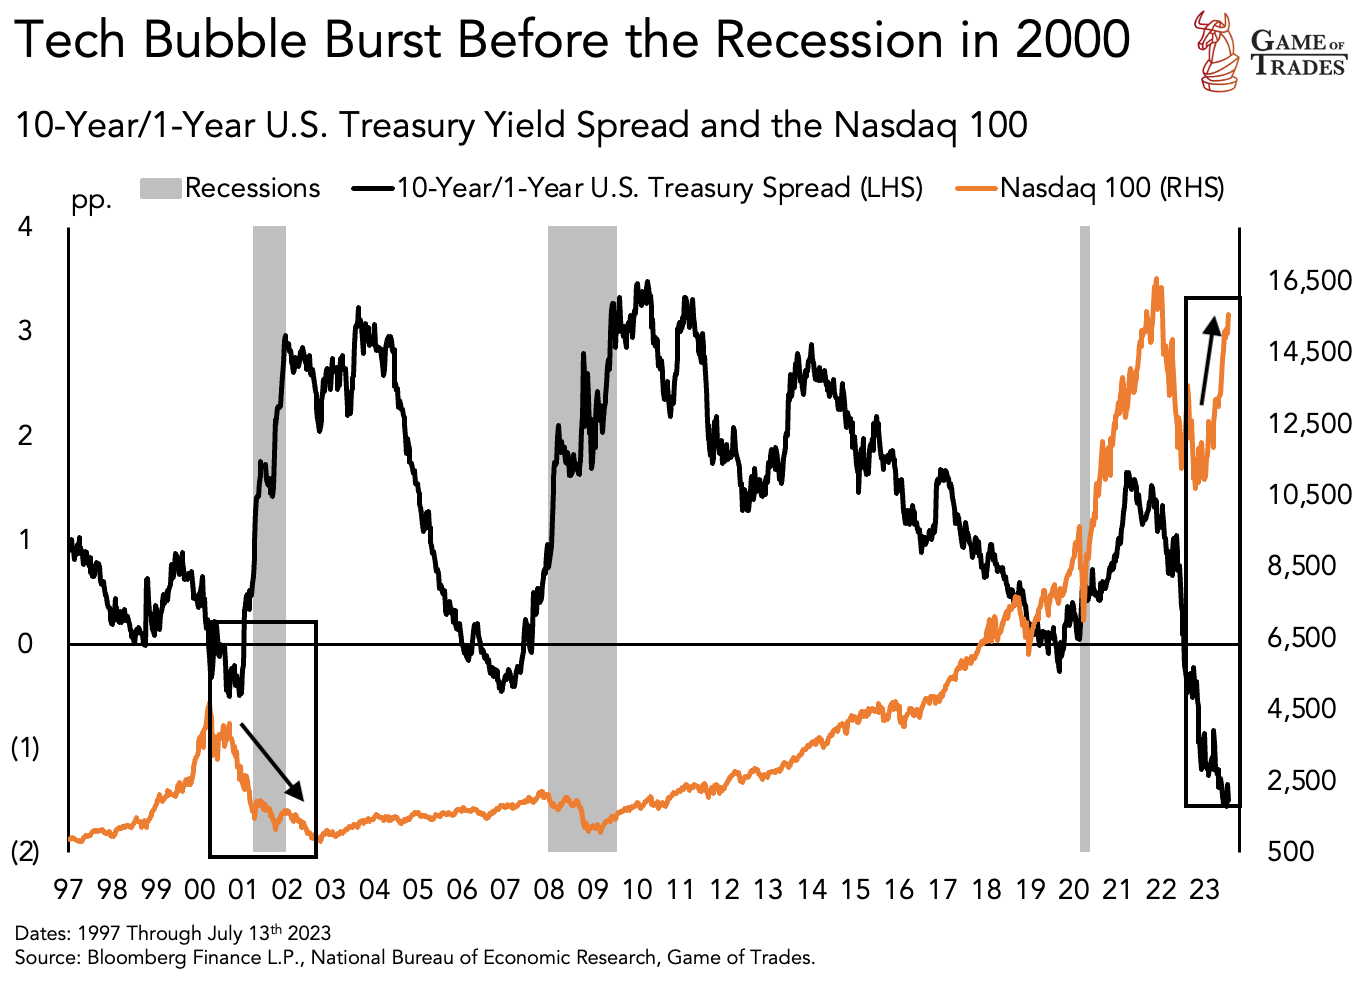
Comparing the 2000 and 2022/2023 Inversions
In 2000, the recession began eight months after the inversion, with the stock market declining immediately. The move down was further excarbated by the Tech bust. This dynamic is starkly different from today’s market, where tech stocks are thriving, fueled by the AI boom.
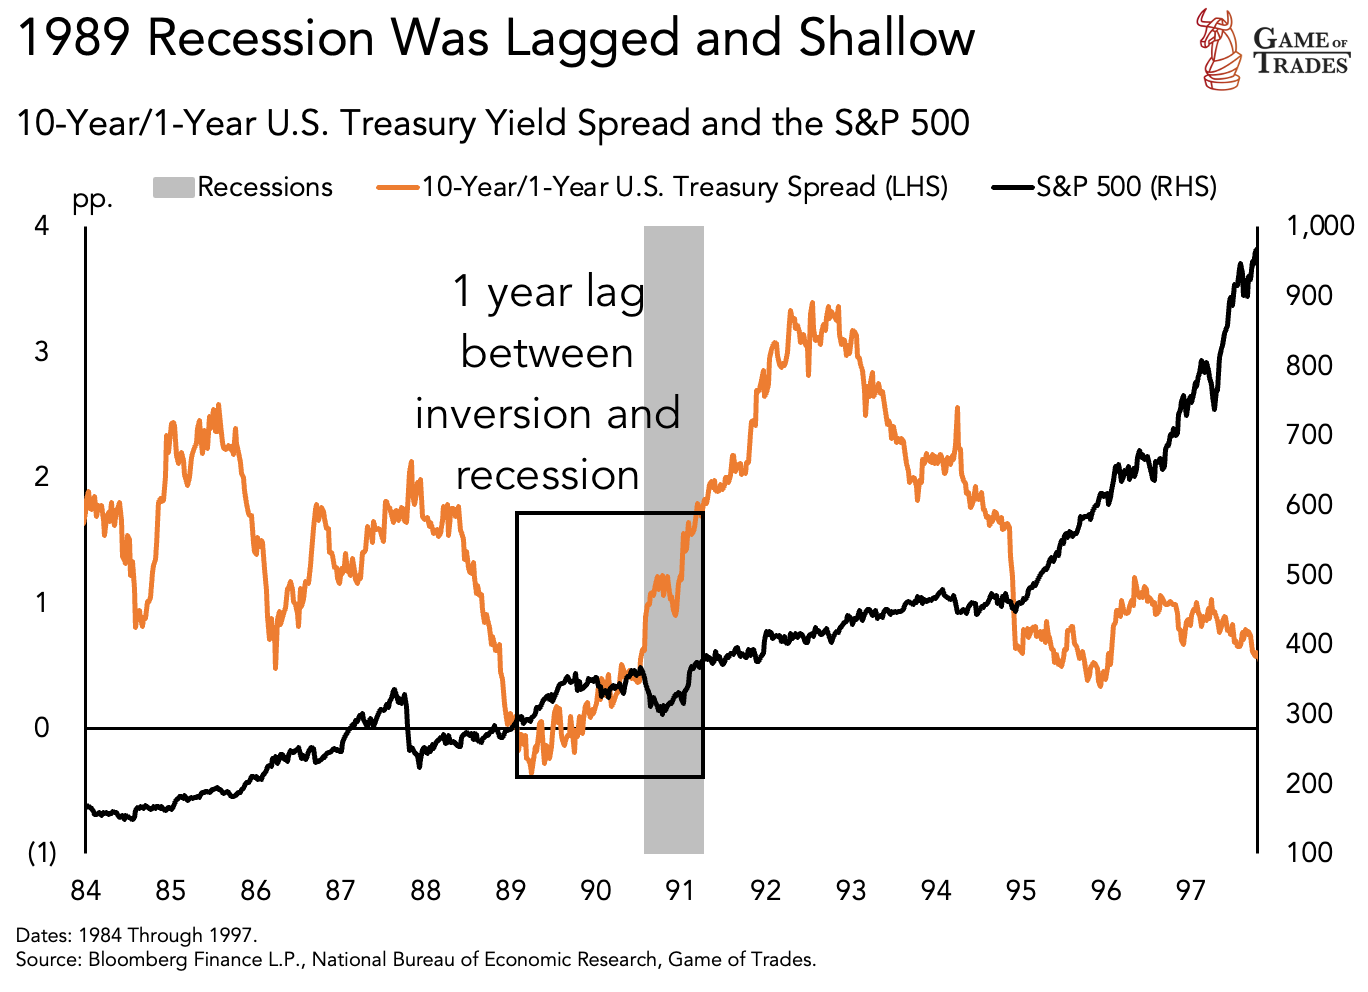
The 1989 Scenario and Predicting Recession Severity
In 1989, the economy took a year to enter a recession after the inversion. During this period, equities rallied until the recession’s onset. Today’s market mirrors the 1989 scenario, with markets rallying post-inversion. However, the depth of the 1989 inversion was brief and shallow, unlike today’s inversion.
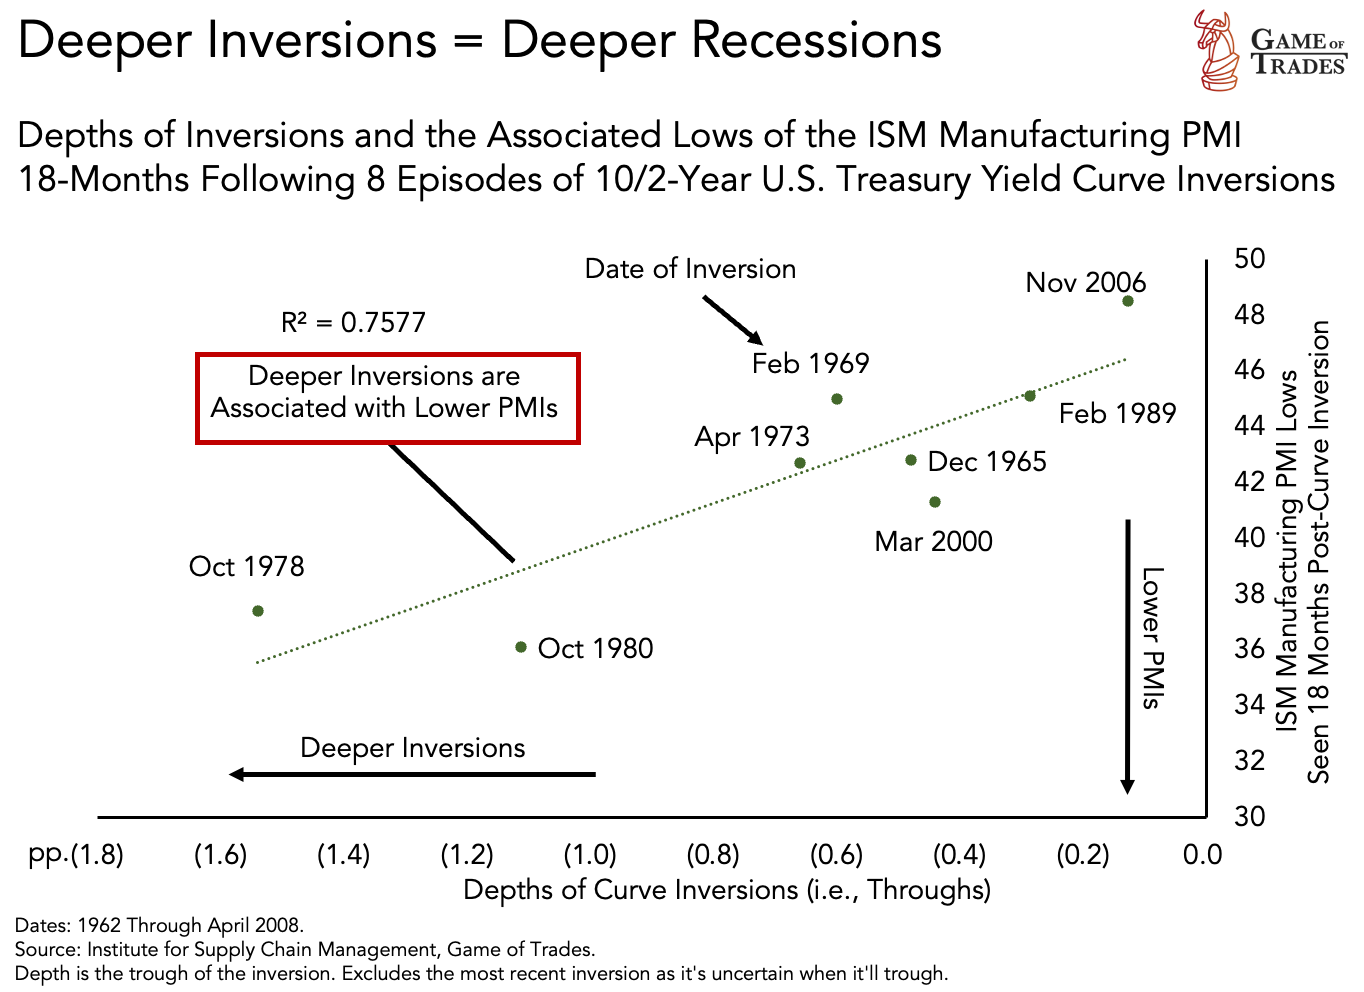
The depth of an inversion can help predict the severity of the ensuing recession. Deeper inversions typically result in lower manufacturing PMI (a measure of economic activity) in the subsequent 18 months.
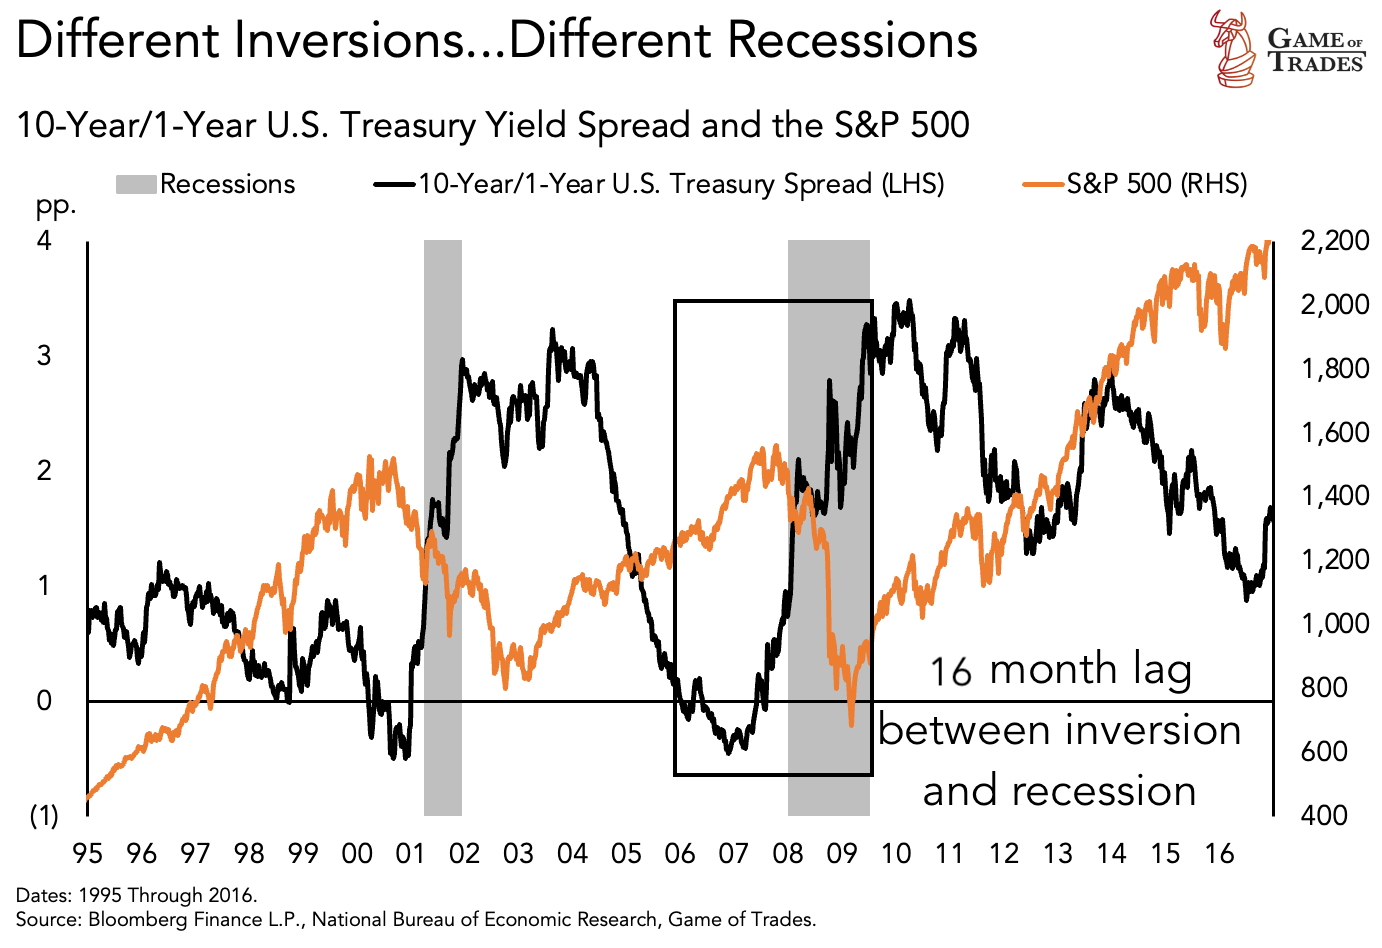
The 2006 Scenario and the Financial Crisis
In 2006, equities rallied for about 1.5 years post-inversion, and the economy remained strong with low unemployment rates, similar to today’s conditions. However, the rally was followed by a significant market downturn as the Financial Crisis unfolded.
The 2006 recession taught us that a strong economy before a downturn does not necessarily mean a less severe recession. If we follow the same path, stocks could continue to rise for another seven months before a recession hits.
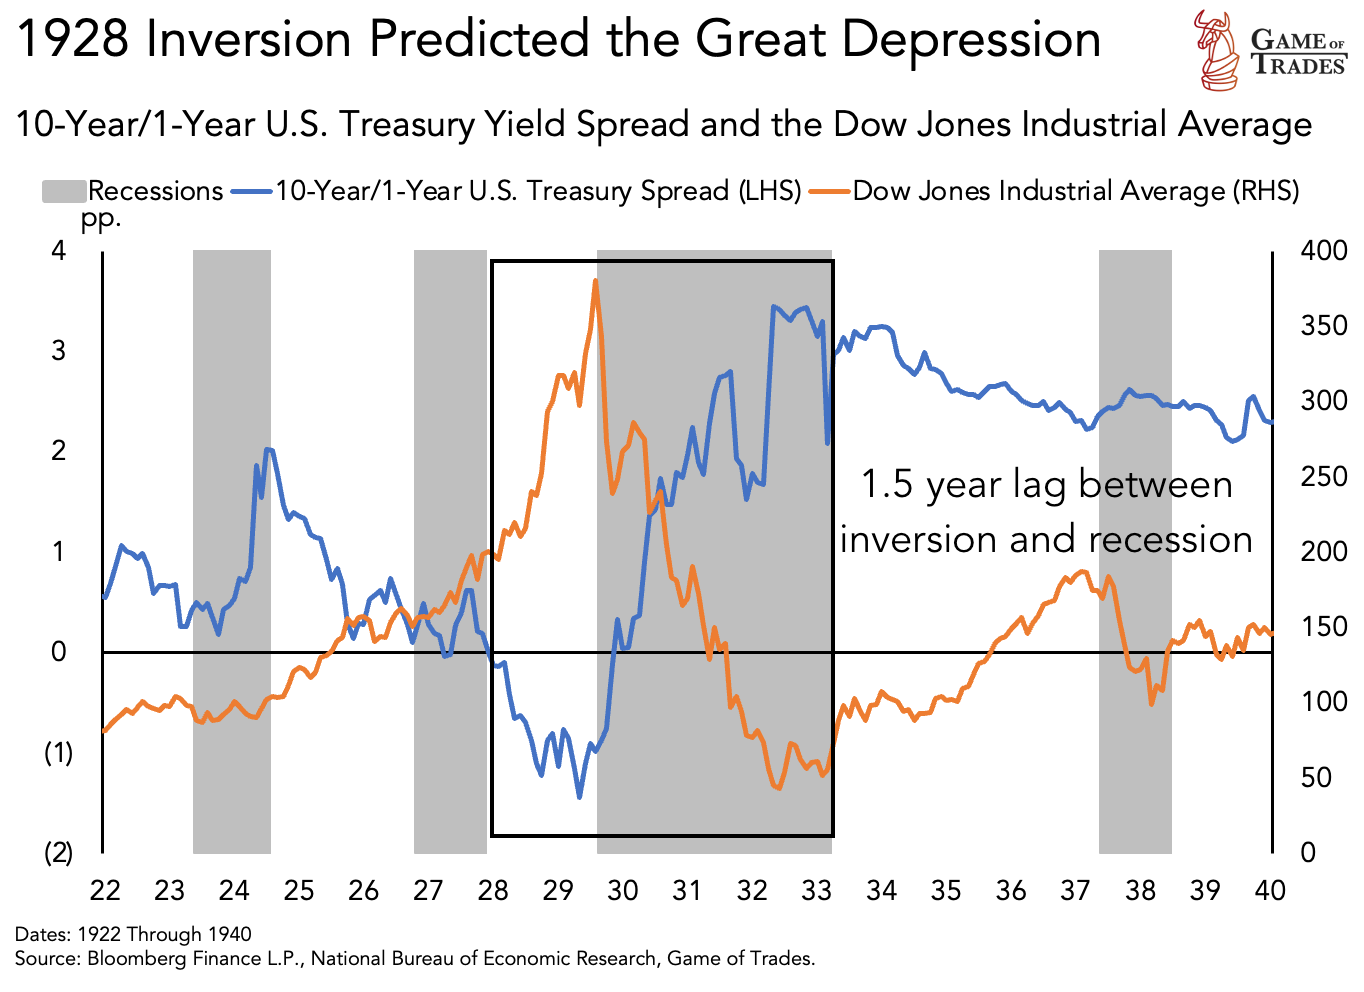
The 1928 Inversion and the Great Depression
The 1928 inversion followed a similar pattern, with markets rallying for 1.5 years post-inversion until the recession began. Despite low unemployment rates during the inversion, the recession saw unemployment skyrocket to 25% and equities decline by 80%.
The most analogous scenarios to the 2023 yield curve inversion are those of 1929 and 2006, considering equity price action, labor market resilience, and the extent of the yield curve inversion.
Understanding the historical patterns and market reactions to yield curve inversions can provide valuable insights for investors. It is important to remember that the market strength during an inversion is not a good predictor for the severity of the recession. The depth of an inversion, on the other hand, has a positive correlation with US manufacturing PMI. While the current market trends diverge from some historical patterns, it is essential to consider other factors such as oil shocks, consumer resilience, and the depth of the inversion. Today’s inversion closely resembles that seen in 1928 and 2006. Click here to get free trial for 7 days! Subscribe to our YouTube channel and Follow us on Twitter for more updates!
Read more: Insider Selling Hits Highest Level Since 2023


