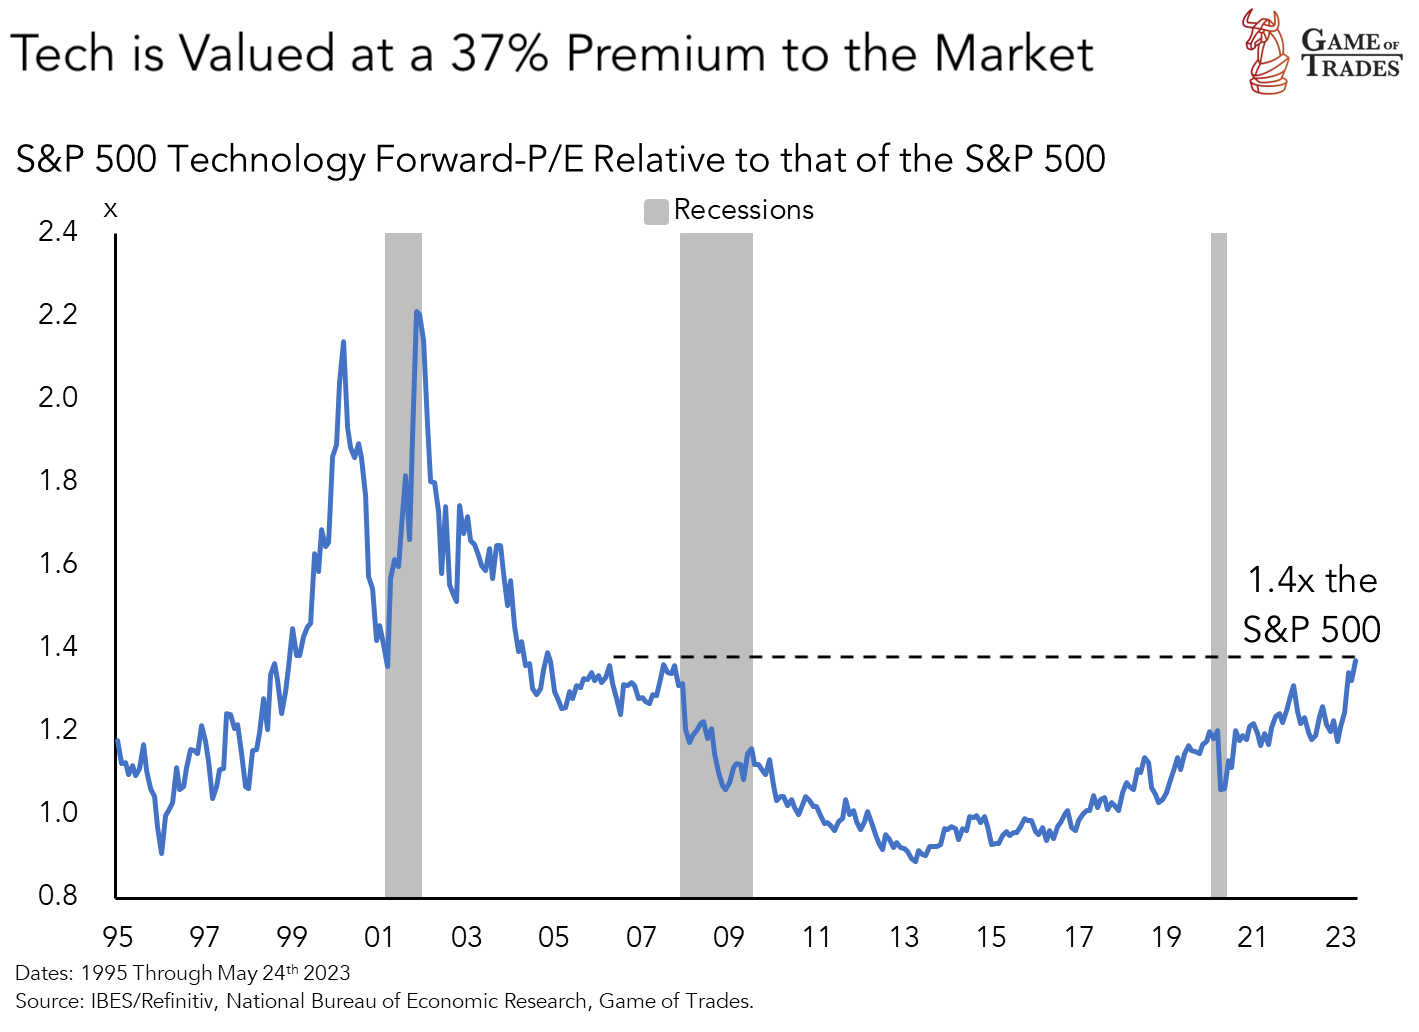
The technology sector is currently the most expensive it has been since the Financial Crisis, trading at 1.4 times the S&P 500. This is a significant level, as the only time the tech sector was more expensive was during the infamous Dot Com bubble. This comparison naturally raises concerns about the sustainability of the current tech rally and the potential for a similar crash.
The Dot Com Bubble: A Lesson in Extreme Valuations
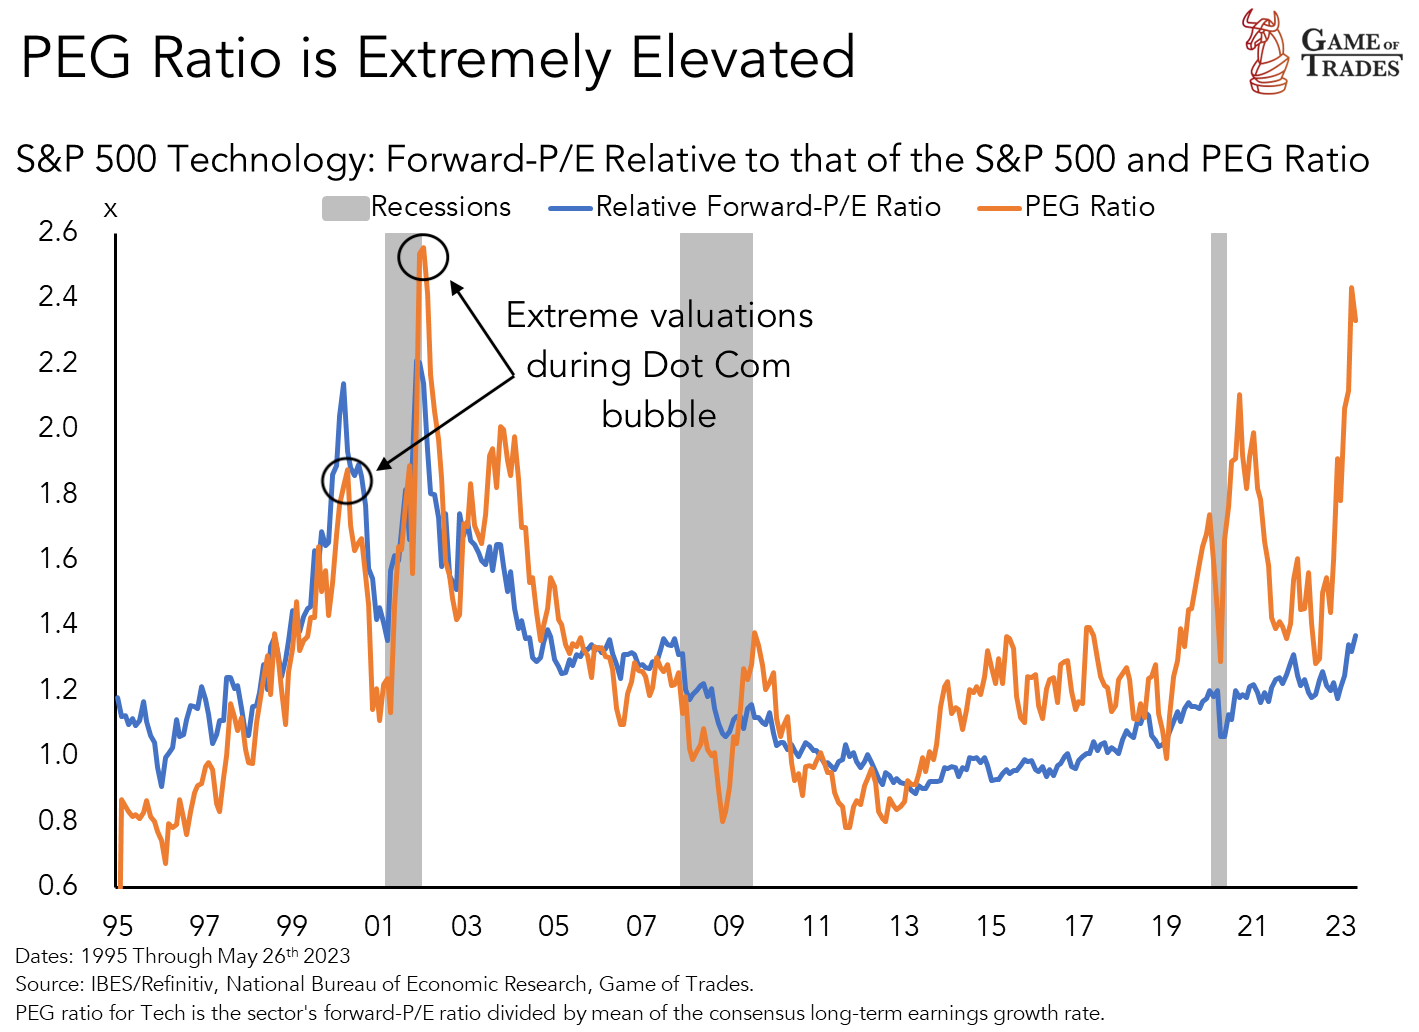
The Dot Com bubble crash was largely driven by extreme valuations, a fact that becomes evident when we examine the Price/Earnings to Growth (PEG) ratio during that period. The PEG ratio is a key indicator that shows what investors are willing to pay for a company’s earnings growth. It’s calculated by dividing the Price/Earnings (P/E) ratio by the expected Earnings Per Share (EPS) growth rate for a specified period.
The 2000 Top Timeline: A Closer Look
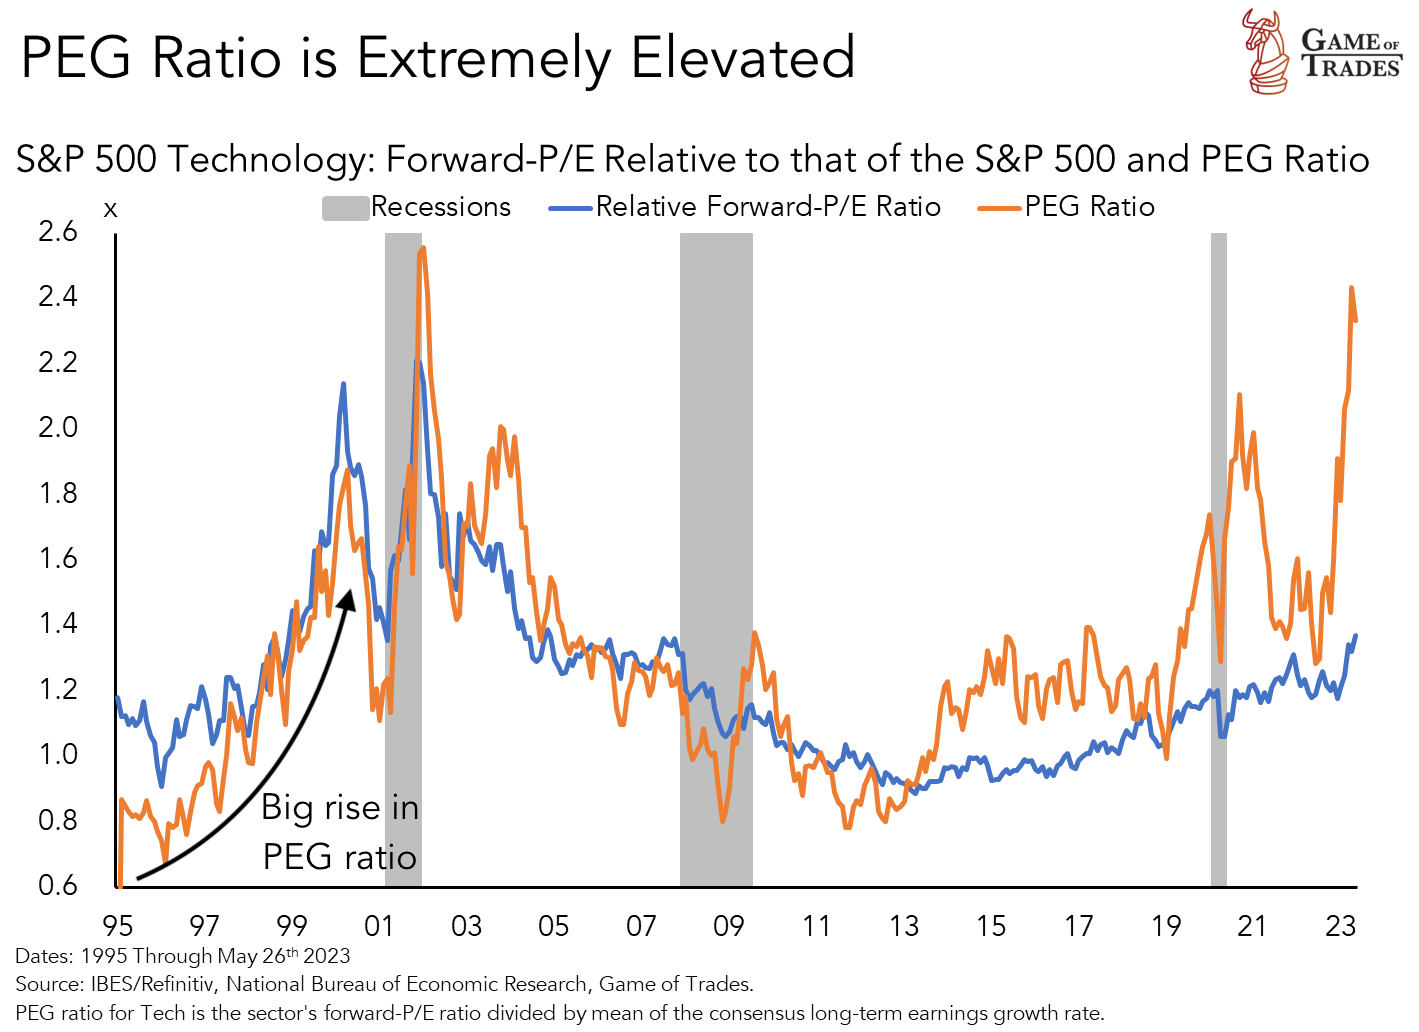
To understand the dynamics that led to the Dot Com bubble burst, let’s take a closer look at the timeline from 1995 to 2000. Between 1995 and 1997, tech companies experienced rapid earnings growth. From 1997 to 1999, investor euphoria grew, and they were willing to pay more for the same growth, leading to a higher PEG ratio. By 2000, the valuations had become unsustainable, with an extremely high PEG ratio, resulting in the Tech bubble burst.
Today’s PEG Ratio: Echoes of the Past?
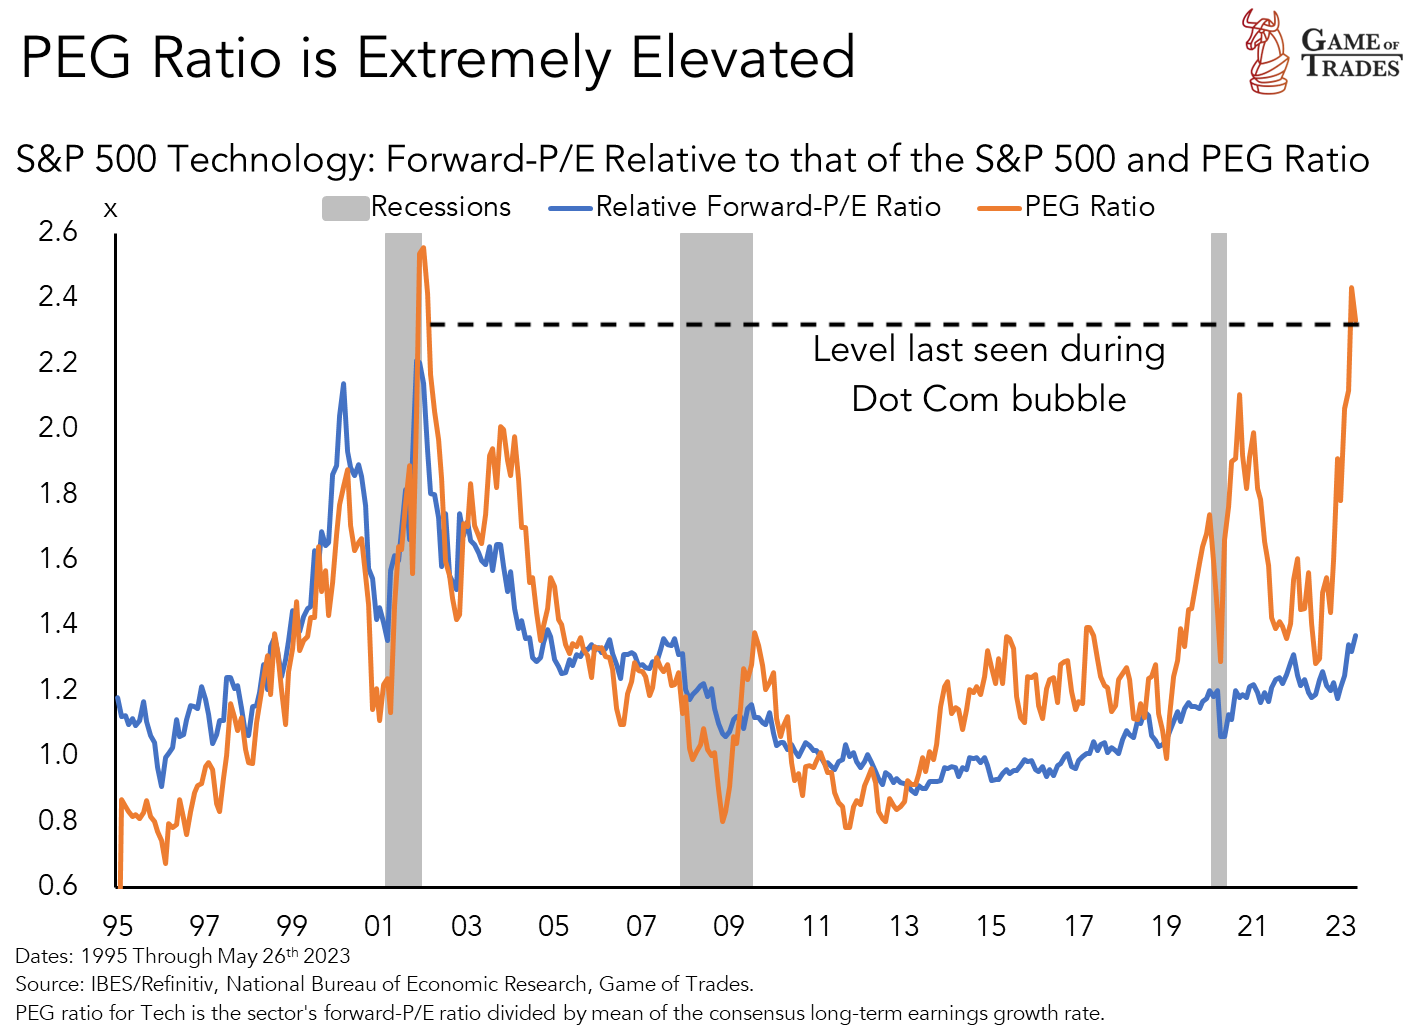
Fast forward to today, and the PEG ratio for the tech sector resembles levels seen during the Dot Com crash. This similarity suggests a limited runway for the current rally, indicating that we may be nearing a peak.
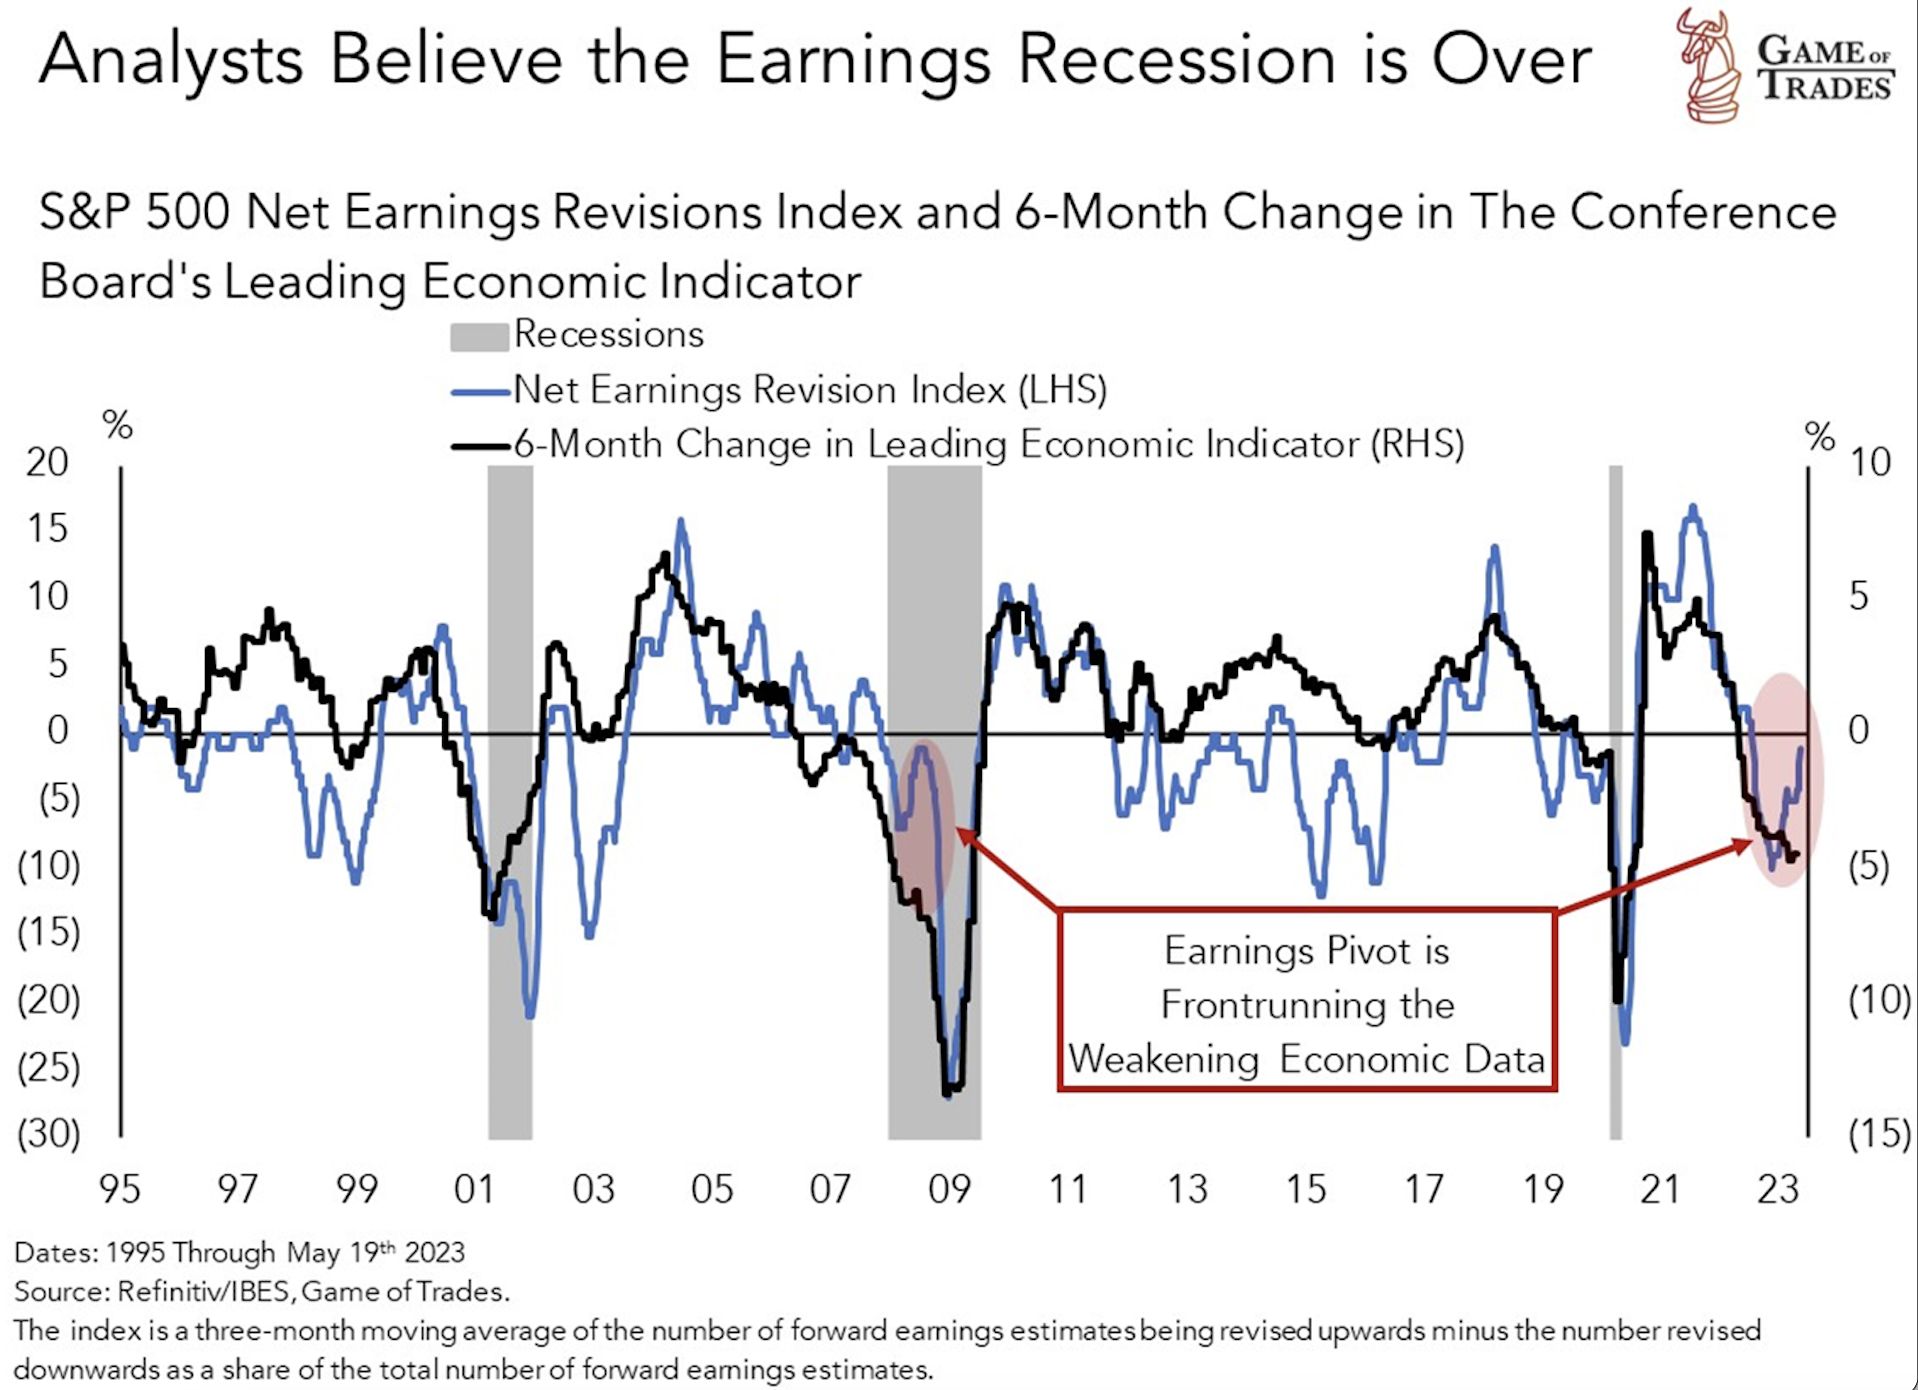
Analysts May Be Overly Optimistic on Earnings
Analysts are raising earnings estimates, expecting economic recovery. But they may be repeating the mistake they made during the 2008 Financial Crisis of revising earnings upwards, despite declining leading economic indicators. This proved costly last time as markets declined significantly.
In conclusion, technology sector valuations are extremely elevated, comparable to levels seen during the Dot Com bubble. The PEG ratio indicates a limited runway for the current rally. However, analysts are adjusting their earnings estimates upwards at a time when leading economic indicators are sharply contracting, a setup seen even during the 2008 Financial Crisis. Click here to get free trial for 7 days! Subscribe to our YouTube channel and Follow us on Twitter for more updates!
Read more: Market Breadth Indicators: A Powerful Tool for Investors


