Market breadth indicators provide valuable insights into the participation rate of stocks during market moves, indicating the conviction behind these moves. Understanding market breadth can help investors make informed decisions and put the odds in their favor.
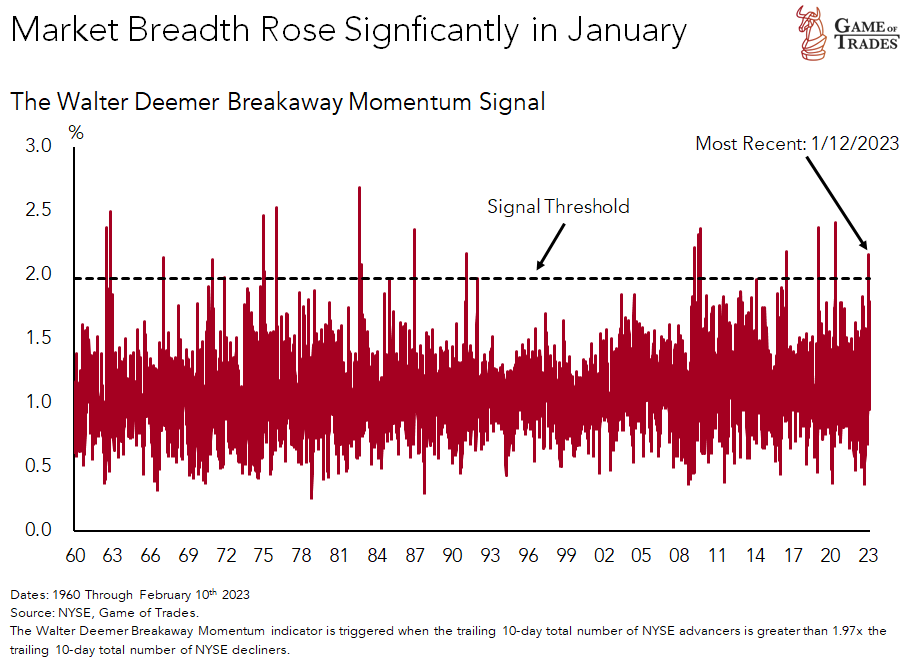
The Walter Deemer Breakaway Momentum Indicator
The Walter Deemer Breakaway Momentum (BAM) indicator is an excellent tool for capturing macro dynamics and identifying significant changes in the market regime. This indicator has a track record of success in predicting market shifts. The most recent signal was triggered in January 2023
The BAM indicator calculates the ratio of advancing stocks on the NYSE to declining stocks over the past 10 days. A bullish signal is triggered when this ratio rises to 2x.
Historical Success of the BAM Indicator
Historically, the BAM indicator has been successful in predicting robust equity market returns over various timeframes following its trigger. Based on past data, the indicator has shown the following returns:
- 6 months: 11.1%
- 12 months: 19.2%
- 18 months: 23.7%
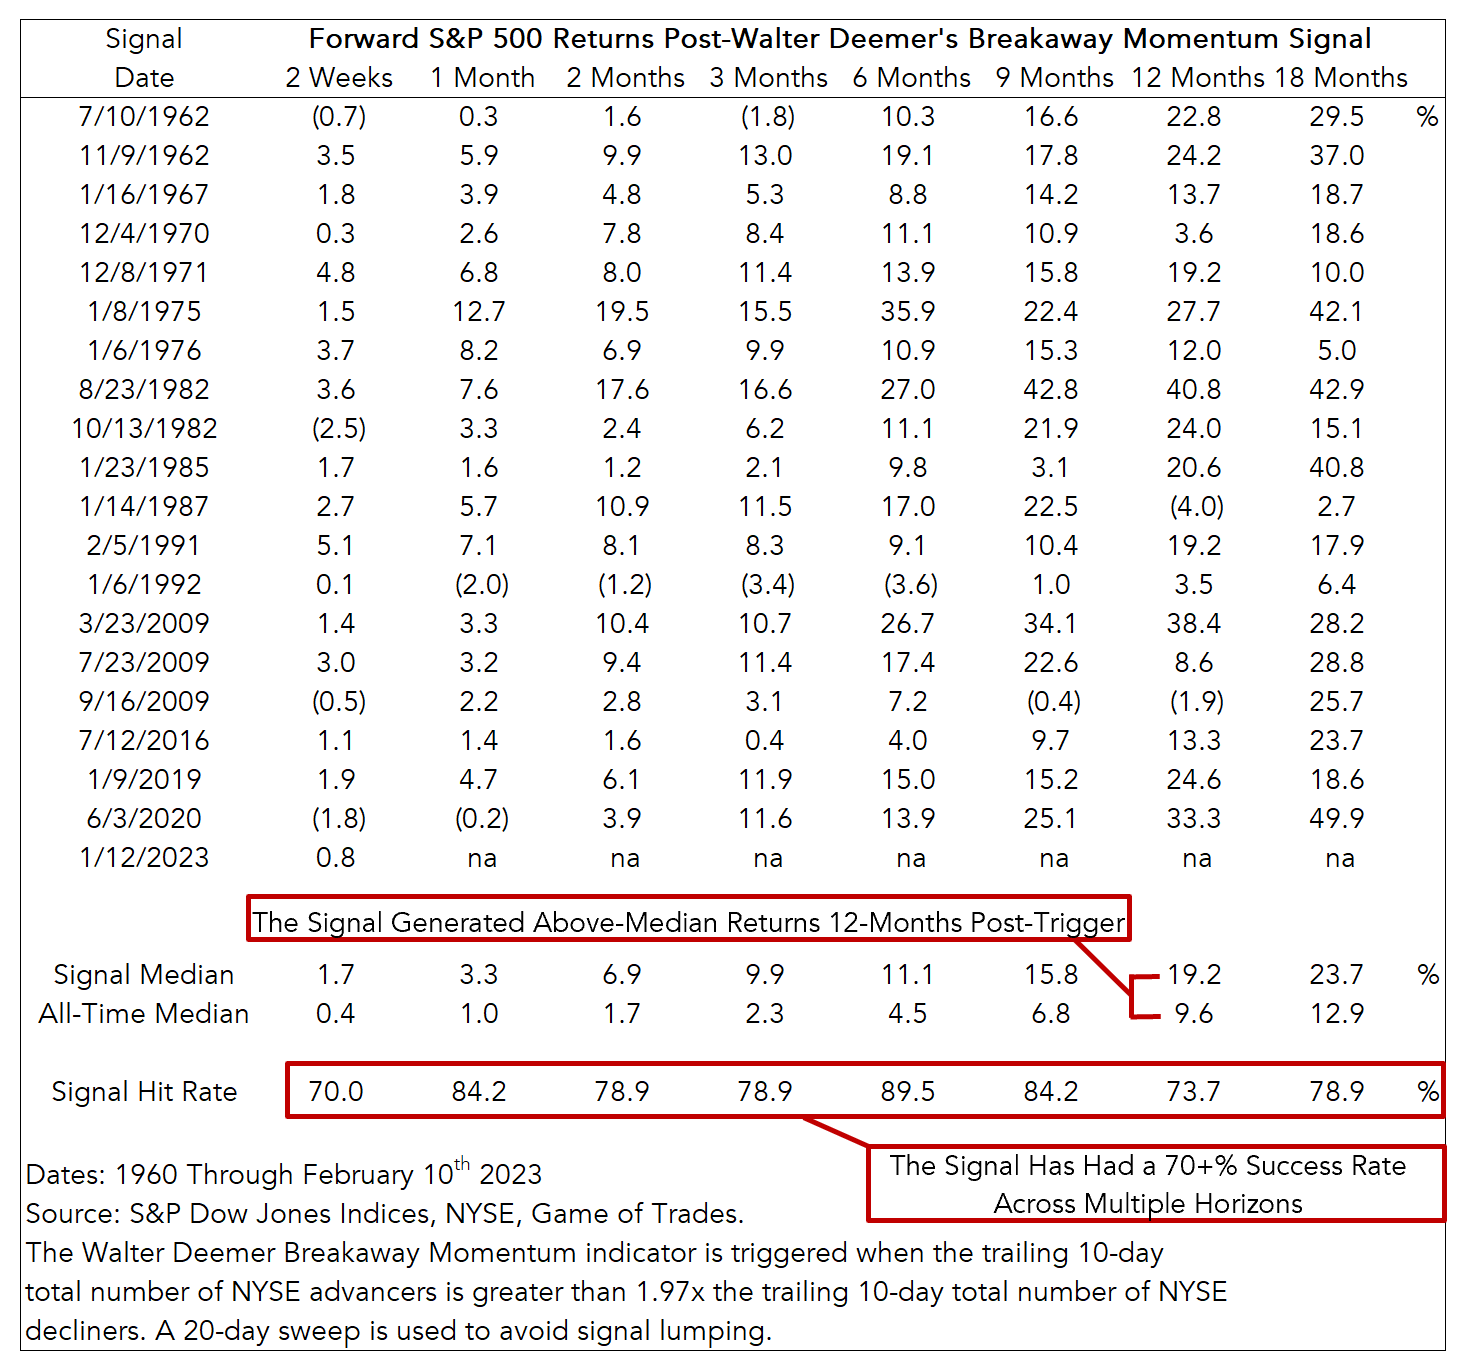
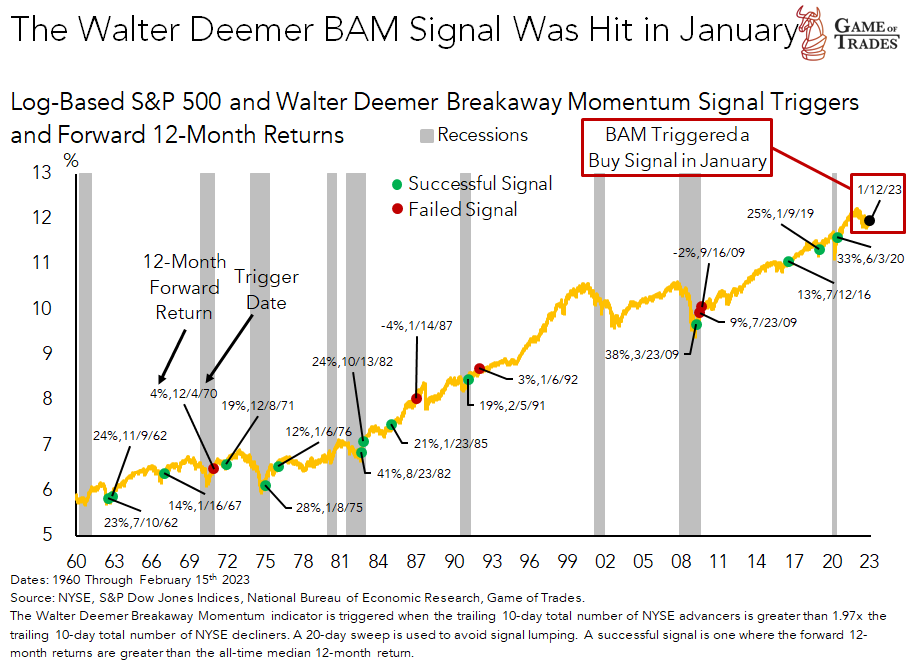
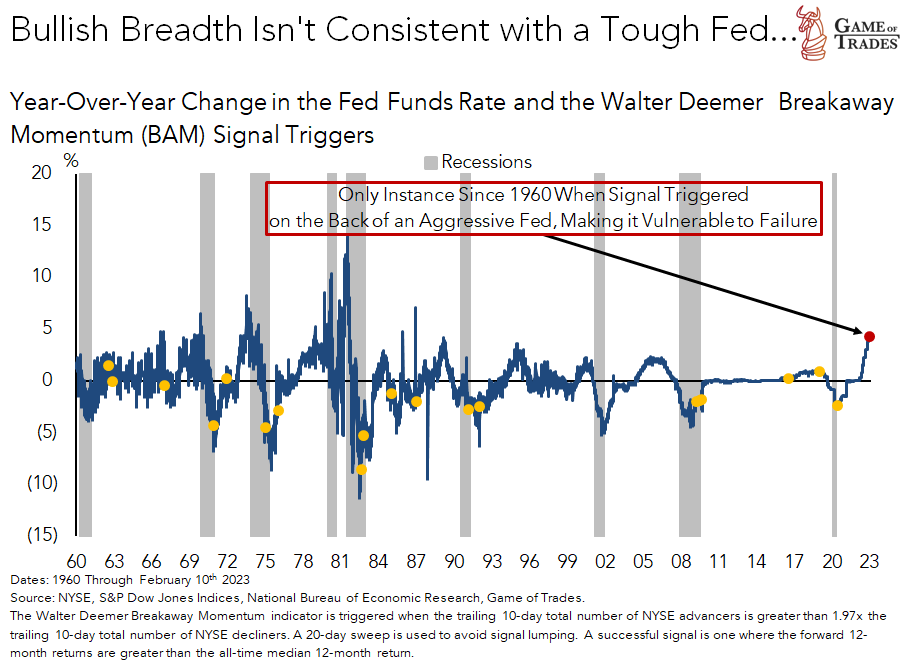
Analyzing BAM Signals Since 1960
A chart illustrating all the BAM signals triggered since 1960 reveals interesting patterns. Green dots represent instances when markets yielded better than average returns, while red dots represent below-average returns. This visual representation helps investors understand the historical performance of the BAM indicator.
Recent Performance and Market Insights
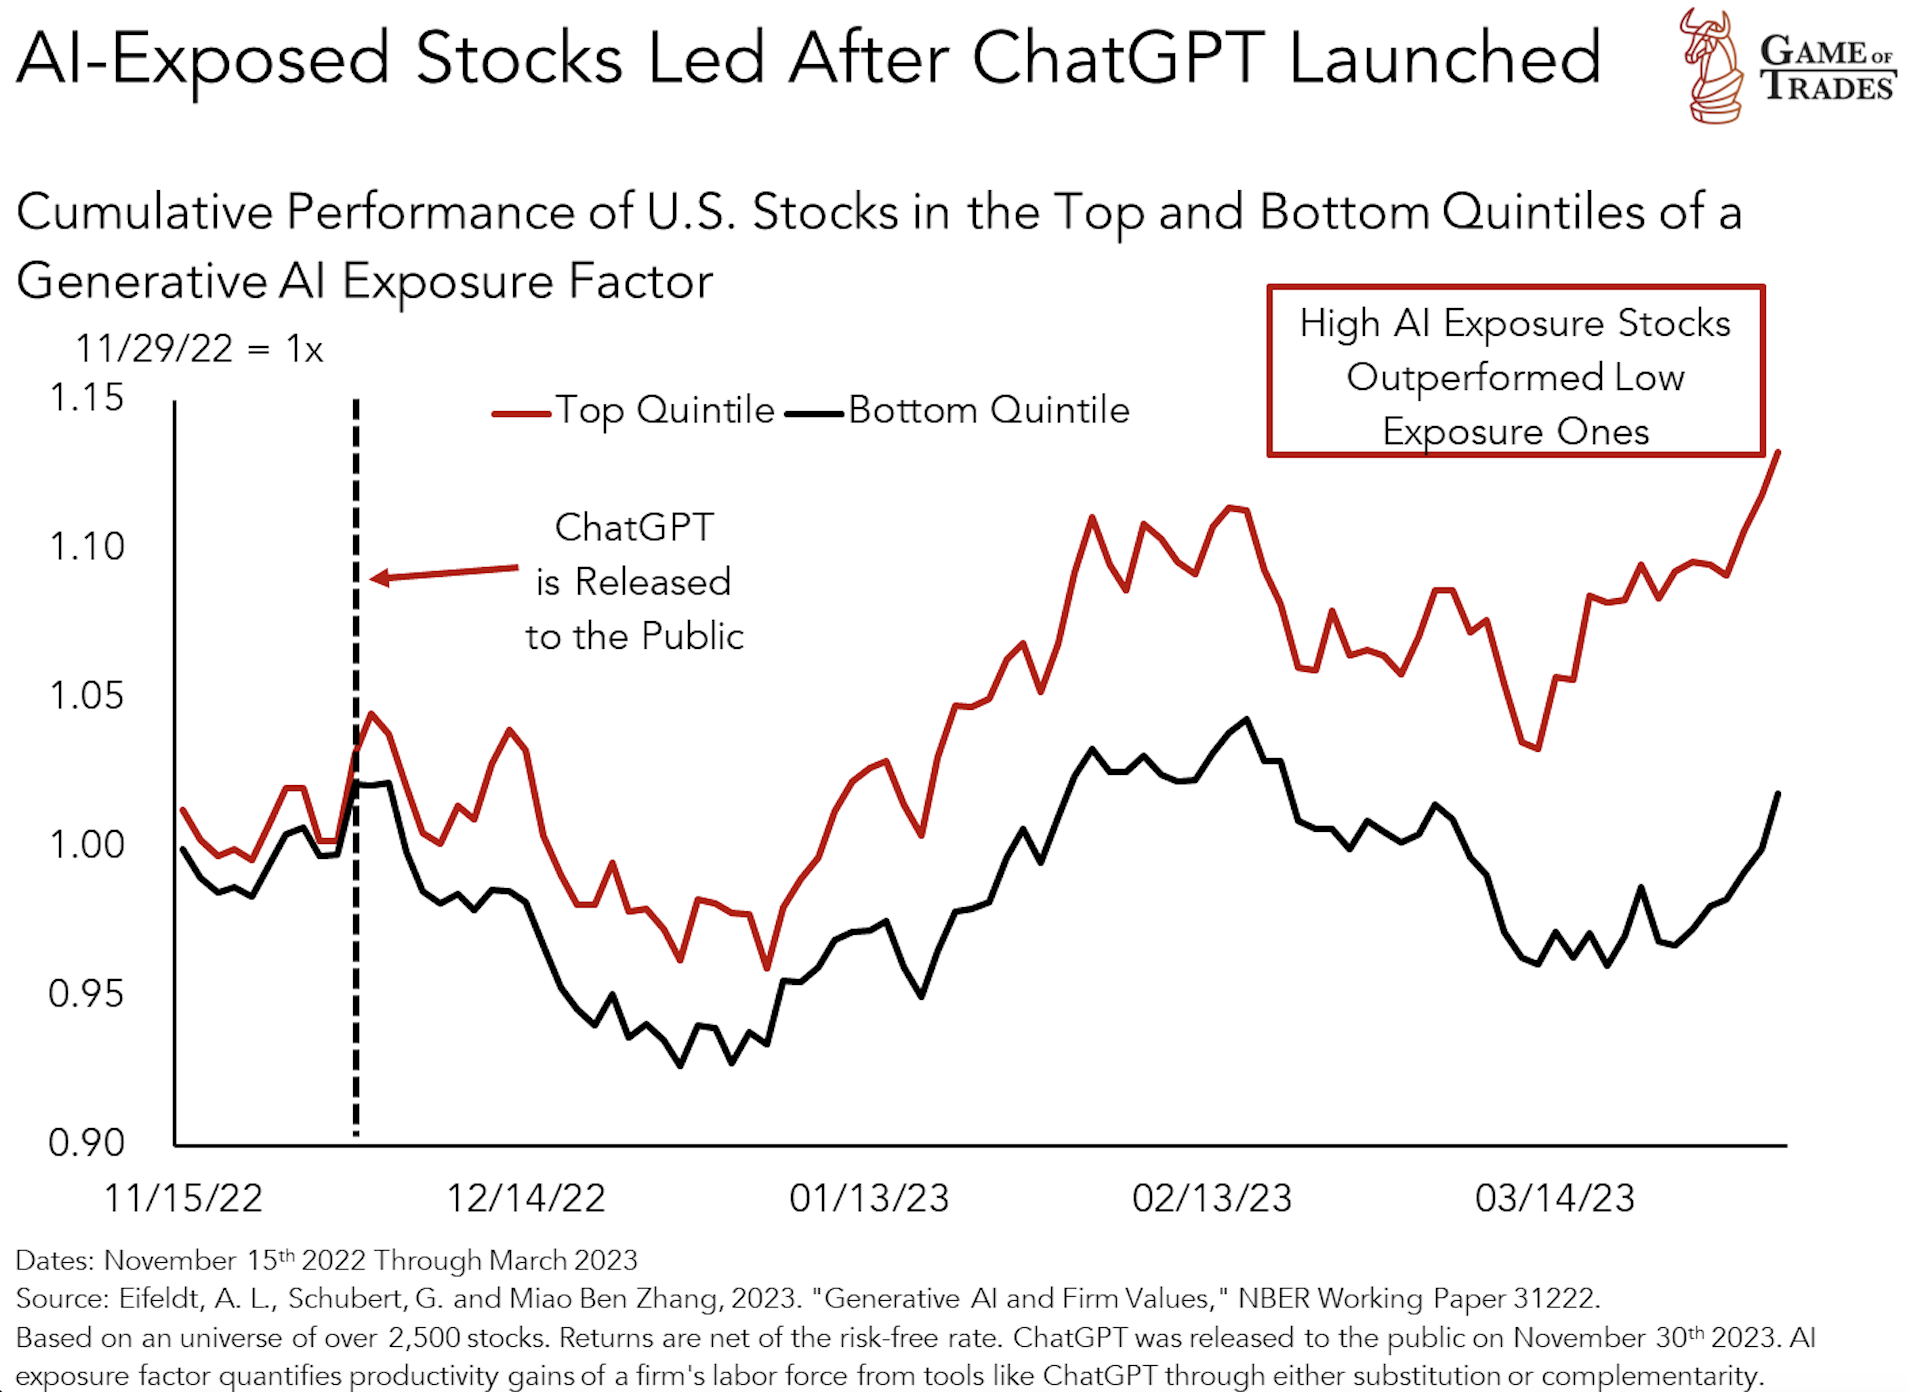
The S&P 500 has closely followed the BAM indicator’s 6-month prediction, delivering an 11% return since the signal was triggered in January 2023. However, the S&P 500 equal weight ETF has remained flat during the same period, suggesting that the recent rally has been driven by only a few stocks.
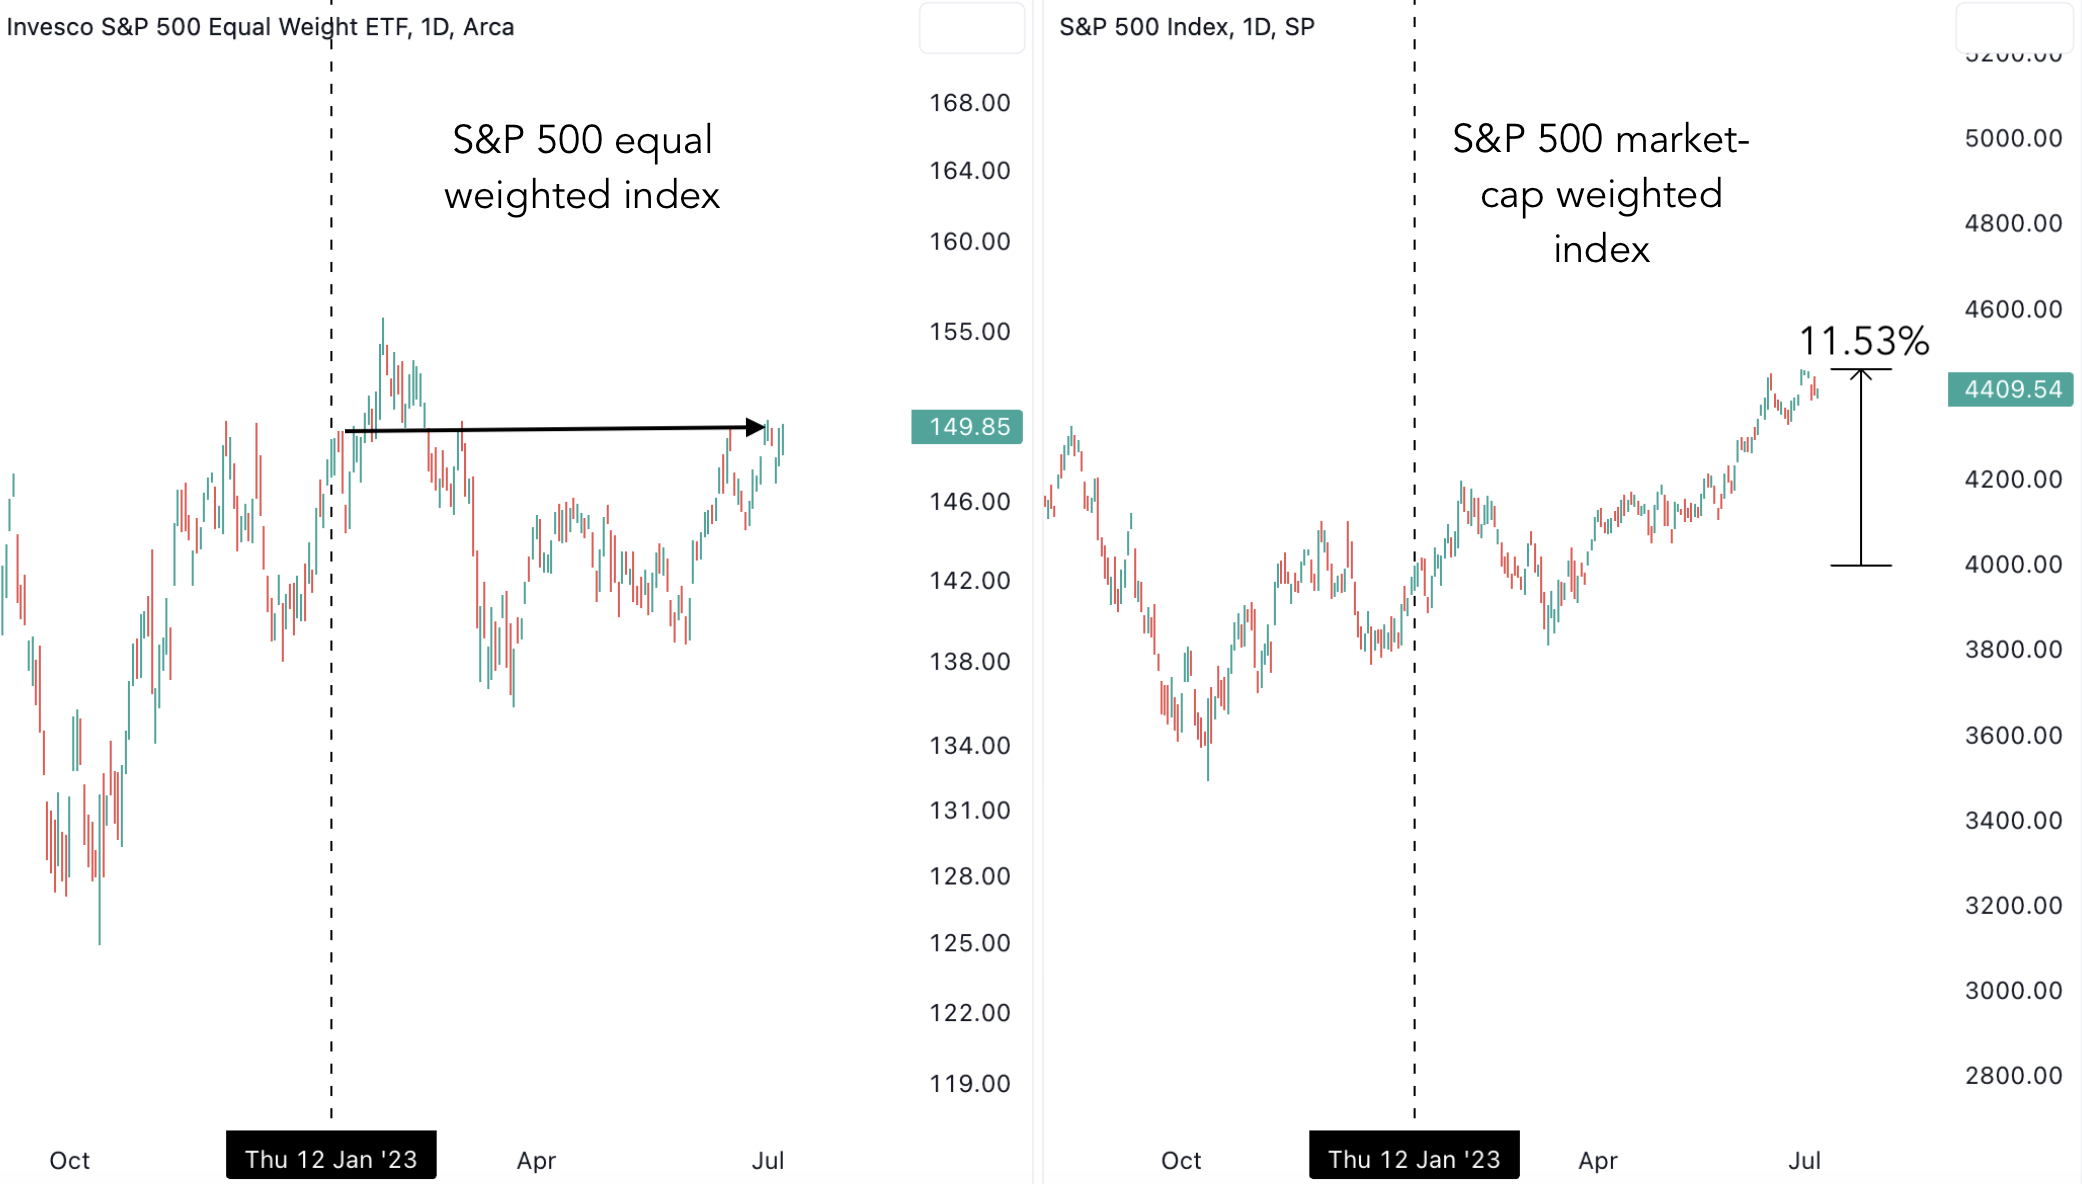
Interestingly, stocks without exposure to artificial intelligence (AI) have remained almost flat year-to-date. This observation raises questions about the potential for strong returns over the next 6 months, as suggested by the BAM indicator.
Macro Environment and BAM Signals
BAM signals have typically occurred in a macro environment where the Federal Reserve (Fed) has been easing monetary policy. Lowering the Fed funds rate stimulates the economy, leading to an economic boom and triggering a bull run in stocks. Conversely, when the Fed raises rates, the economy tends to deteriorate.
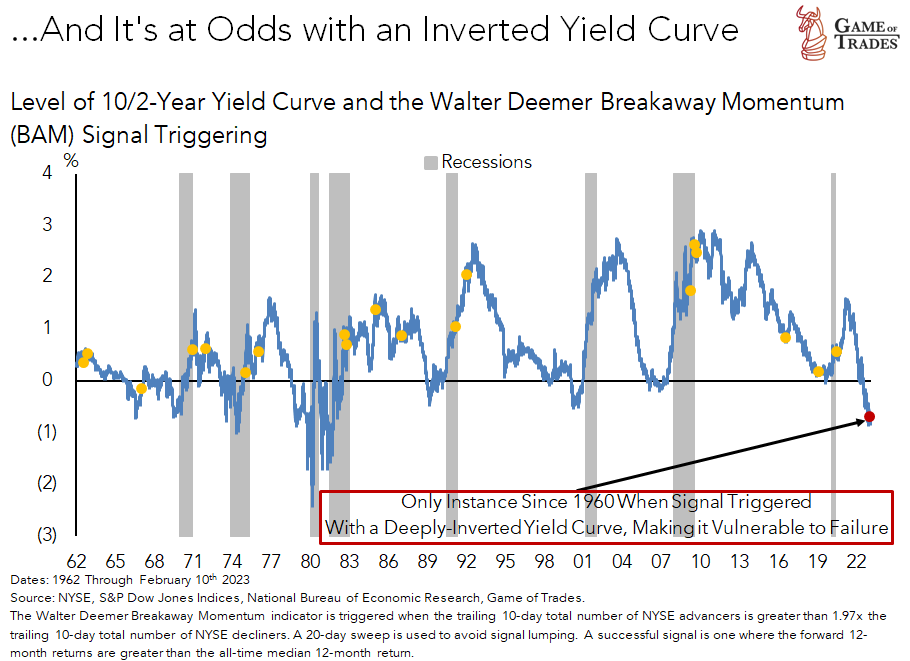
In almost all instances, the BAM signal coincided with a steep yield curve, indicating that short-term interest rates were lower than long-term rates. This relationship has been a consistent factor in BAM signals.
The Unique Circumstances of the Current Market
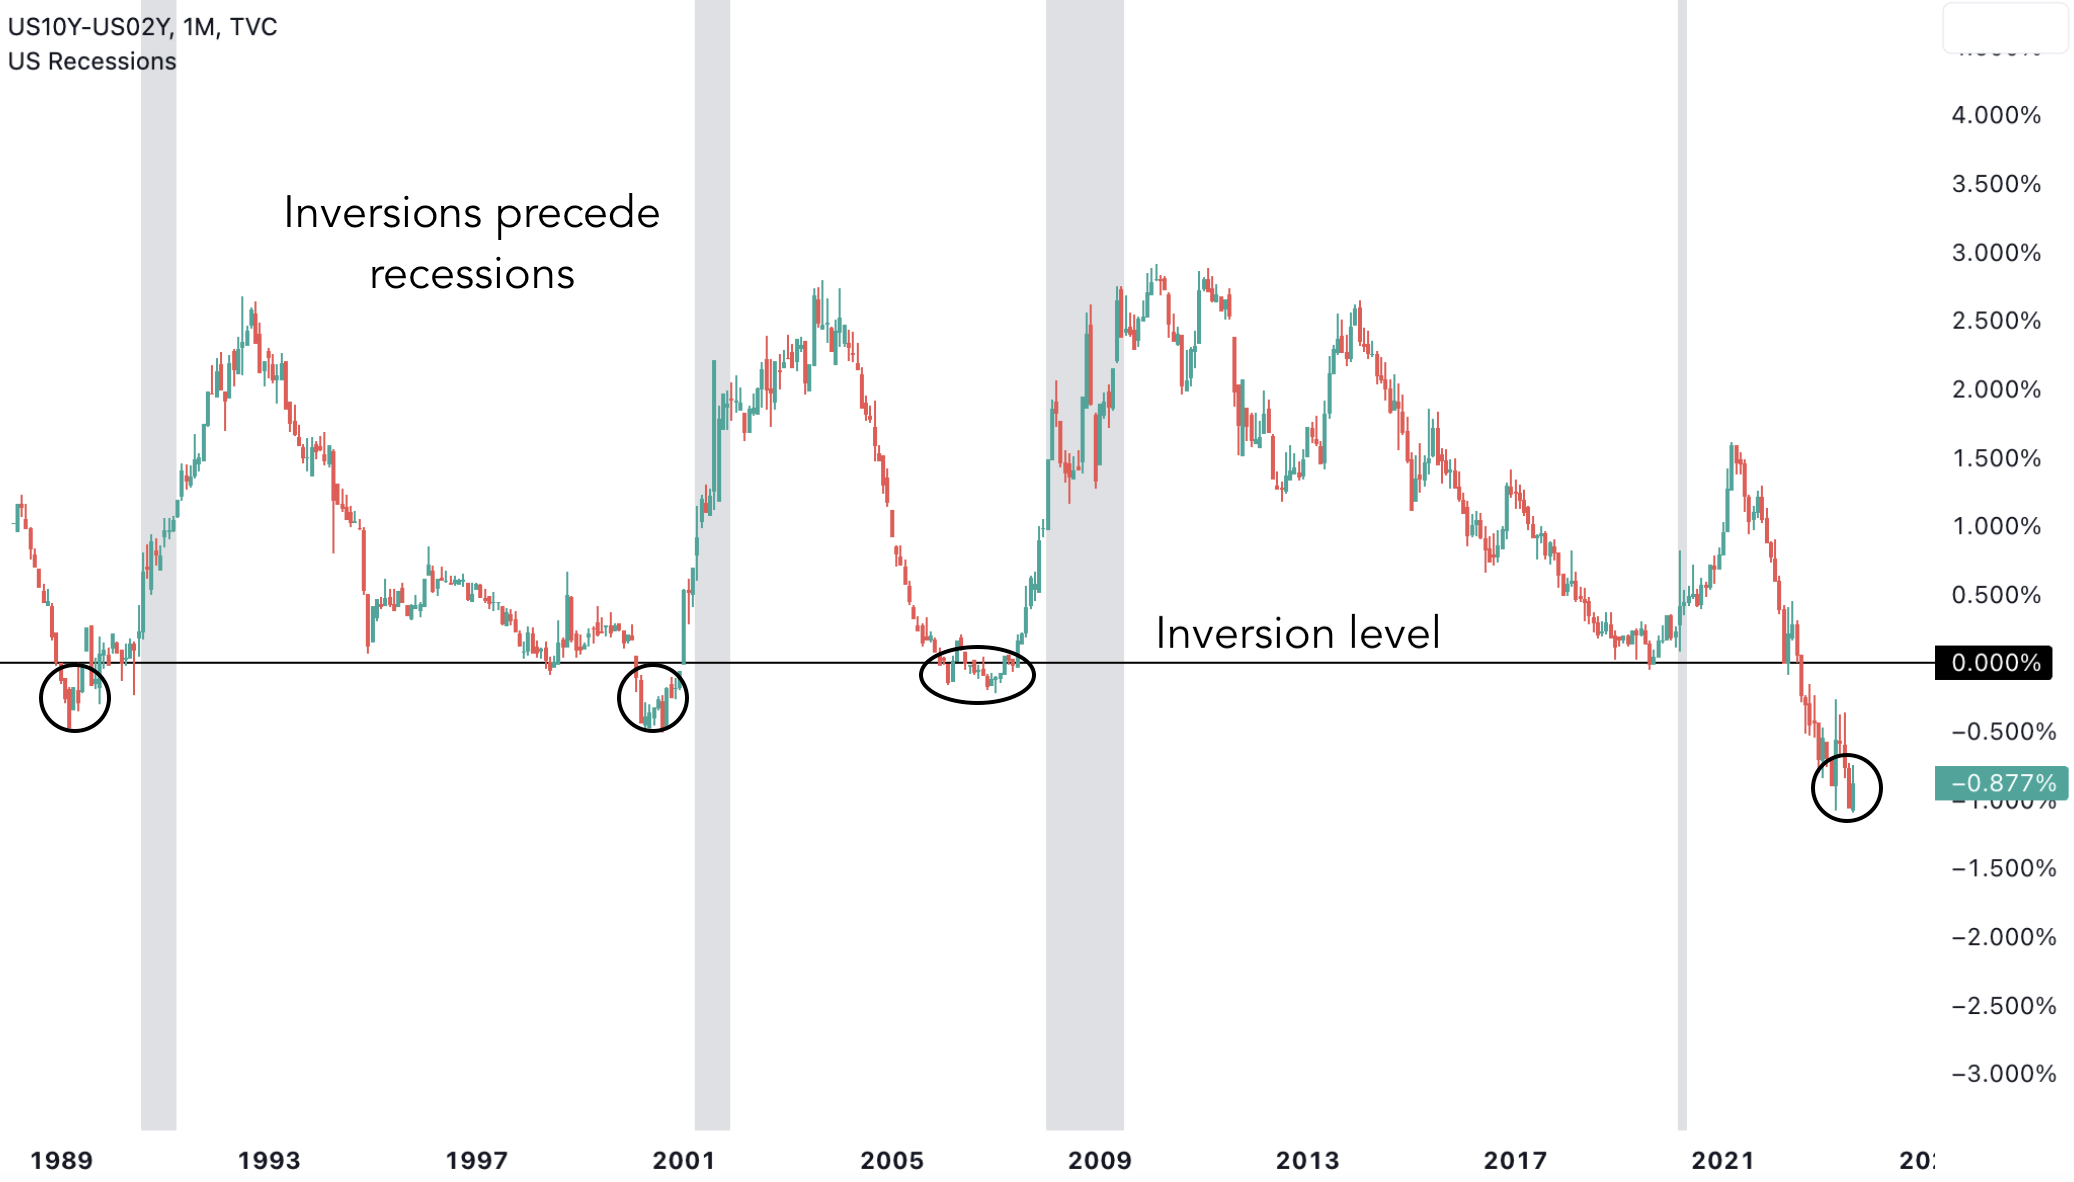
The current BAM signal is occurring alongside an inverted yield curve, which historically has preceded recessions, albeit with a time lag. The only previous instance of a simultaneous BAM signal and inverted yield curve was in 1967, and while returns were positive, the inversion was not as deeply pronounced as it is today.
A yield curve inversion has always led to a recession, although the timing of the recession can vary. Examples include the recessions that followed yield curve inversions in 1989 and 2006.
Conflicting Signals and Investor Belief
We are currently faced with a breadth signal that has a perfect track record of predicting better-than-average market returns in the 18 months that follow. However, there is also a macro signal from the bond market that has a 100% track record of predicting weakening economic activity and recessions.
The BAM signal and inverted yield curve have never triggered simultaneously, especially with the yield curve being as deeply inverted as it is now. This situation leaves it up to individual investors to decide whether they believe the inverted yield curve will accurately predict a recession this time around.
Gameoftrades.net‘s View: Tight Monetary Policy and its Impact
At gameoftrades.net, our view is that macro forces resulting from a very tight monetary policy will negatively impact the economy in the second half of 2023. As a result, stocks are likely to start pricing in these factors, potentially negating the bullish BAM signal over the next 6-12 months.
By considering both the BAM indicator and the broader macroeconomic environment, investors can make more informed decisions and navigate the markets with greater confidence.
Read more: Navigating the Stock Market Tug-of-War Between Peak Inflation and Inverted Yield Curve


