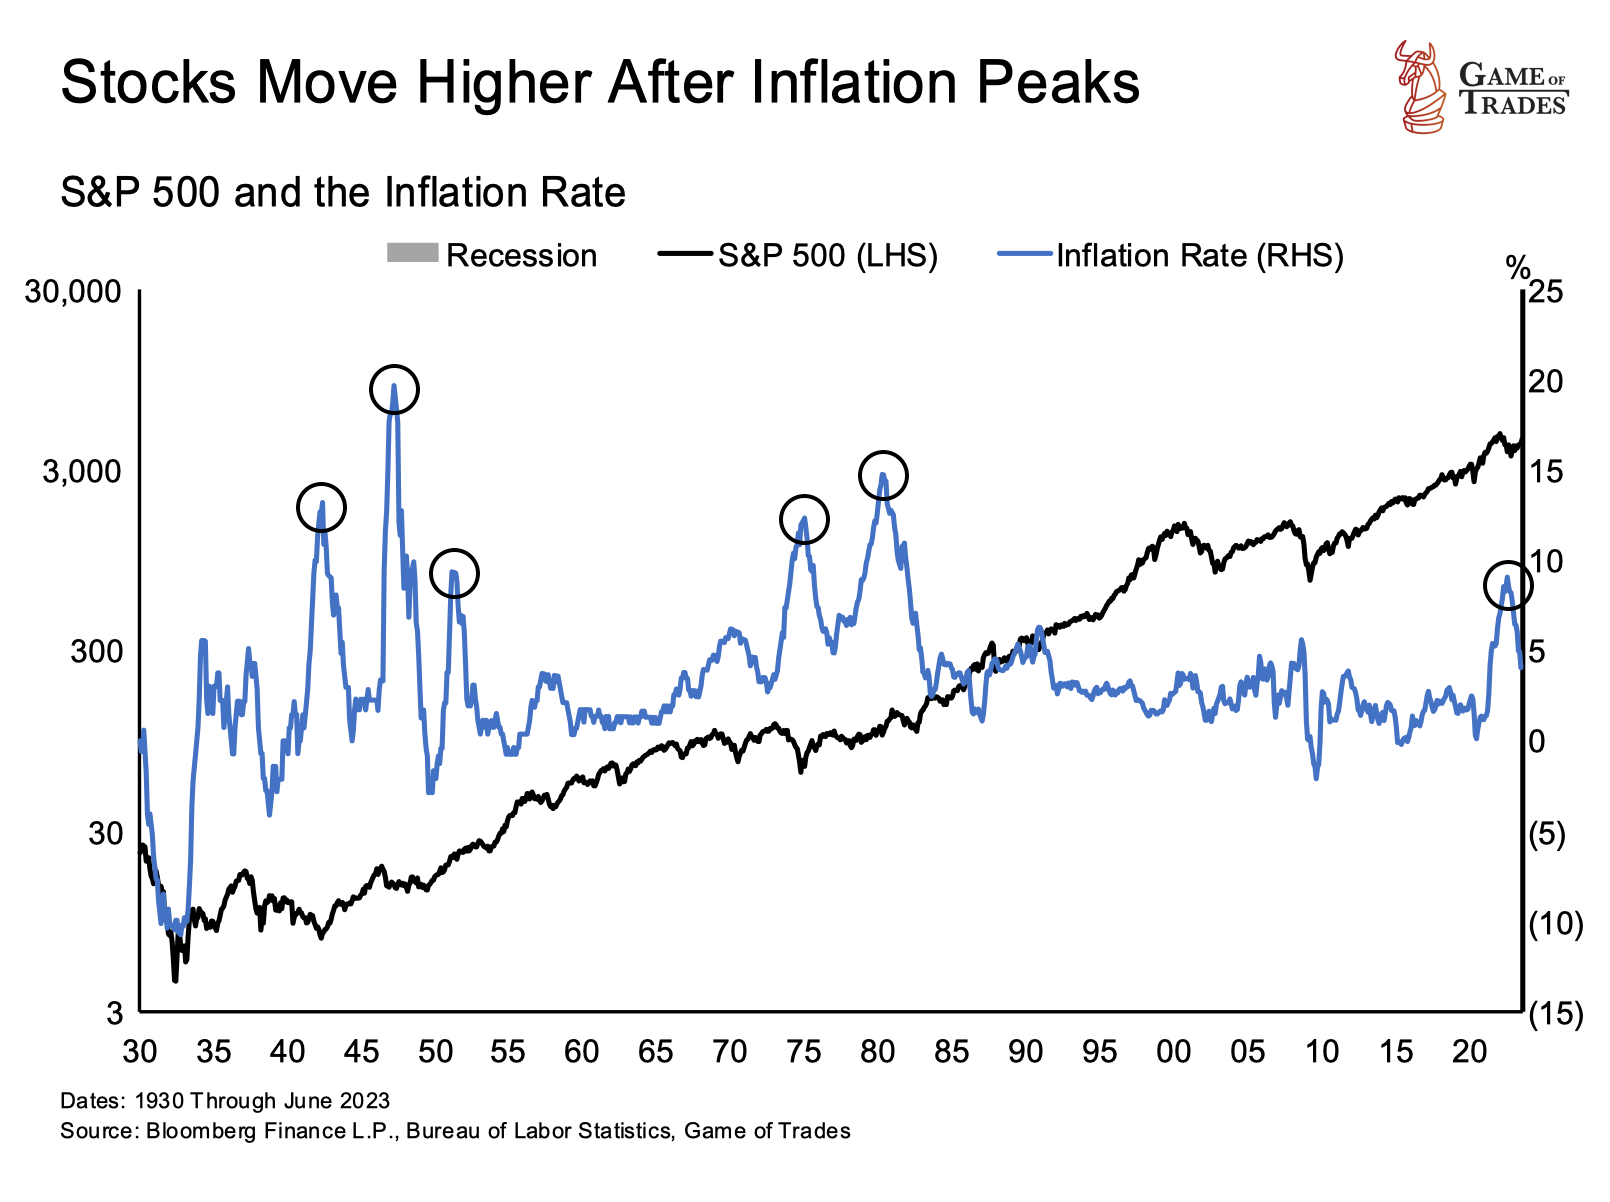
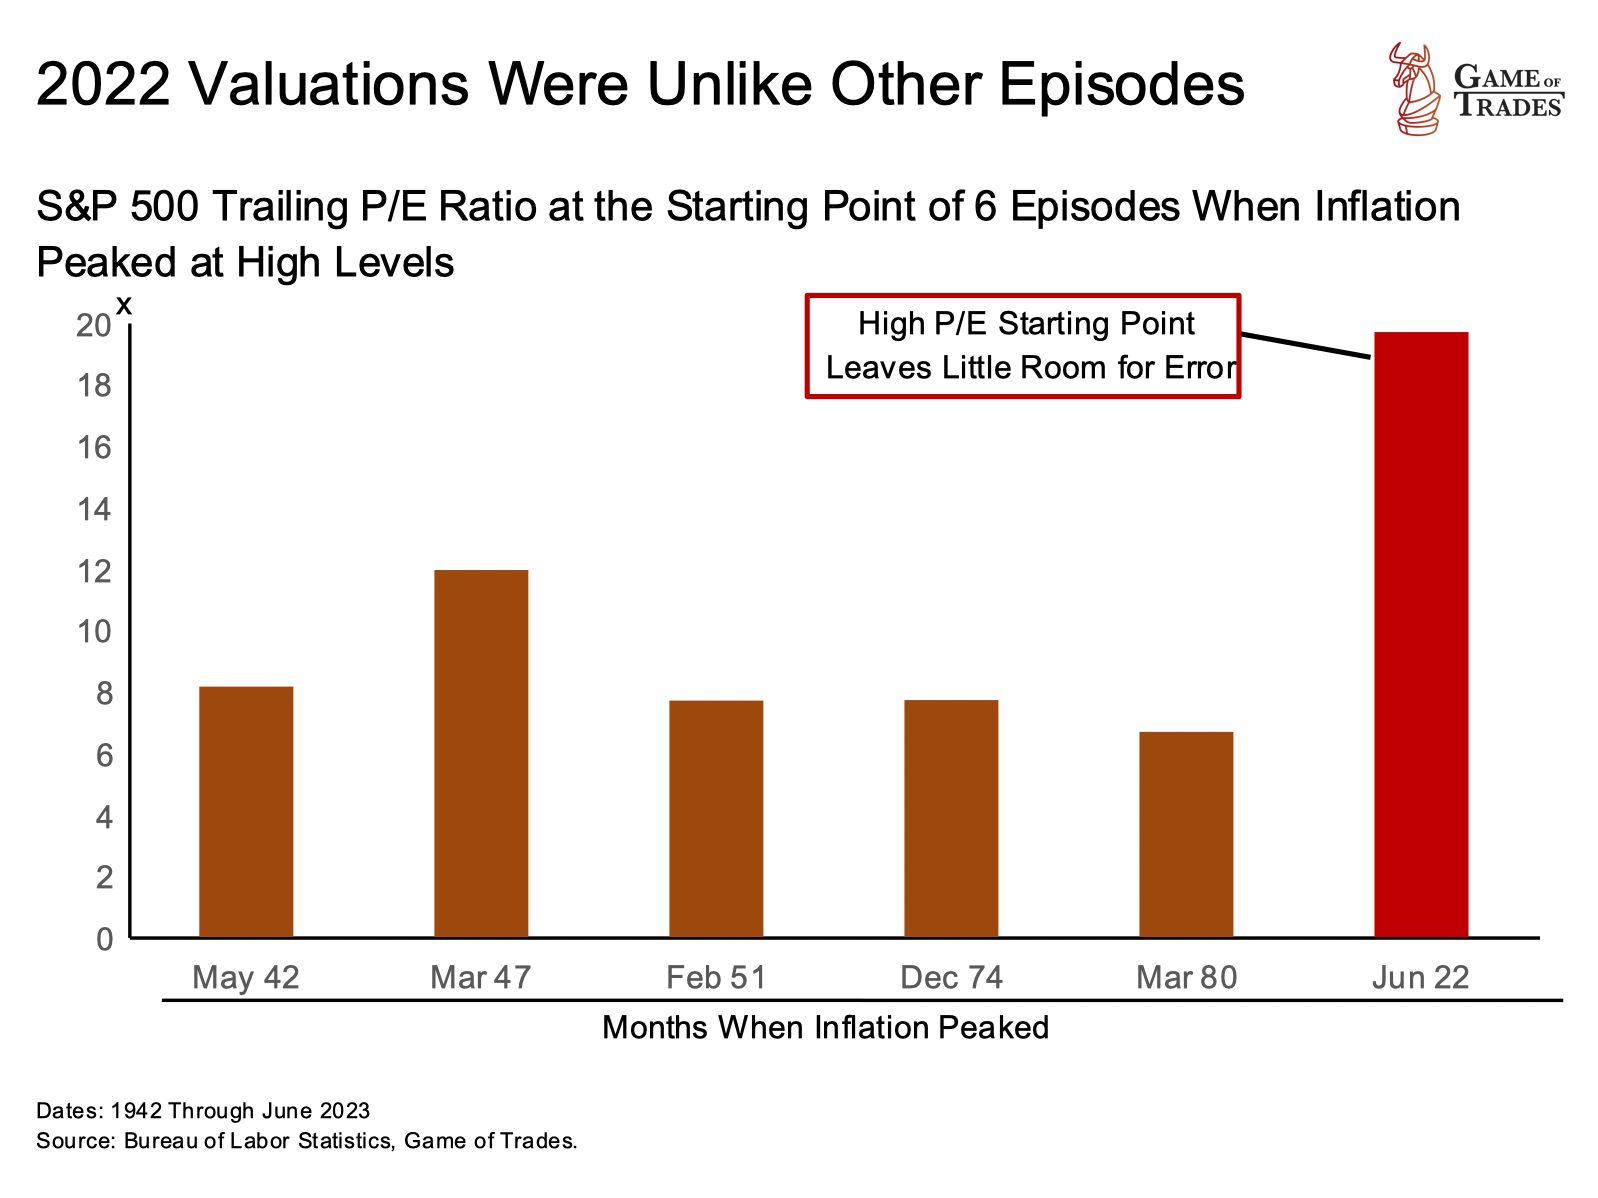
The stock market has been on a bullish run, with Price-to-Earnings (P/E) ratios, a key indicator of market valuations, climbing from around 20 to 25 since September 2022. This rally is largely driven by a key macroeconomic factor: the disinflation observed since June 2022, when inflation peaked at 9.1%. Since 1926, inflation has only peaked above 9% six times, each one leading to a subsequent market rally.
Contradicting Recessionary Signals from Inverted Yield Curve
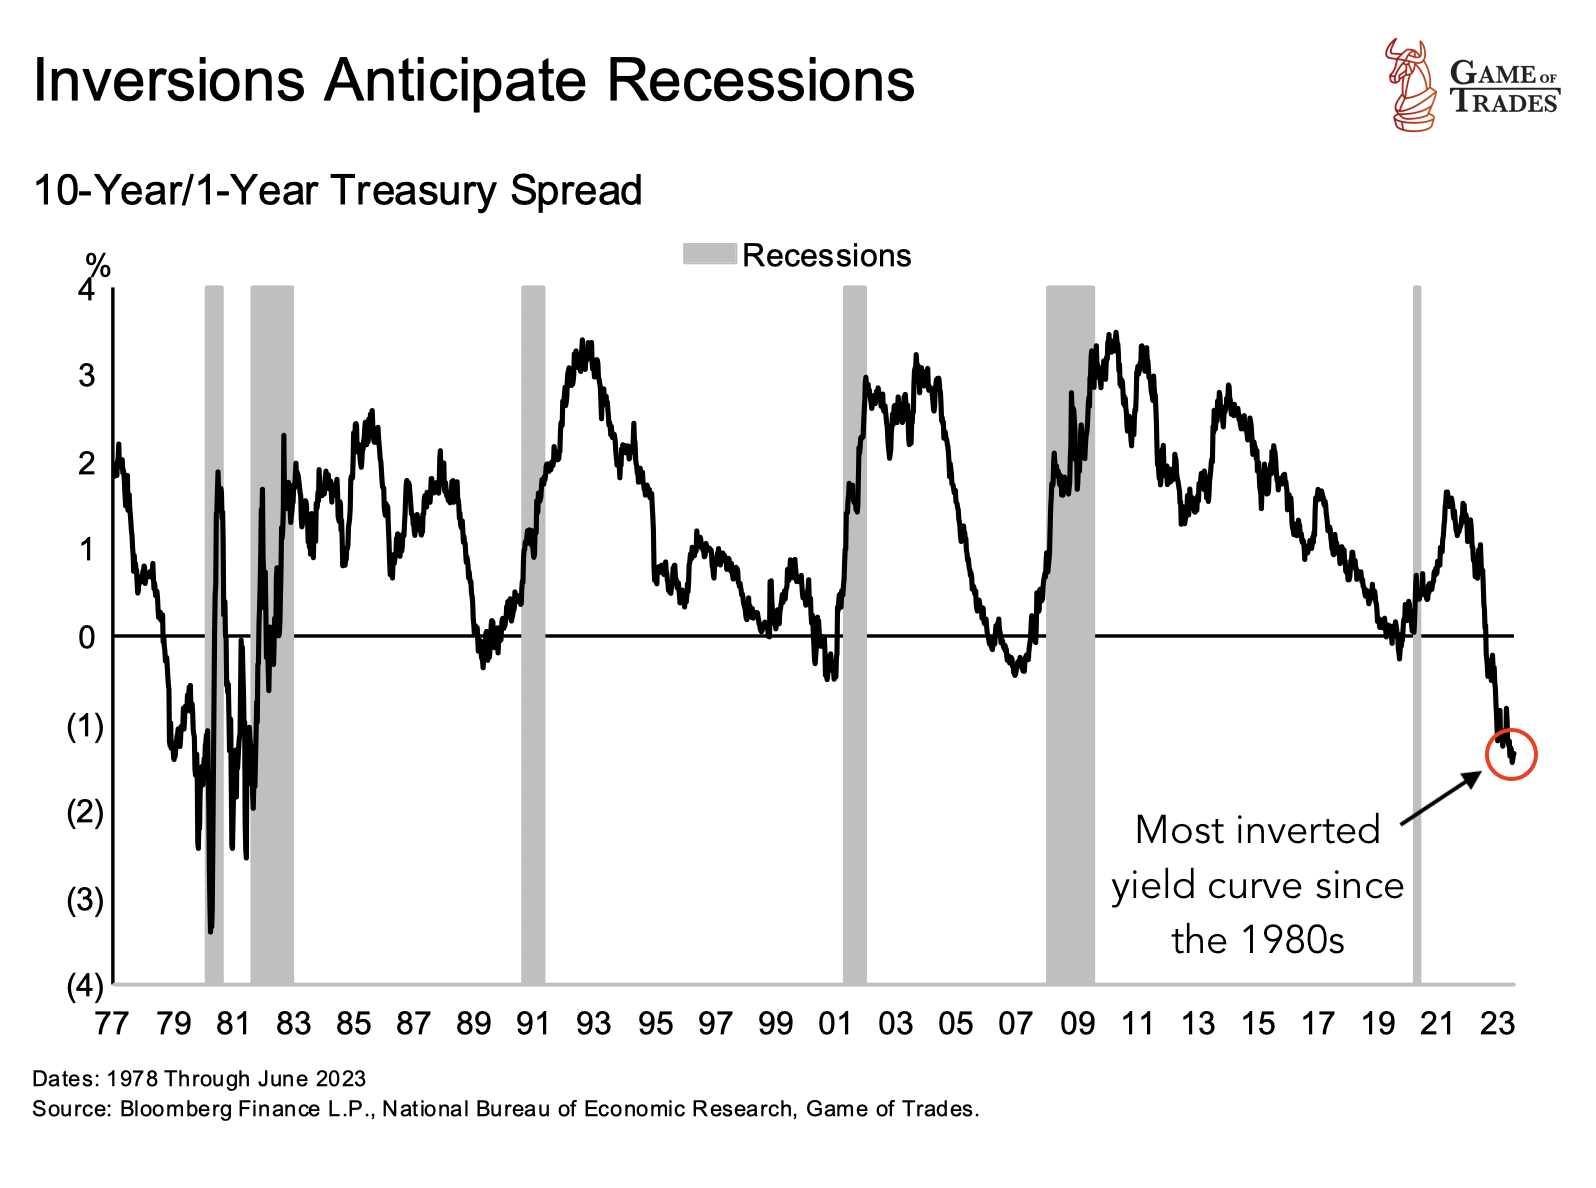
However, a recessionary signal from the bond market is contradicting this bullish trend. The yield curve is the most inverted since the 1980s, a condition that has historically anticipated recessions. We are currently witnessing a tug-of-war between two critical macro forces: rapidly declining inflation and an inverted yield curve.
Analyzing Post-Peak Inflation Market Performance
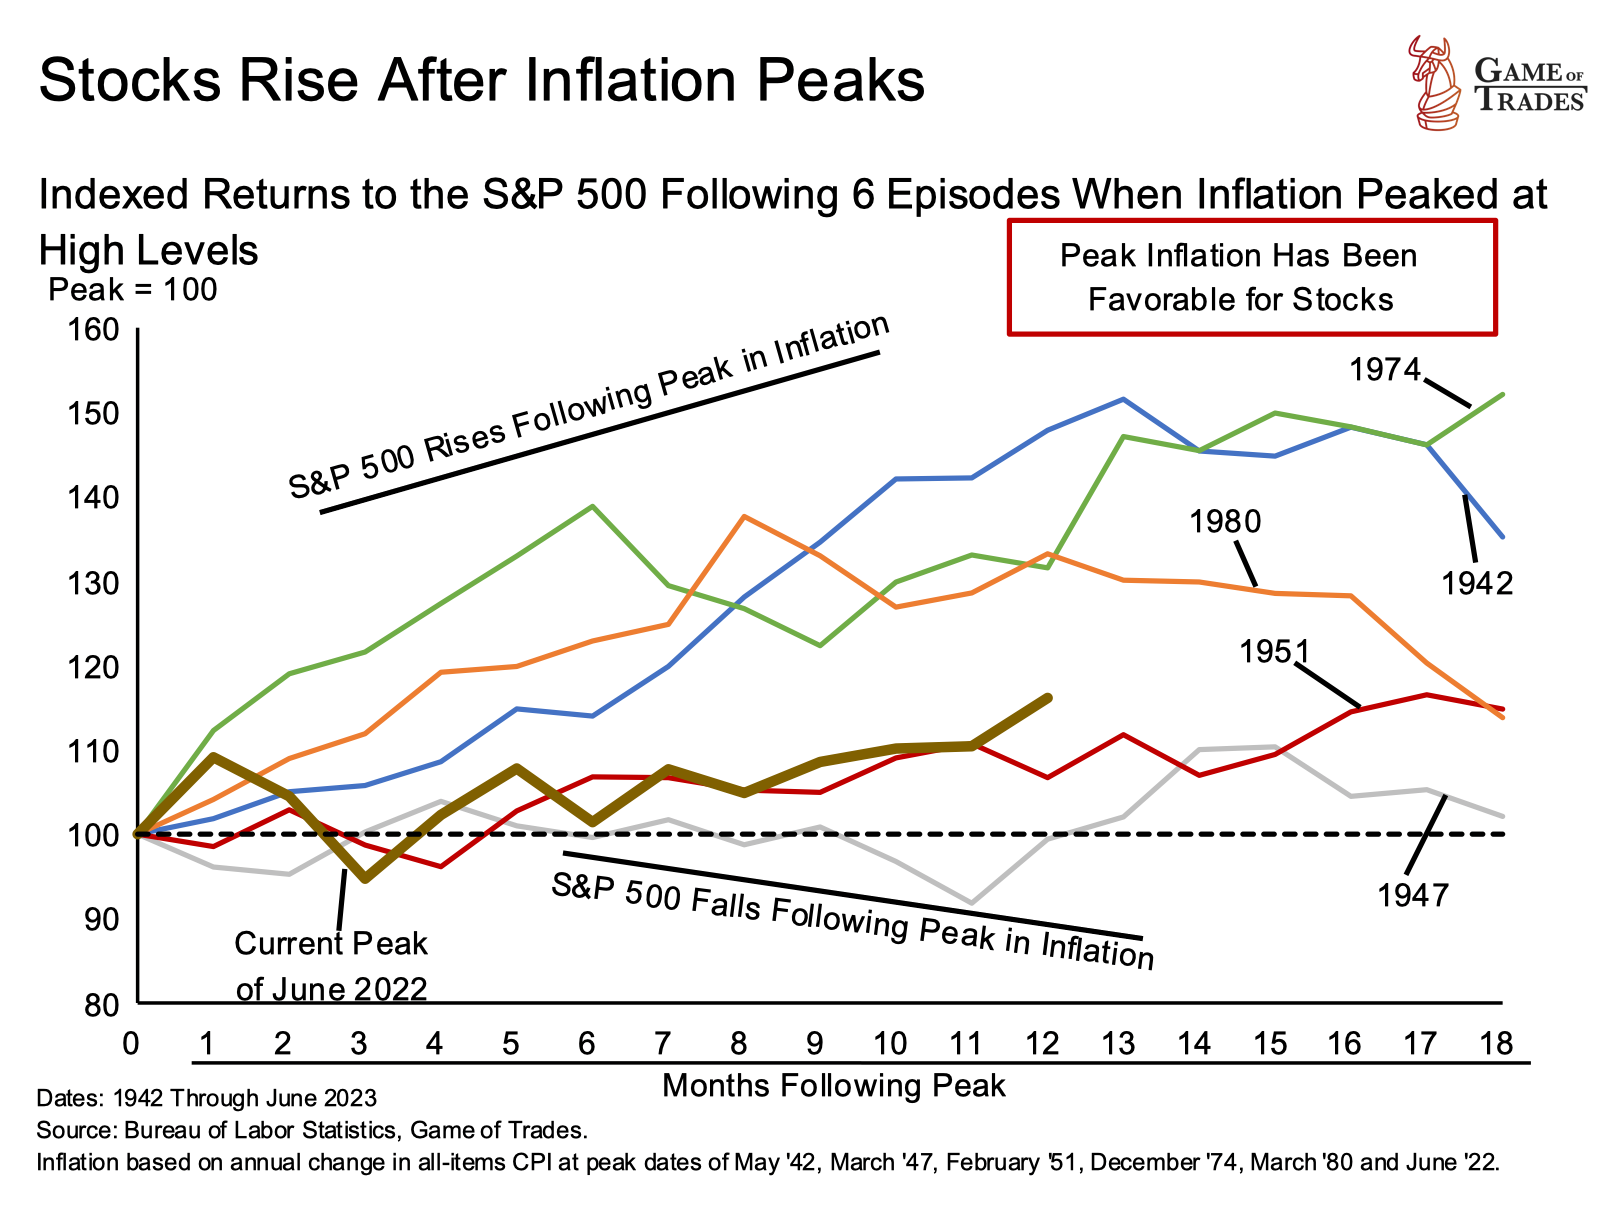
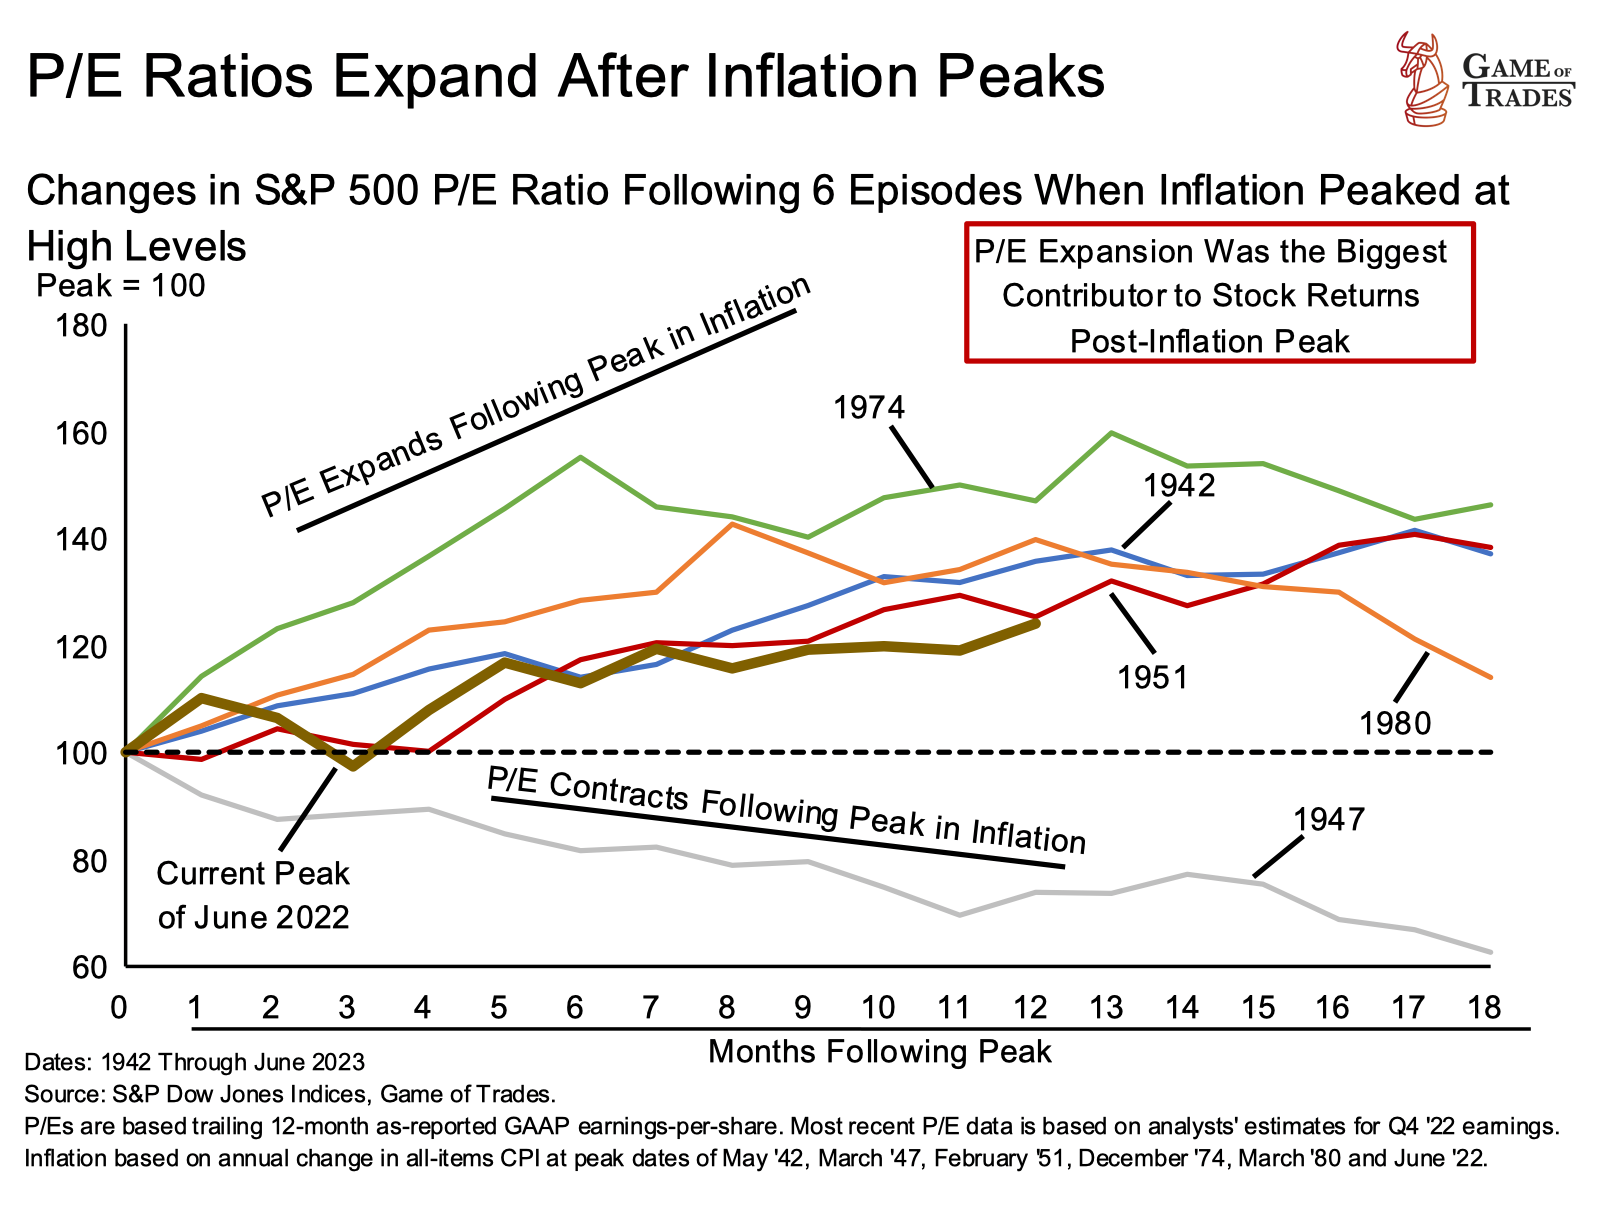
To understand which of these forces is likely to prevail, we need to delve deeper into these factors. Since 1942, six instances of peak inflation have led to strong market performance, with the only exception being in 1947. Strong market performance is typically characterized by two aspects: growth of corporate earnings and the Price-to-Earnings ratio. In other words, the profit corporations make and the price investors are willing to pay for a share of that profit.
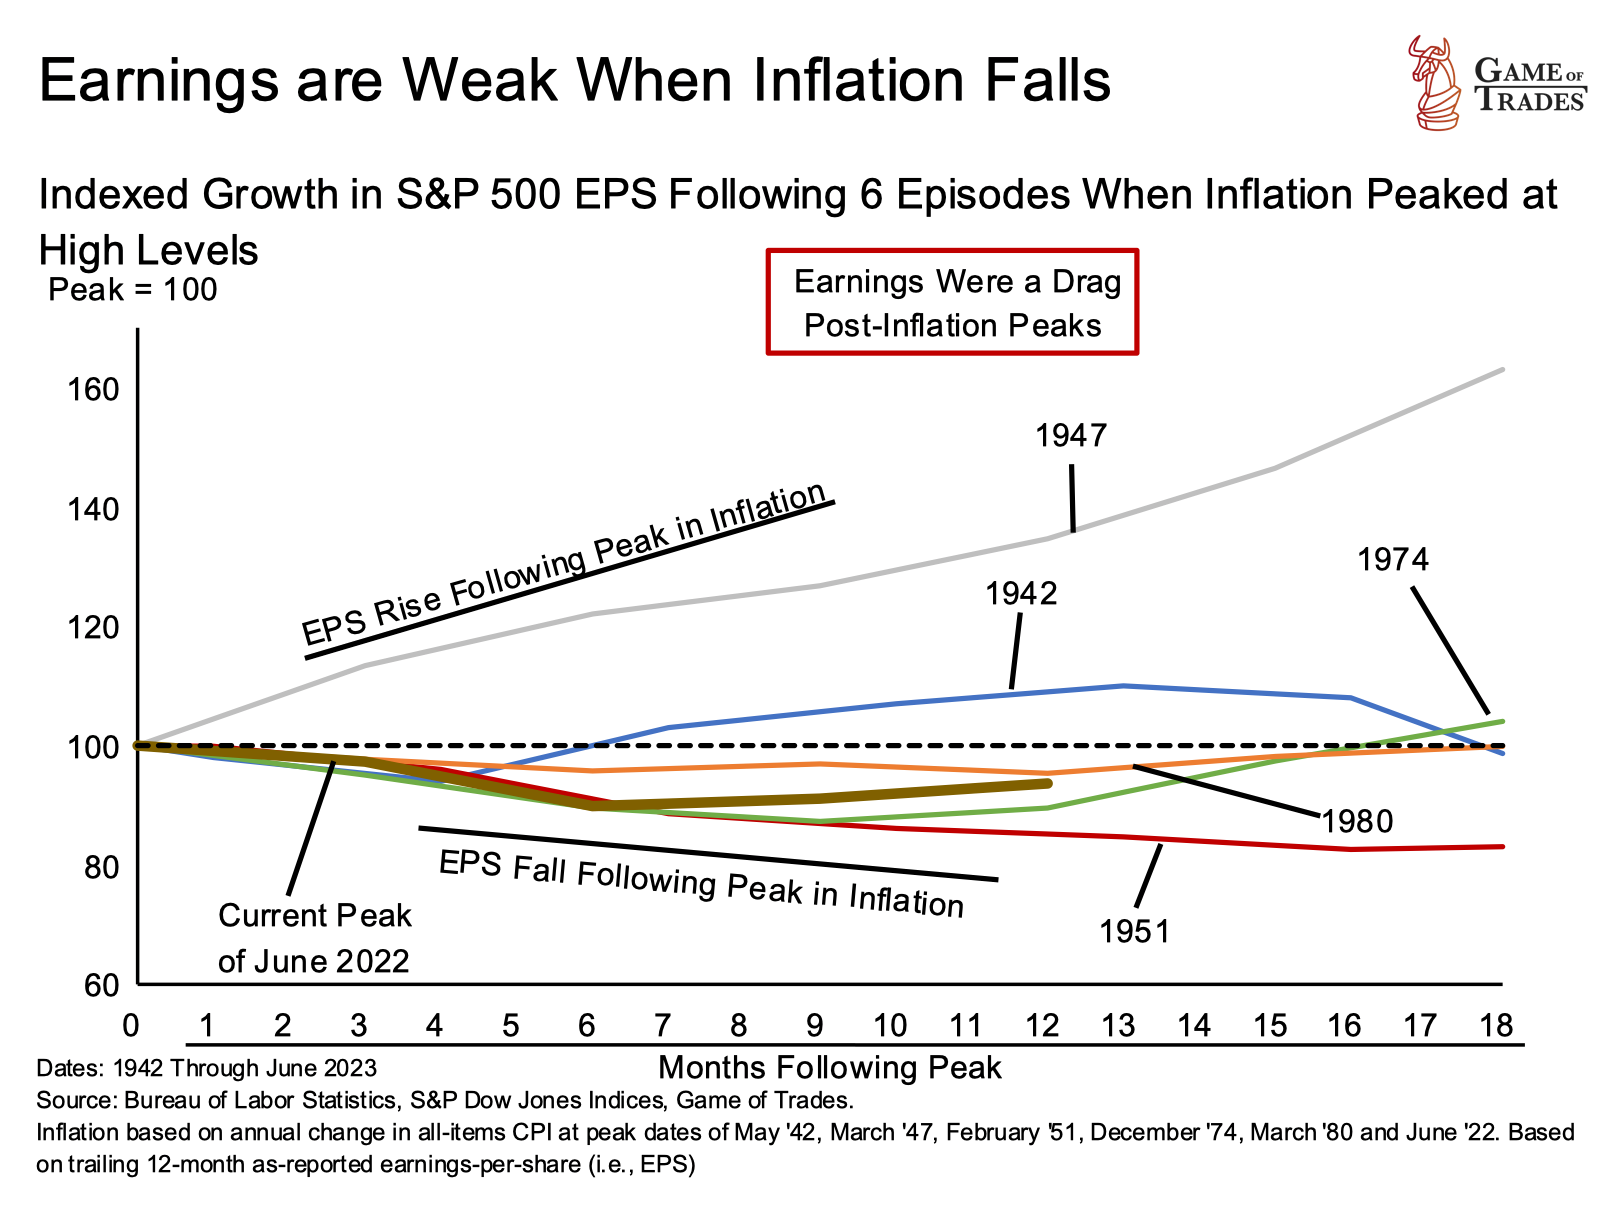
In the six instances of peak inflation since 1942, S&P 500 earnings growth has been weak in the subsequent 18 months, with the only exception being 1942. Currently, earnings have been contracting since the inflation peak in June 2022. Earnings growth weakens after peak inflation because it’s calculated nominally, without adjusting for inflation. High inflation boosts earnings, while declining inflation leads to struggling earnings. Post peak inflation, it’s valuation expansion (not earnings growth) that drives the market higher.
In the six instances of peak inflation since 1942, S&P 500 earnings growth has been weak in the subsequent 18 months, with the only exception being 1942. Currently, earnings have been contracting since the inflation peak in June 2022. Earnings growth weakens after peak inflation because it’s calculated nominally, without adjusting for inflation. High inflation boosts earnings, while declining inflation leads to struggling earnings. Post peak inflation, it’s valuation expansion (not earnings growth) that drives the market higher.
In the six instances of peak inflation since 1942, S&P 500 earnings growth has been weak in the subsequent 18 months, with the only exception being 1942. Currently, earnings have been contracting since the inflation peak in June 2022. Earnings growth weakens after peak inflation because it’s calculated nominally, without adjusting for inflation. High inflation boosts earnings, while declining inflation leads to struggling earnings. Post peak inflation, it’s valuation expansion (not earnings growth) that drives the market higher.
Risk of Recession from Inverted Yield Curve
The potential for a recession, as indicated by the inverted yield curve, is a significant risk to stocks. During an inverted curve, banks are less likely to lend money, creating tighter financial conditions.
Since 1962, P/E ratios tend to fall in the 12 months after an inversion, with the only exceptions being in 1989 and 2006. In 1989 and 2006, the recession did not immediately follow the inversion, allowing valuations to expand. However, P/E ratios eventually reverted back down as the recession unfolded.
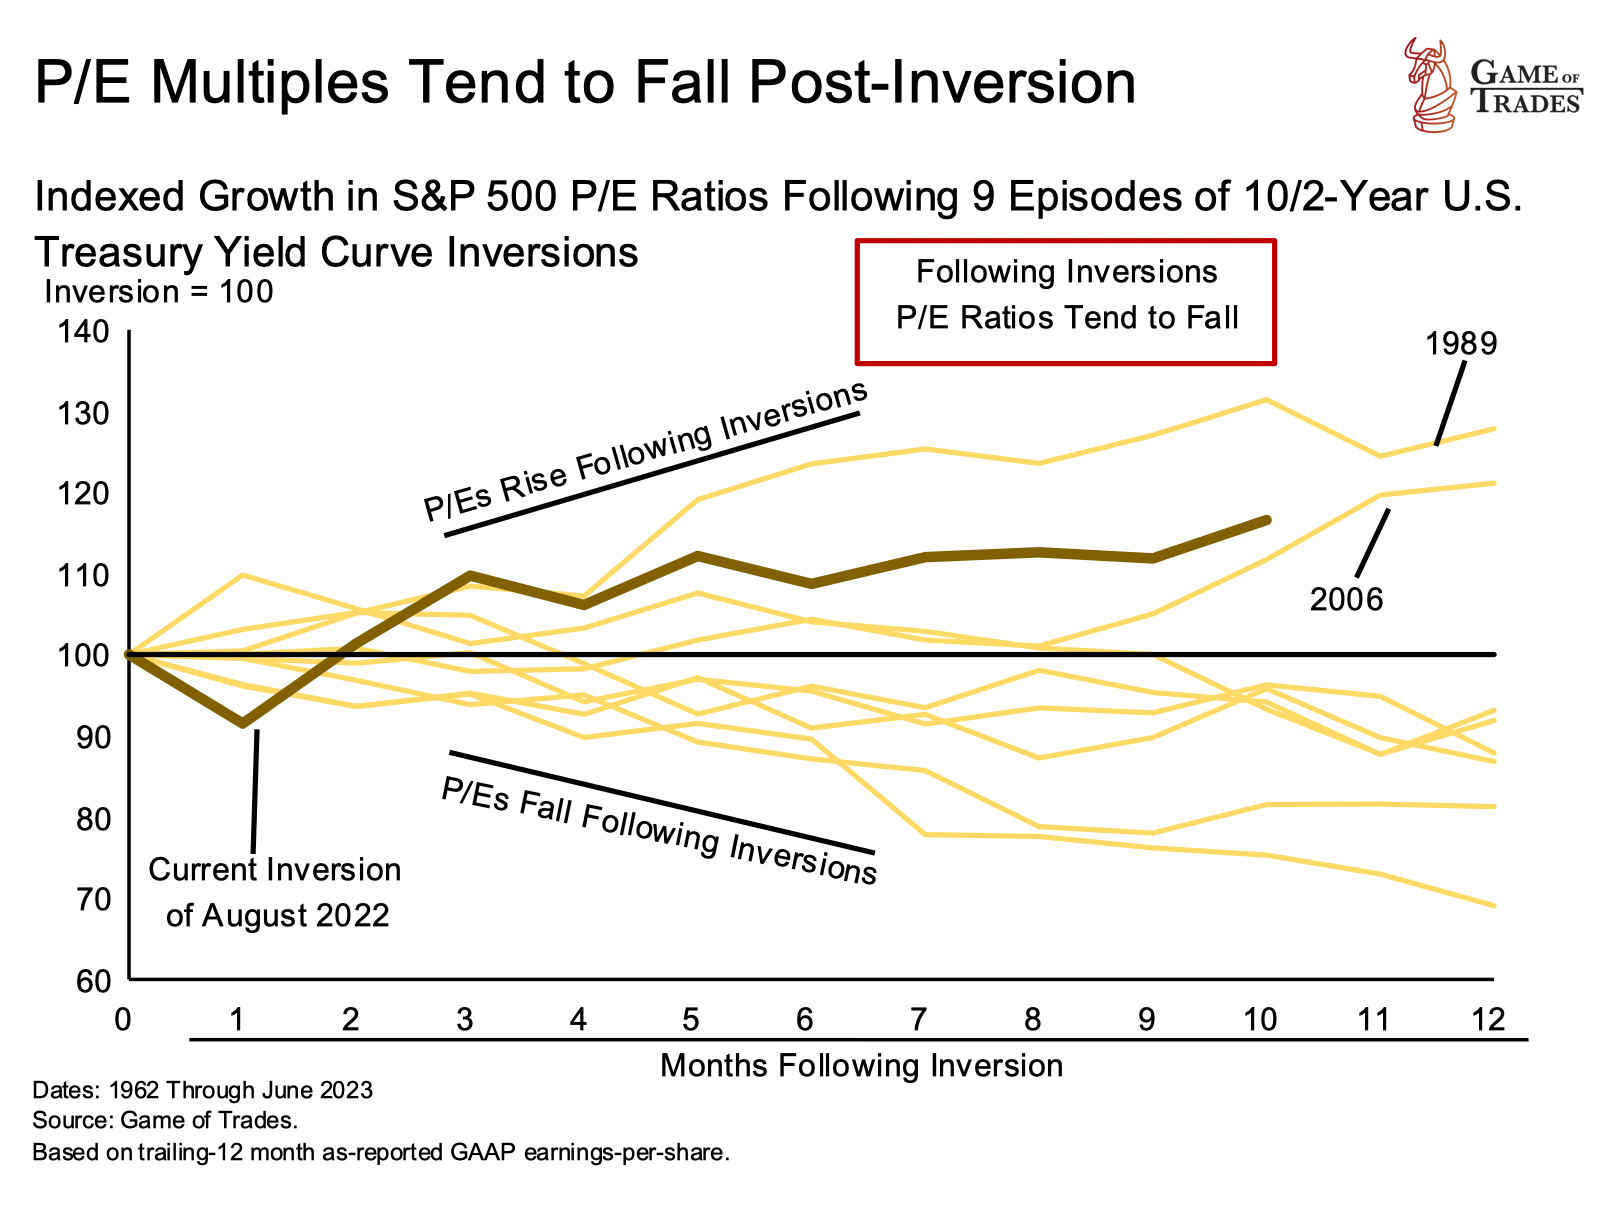
Currently, P/E ratios are expanding similarly to 1989 and 2006. Despite the yield curve inversion, the U.S. economy has not yet entered a recession, while the rapidly falling headline inflation is temporarily aiding P/E ratio expansion.
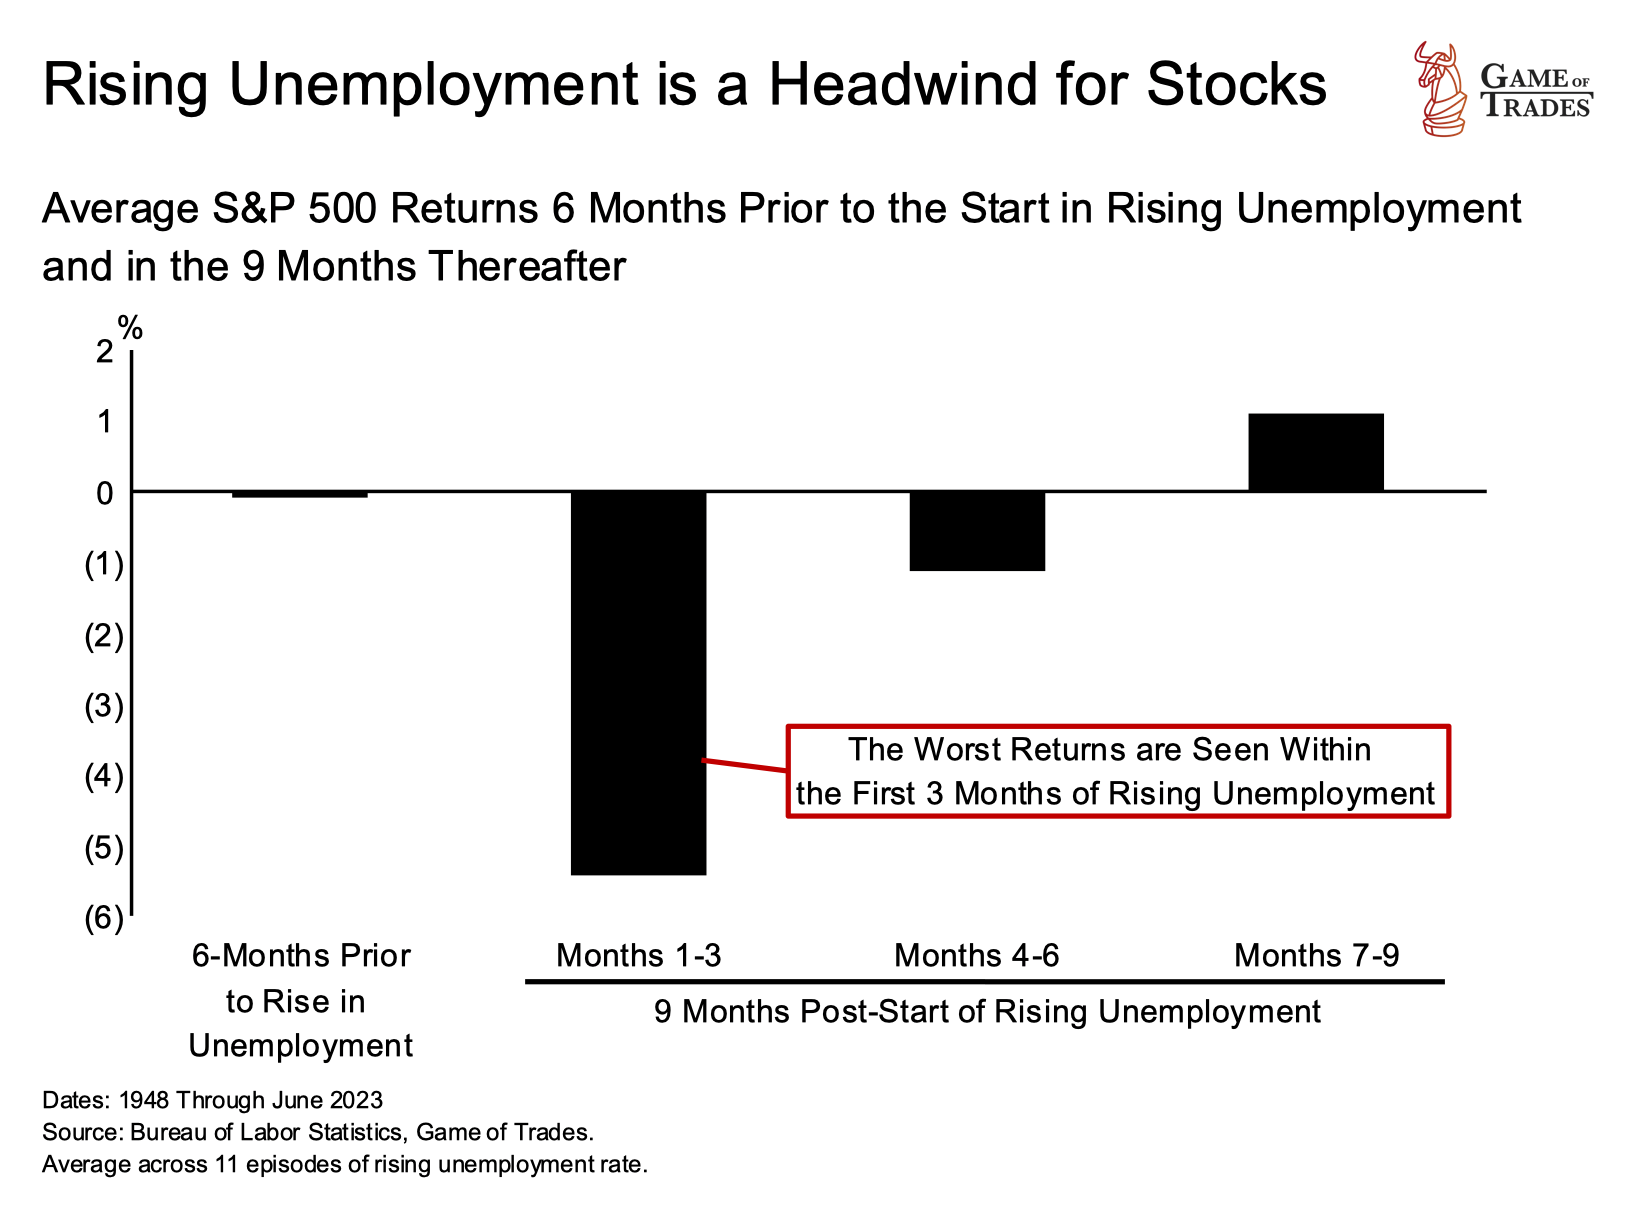
Inversions also accurately predict labor market weaknesses. An inverted yield curve typically leads to a higher unemployment rate, a major headwind for stocks.
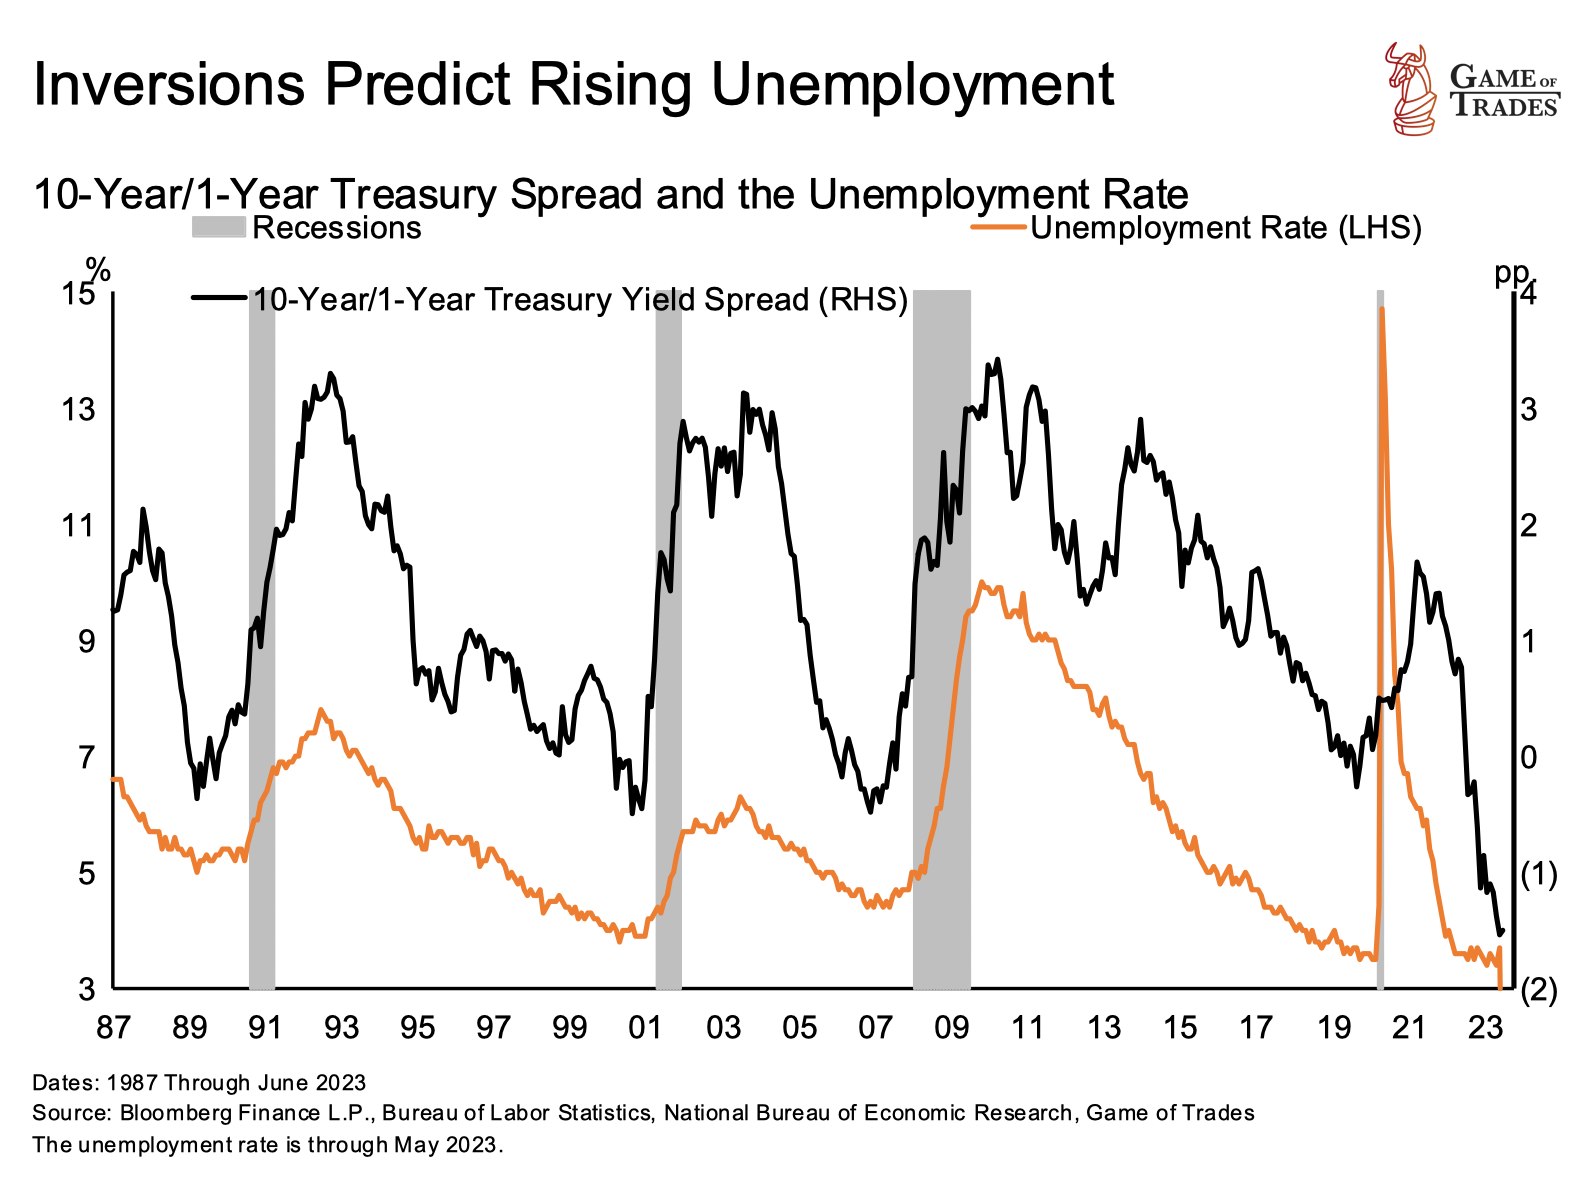
Although we haven’t seen the labor market weaken yet, when it does, the stock market tends to react swiftly and negatively. Markets have historically experienced significant drawdowns in the first 3 months of a rising unemployment rate.
Navigating the Opposing Forces
Currently, two opposing forces are acting on the stock market: peak inflation and an inverted yield curve. While peak inflation is pushing markets higher, the yield curve inversion is a significant concern. For equities to continue their upward trajectory, a recession needs to be delayed and earnings growth must start to trend higher – a scenario that seems unlikely.
In conclusion, investors need to be cautious and closely monitor these macroeconomic indicators to navigate the current market conditions effectively. Click here to get free trial for 7 days! Subscribe to our YouTube channel and Follow us on Twitter for more updates!
Read more: Existing Home Sales Point to a Sharp Contraction in S&P 500 Earnings


