As the stock market continues to evolve, investors often draw comparisons to past market periods. One such period that frequently comes up in discussions for the current market condition is the dot-com era of the late 1990s. In this article, we explore the similarities and differences between the tech stock landscape then and now. By examining key metrics, such as price returns, PE ratios, profitability, and market concentration, we aim to provide valuable insights into the current market environment and the potential opportunities and vulnerabilities it presents.
Concerns Arise from Nvidia’s Price Returns
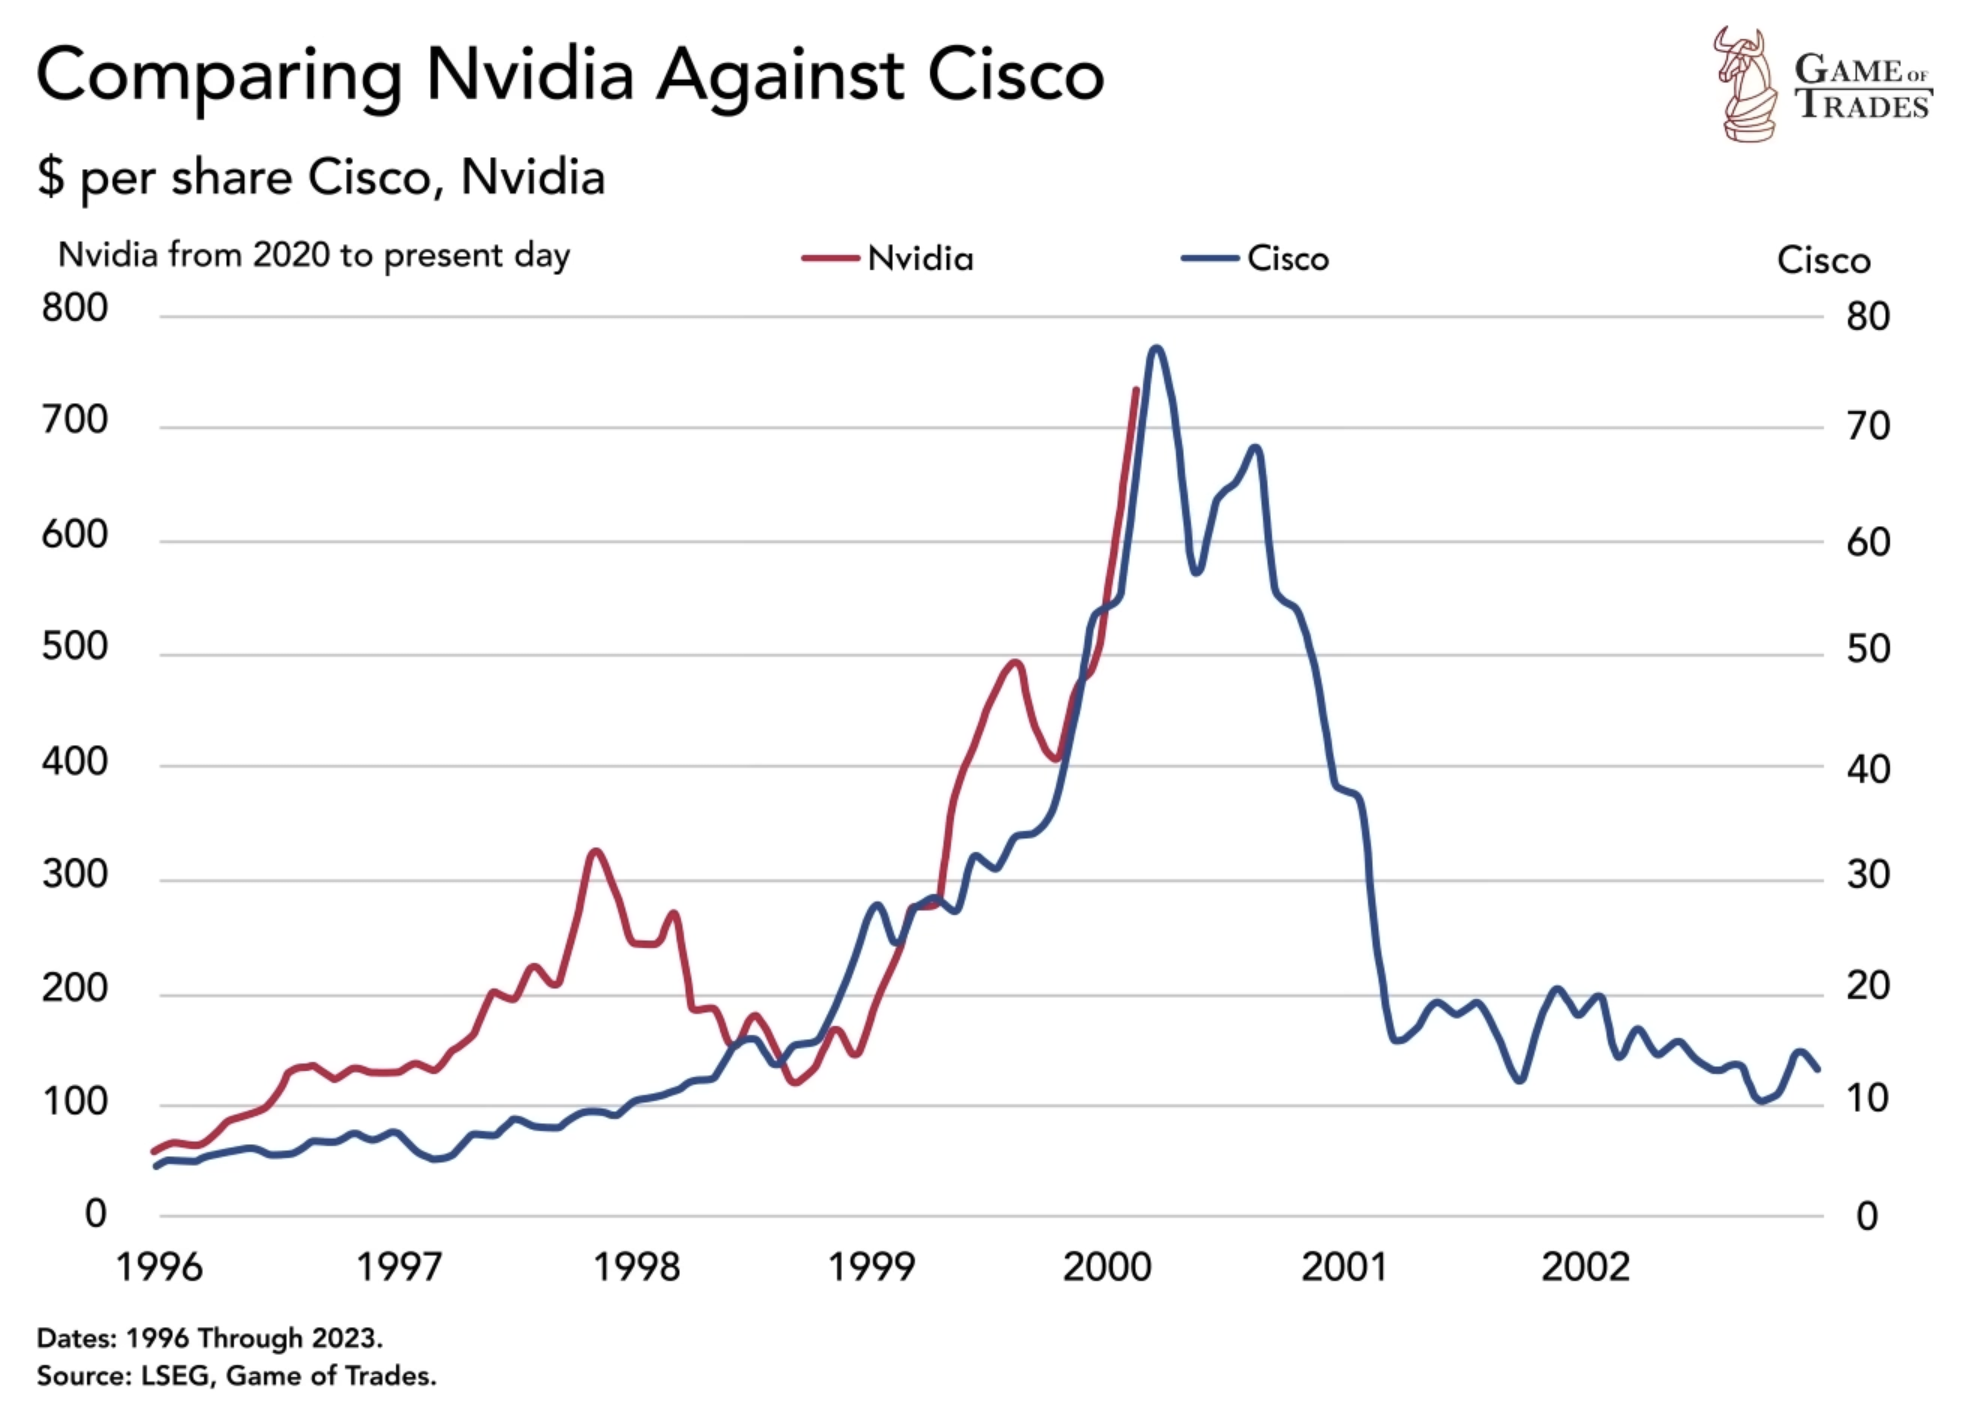
When comparing Nvidia’s recent 1,000% return over the last four years to Cisco’s surge and subsequent 80% decline in 1999, concerns of a potential bubble emerge. The similarity in the initial stages of the price pattern raises cautionary flags. This has led to fears of a an impending explosion like the 2000s tech stock crash. However, it is crucial to consider the underlying factors driving each stock’s performance.
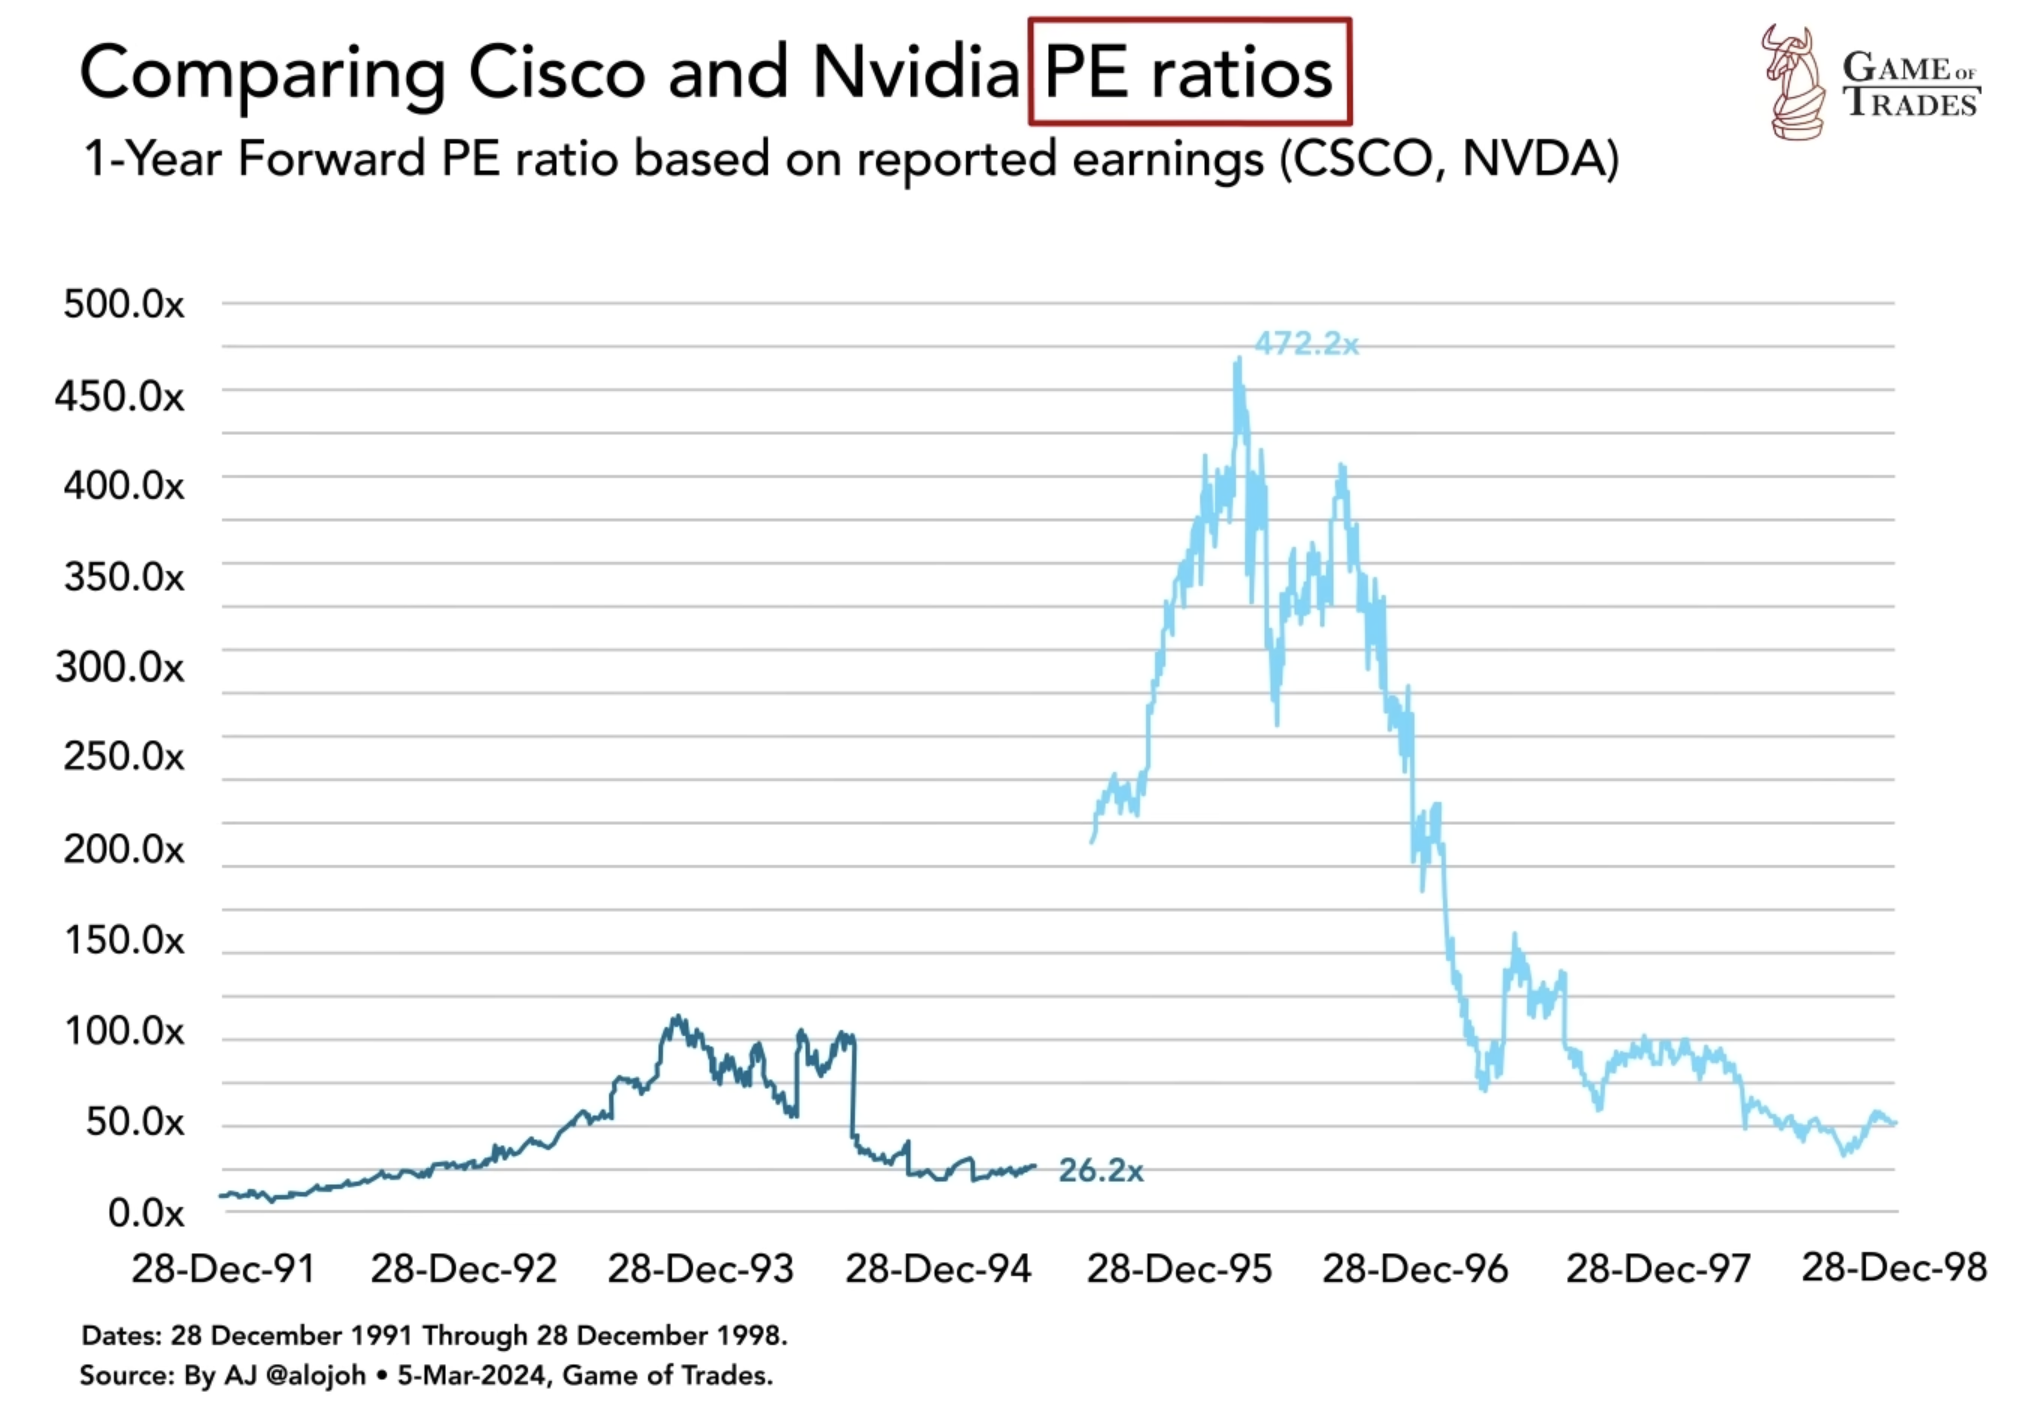
A comparison of PE ratios reveals a stark difference between Nvidia and Cisco. Nvidia’s PE ratio currently stands at 26.2, despite its significant price rise, indicating that the stock is not cheap but far from a bubble. In contrast, Cisco had a peak PE ratio of 472 in 1999, highlighting the excessive valuations that characterized the dot-com era.
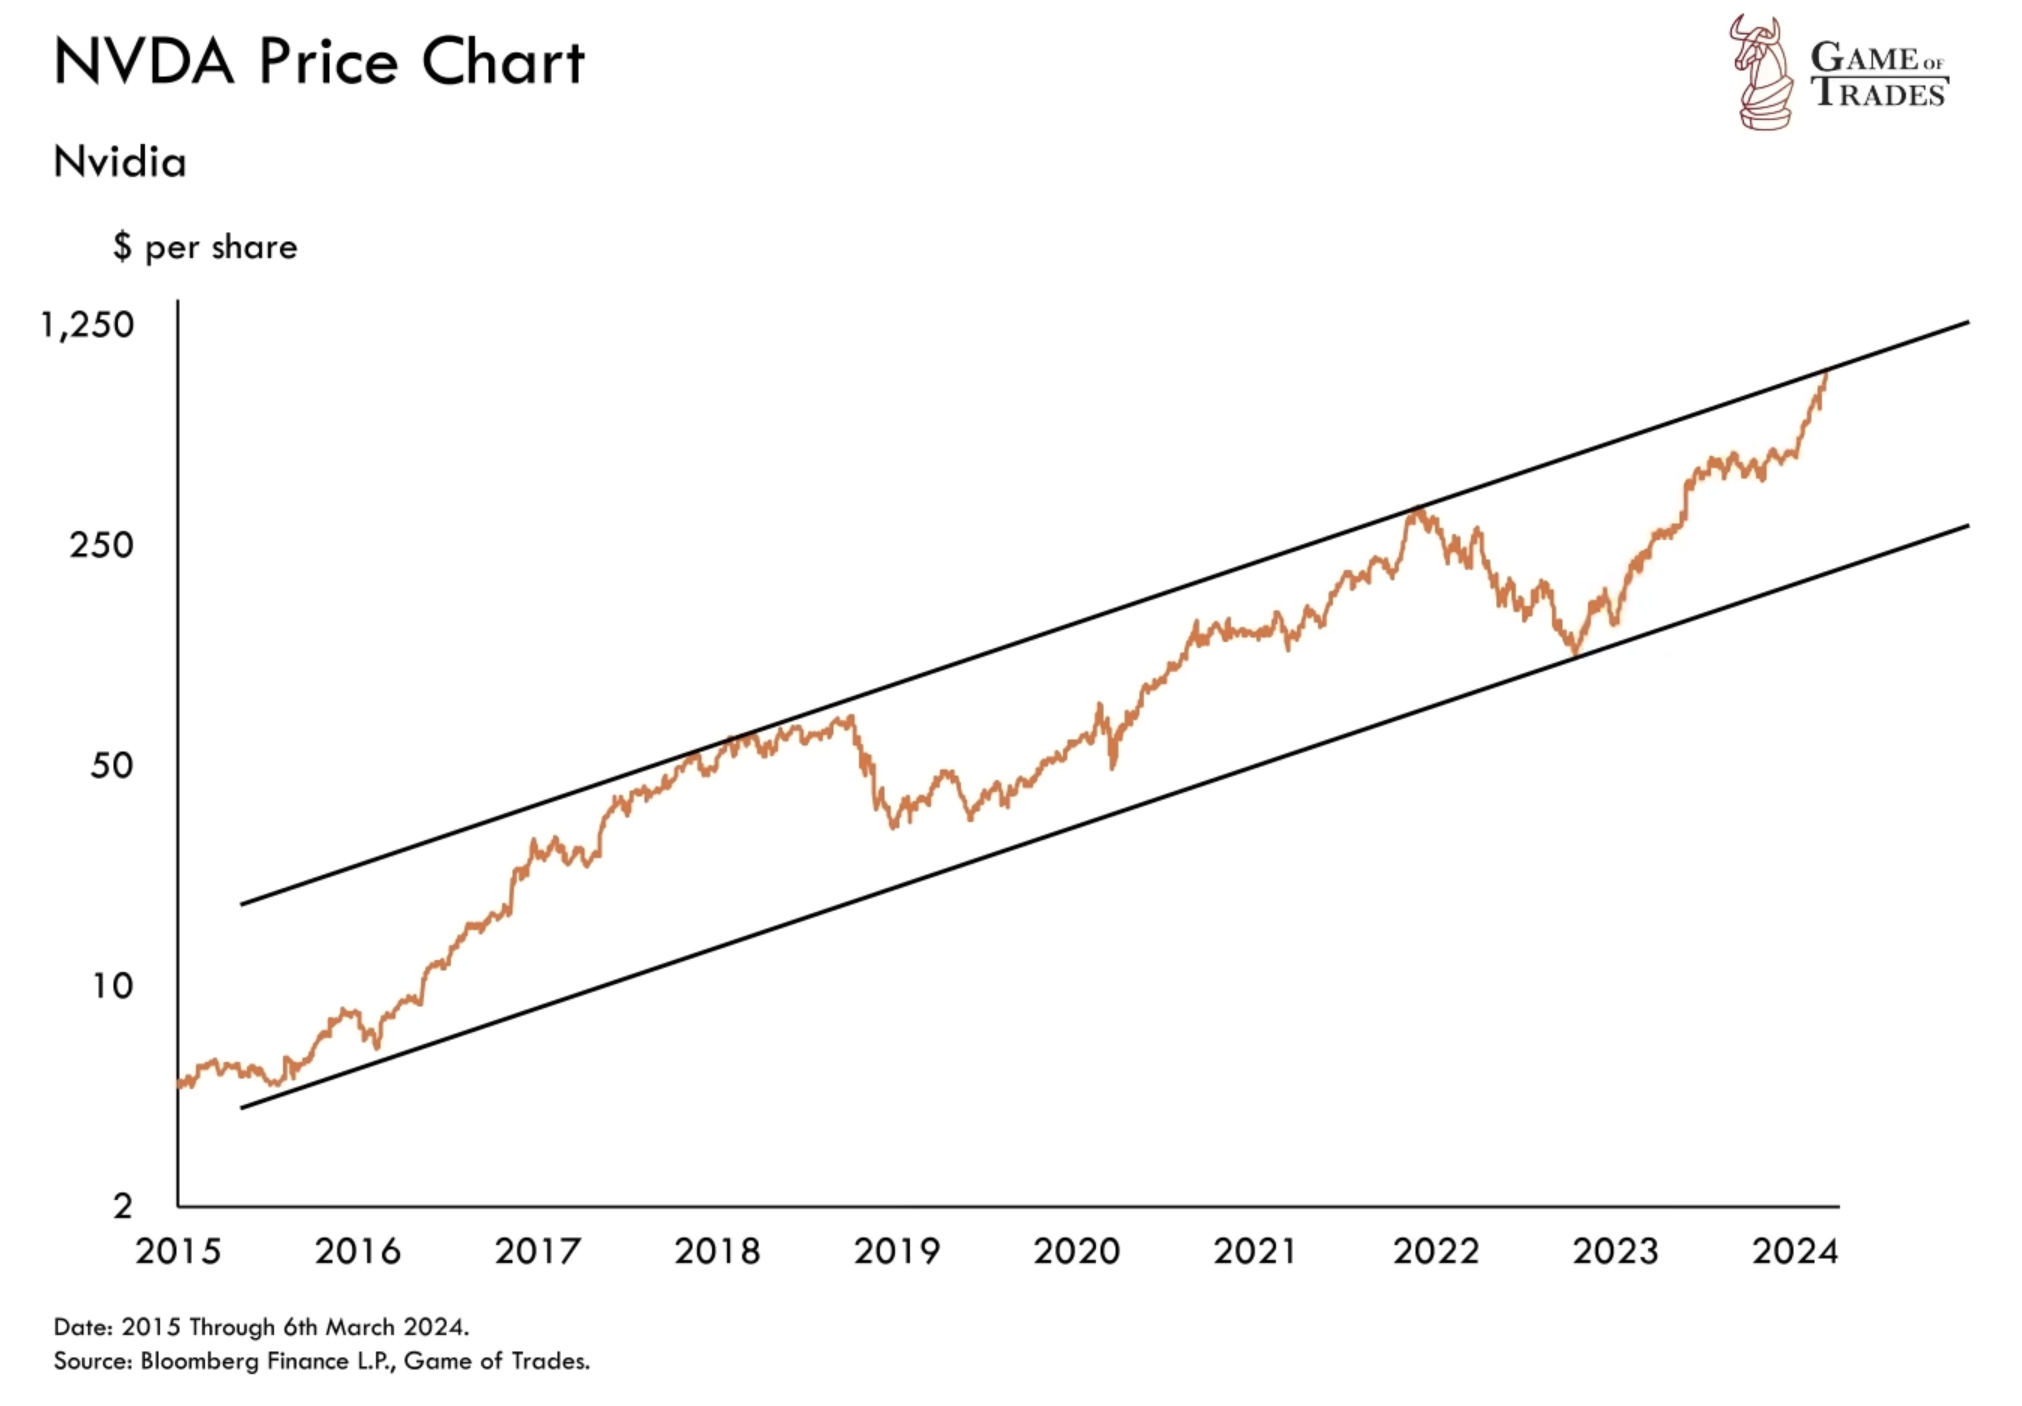
Most of Nvidia’s recent gains can be attributed to the company’s rapid growth. Technical analysis suggests a potential breather or less aggressive climb in the near future, given the presence of channel resistance. However, when considering valuations, it becomes clear that Nvidia’s ascent is not fueled only by speculative exuberance like Cisco’s in 1999. This distinction indicates a more stable foundation for Nvidia’s growth trajectory.
Profitability of Tech Stocks
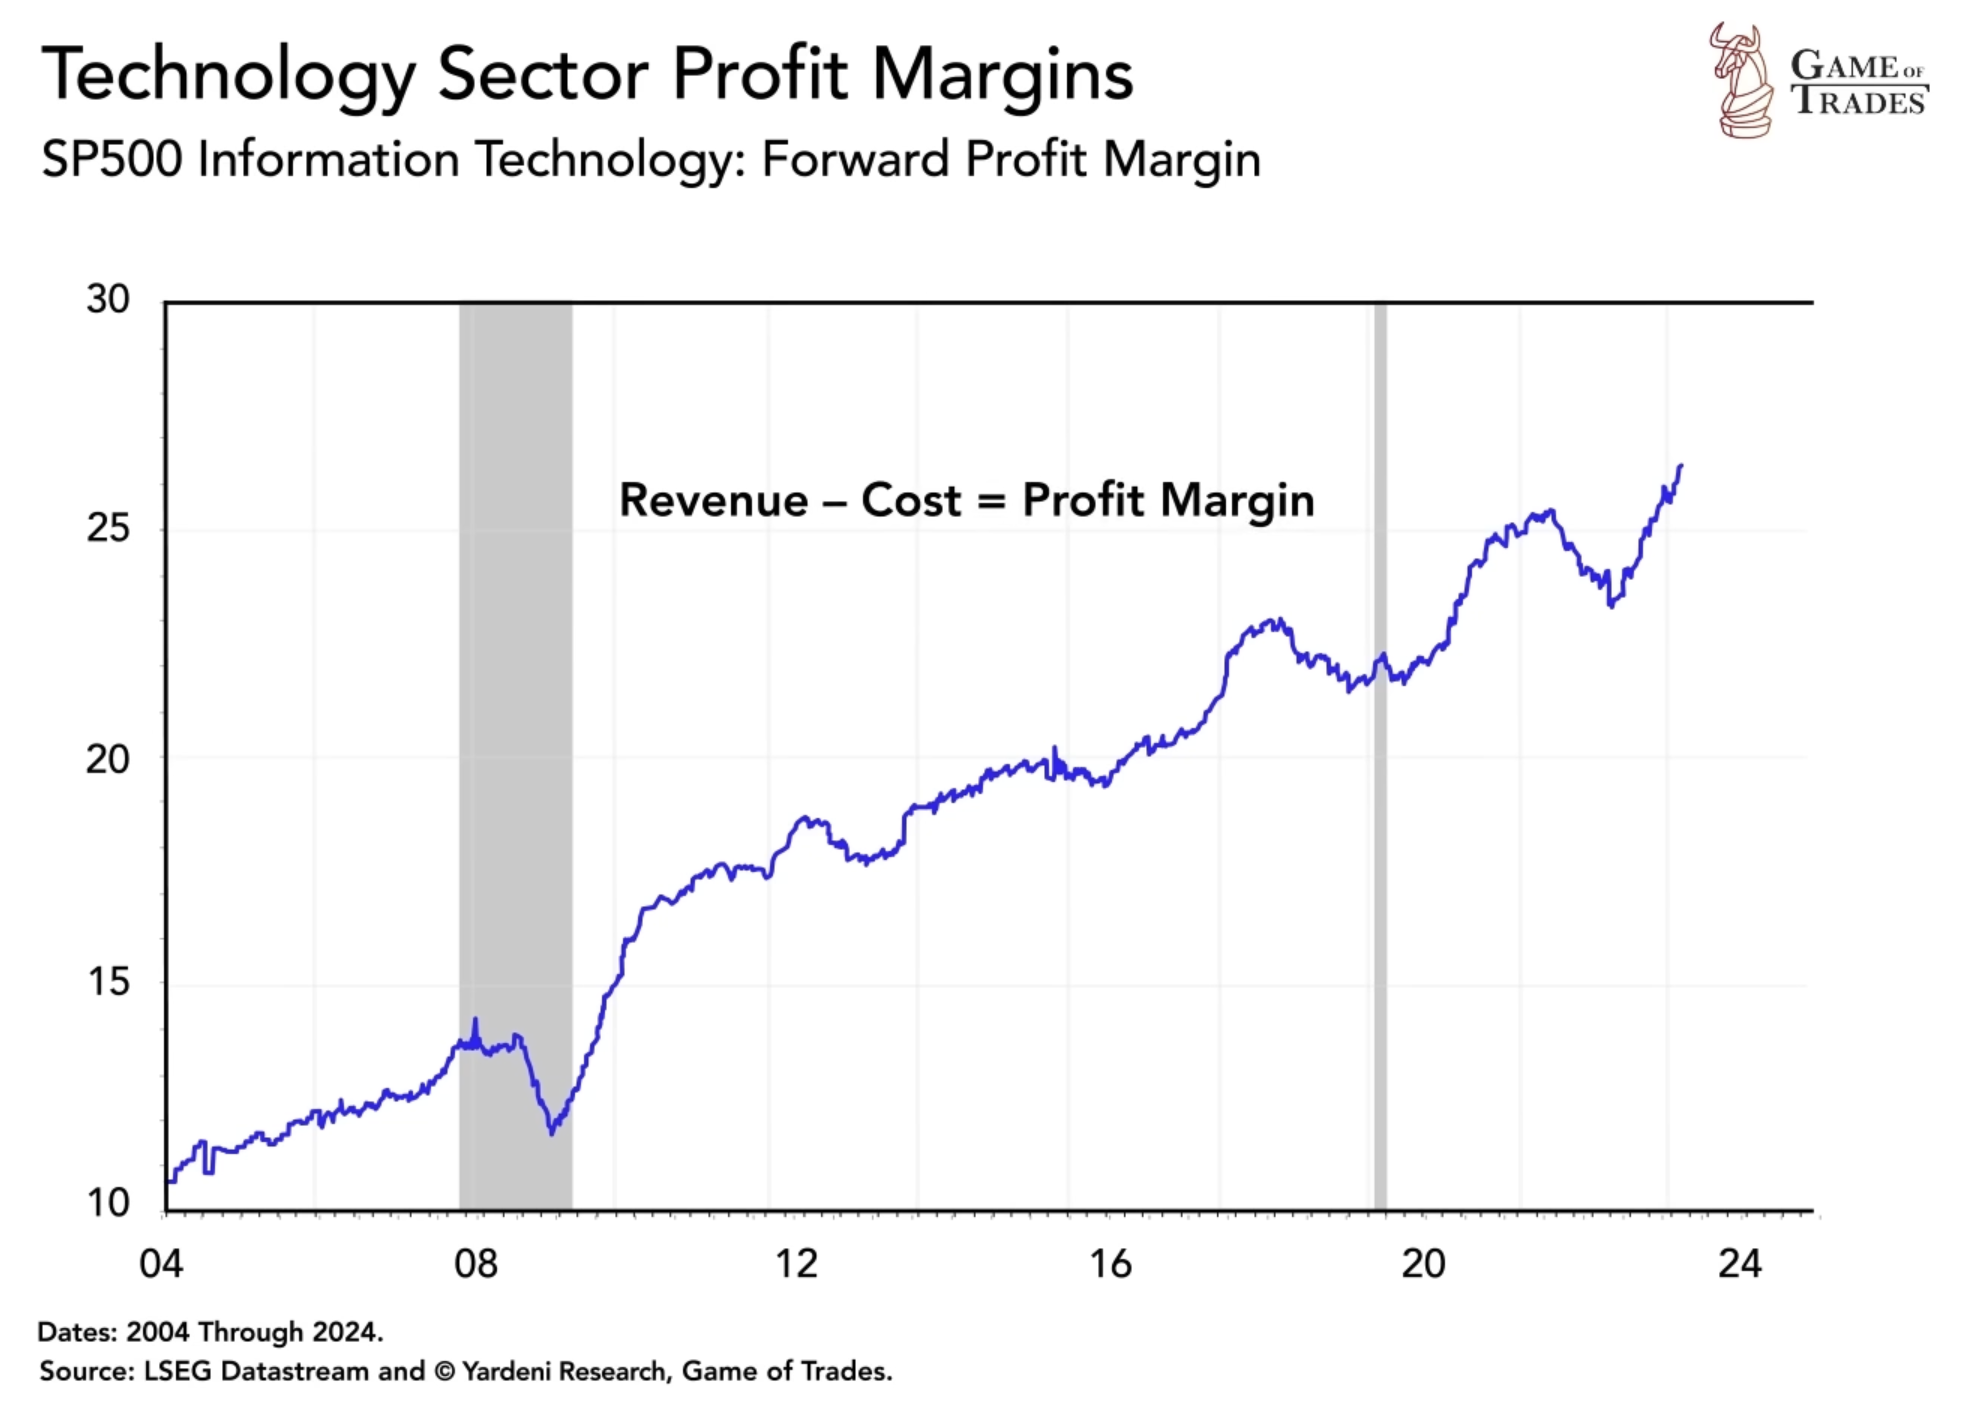
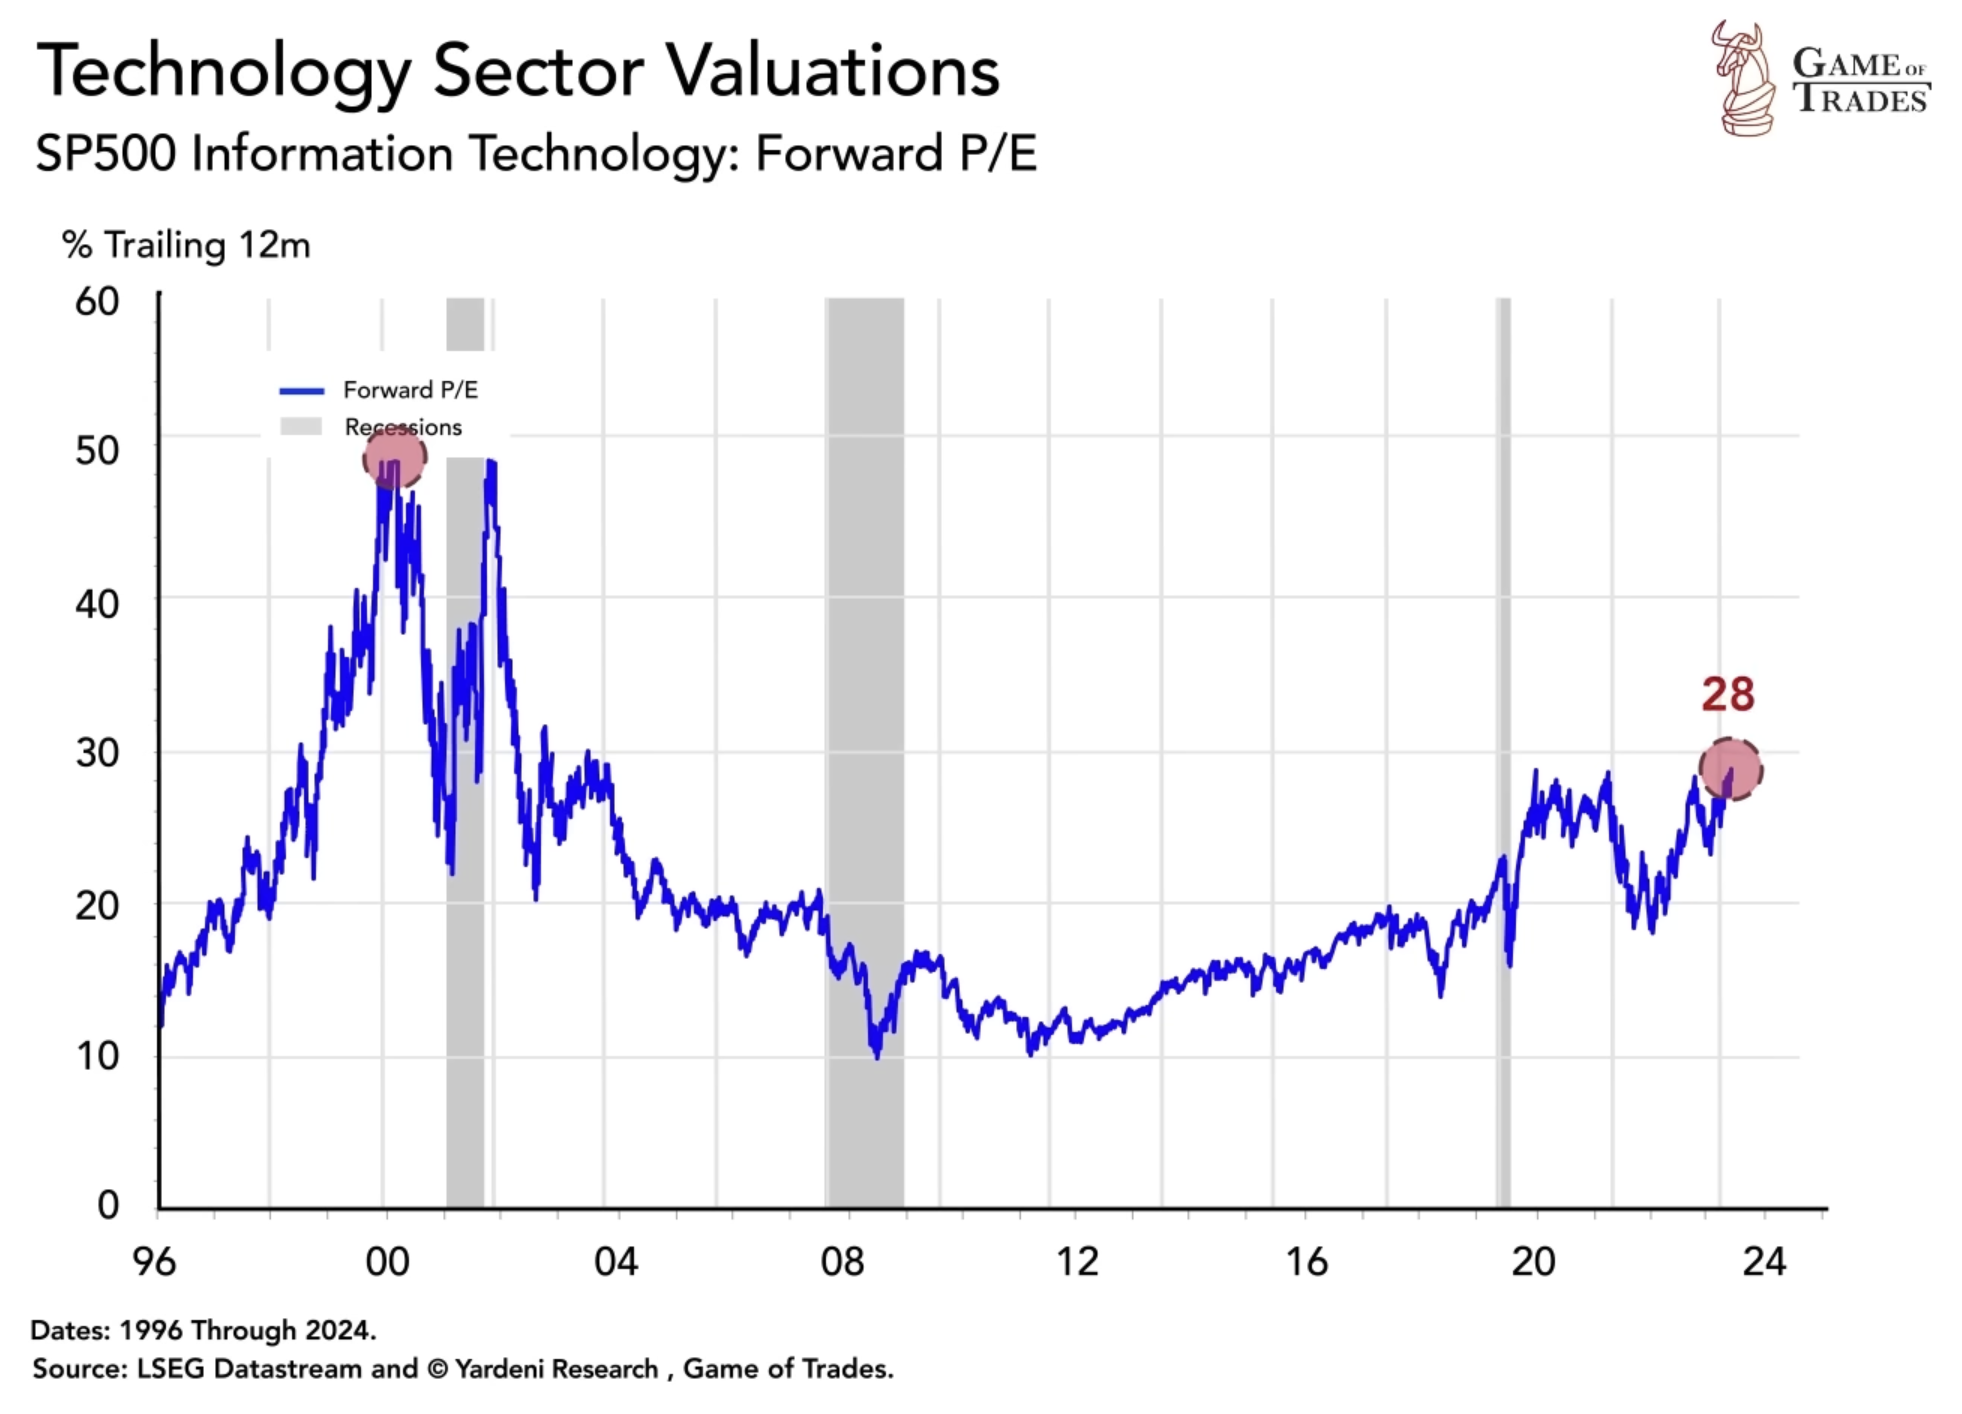
Tech stocks have experienced a significant increase in profitability, with profit margins currently averaging 26%, more than double the levels seen in 2004. This enhanced profitability reflects the maturation and evolution of the tech industry, contributing to the high valuations observed in the market today. The increased profitability of tech companies provides a fundamental basis for their valuations, differentiating the current market from the speculative excesses of the dot-com era.
Technology stocks today have a PE ratio of 28, which is relatively high compared to the past 20 years. However, it is essential to note that this ratio is significantly lower than the peak of the dot-com era in 1999 when PE ratios reached 50. Moreover, considering that technology companies are now twice as profitable as they were in 2004, it is logical for their valuations to be higher. This fundamental improvement in earnings justifies the high valuations in the current market environment.
Valuation Disparity: Small Cap vs. Large Cap Stocks
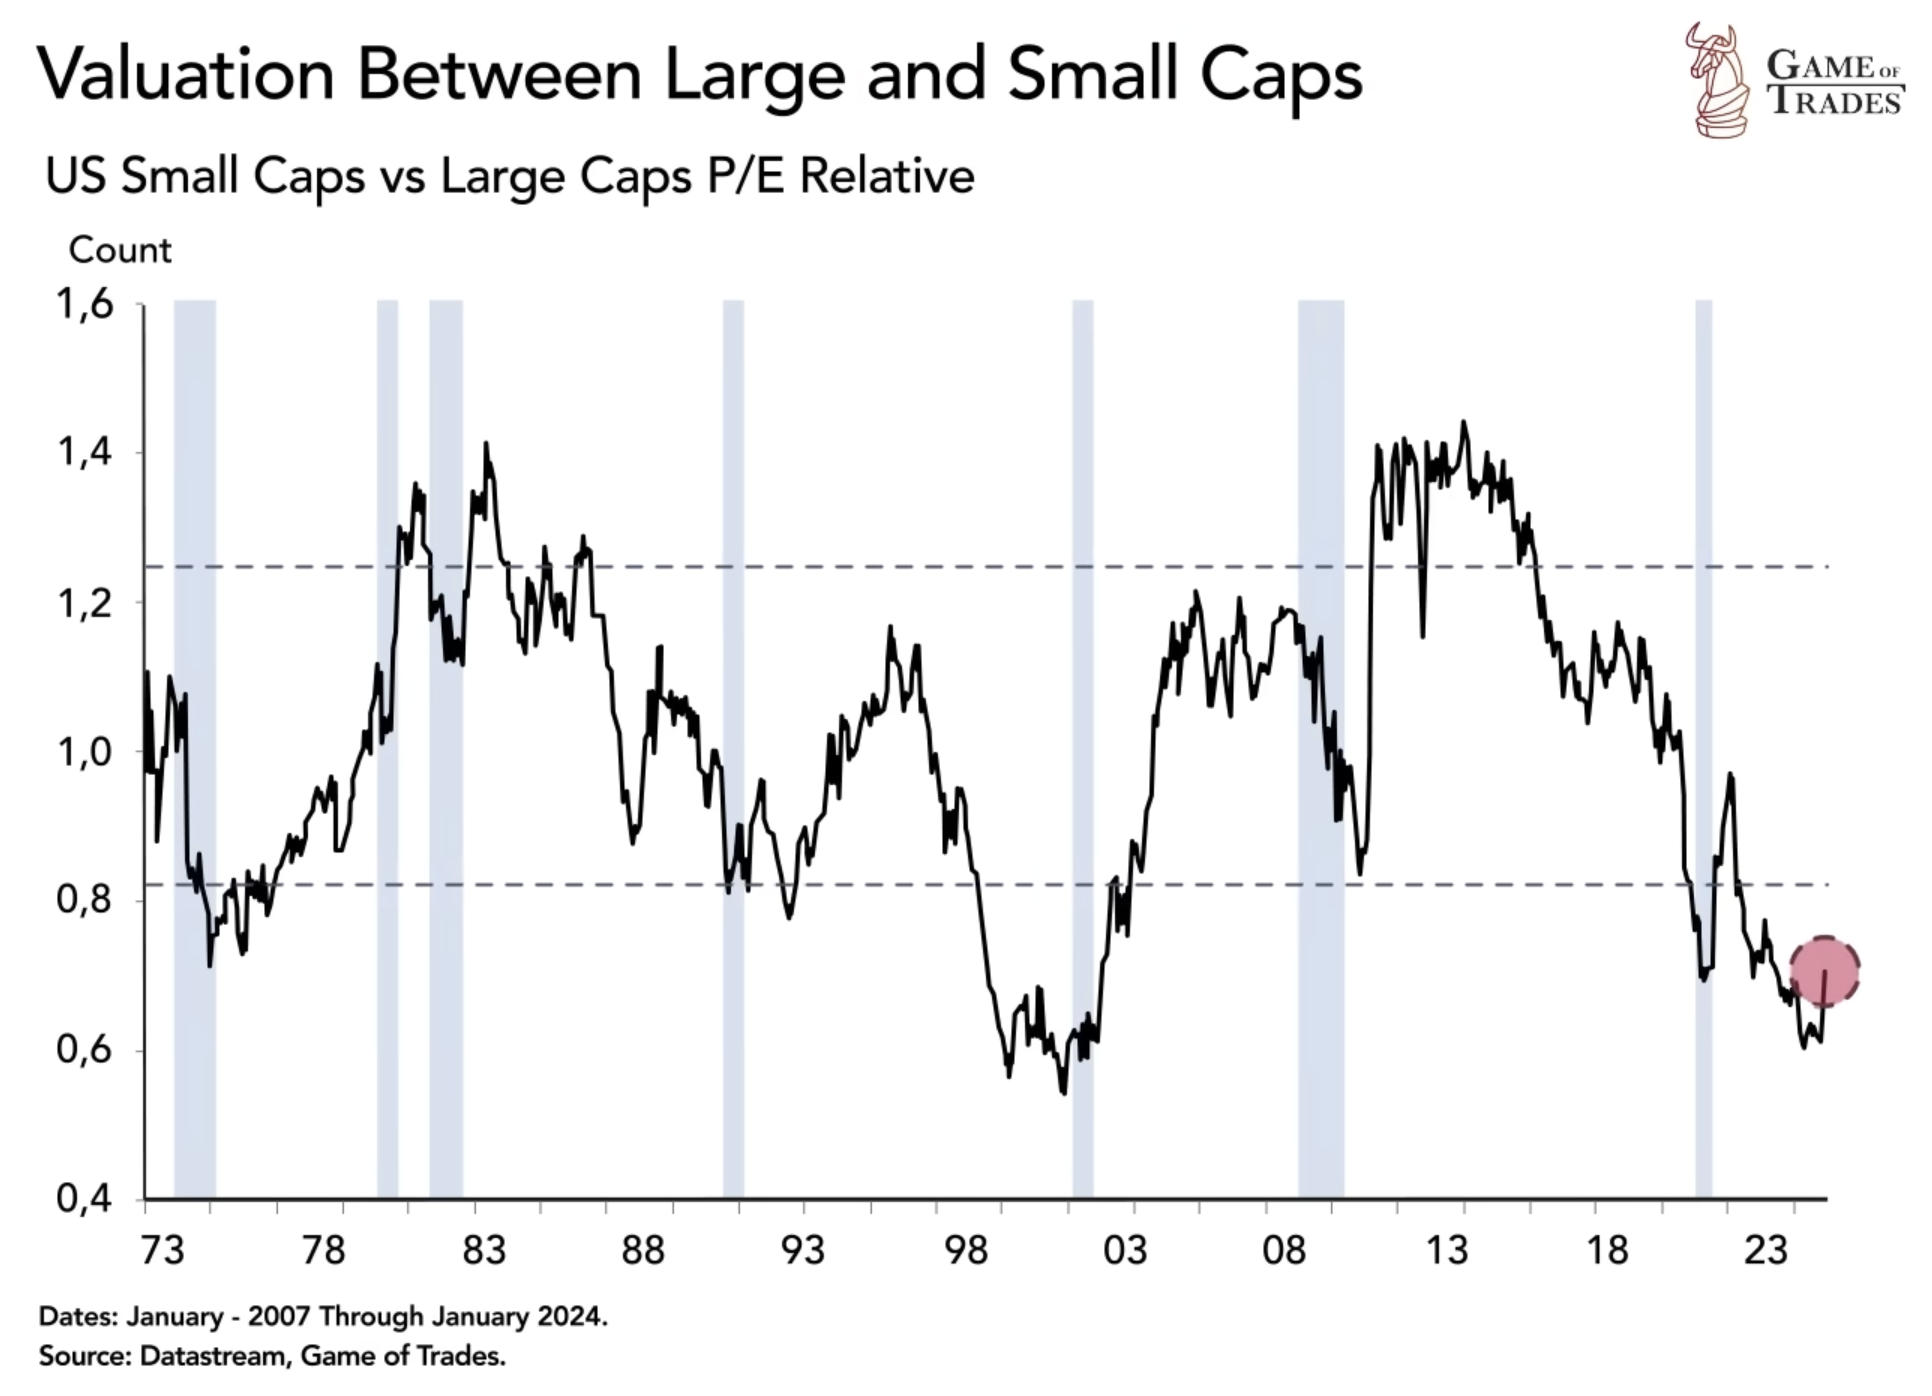
While much attention is focused on the performance of large-cap tech stocks, it is worth noting the current valuation disparity between small-cap and large-cap stocks. Small caps are currently trading at historically low levels, similar to 1999, indicating favorable pricing when compared to their average valuation. This discrepancy presents potential opportunities for investors looking to gain exposure to smaller companies with growth potential. Historically, such valuation gaps have often led to a catch-up rally in small-cap stocks, as seen before the 2001 recession.
The Divergence of Russell 2000 and S&P 500
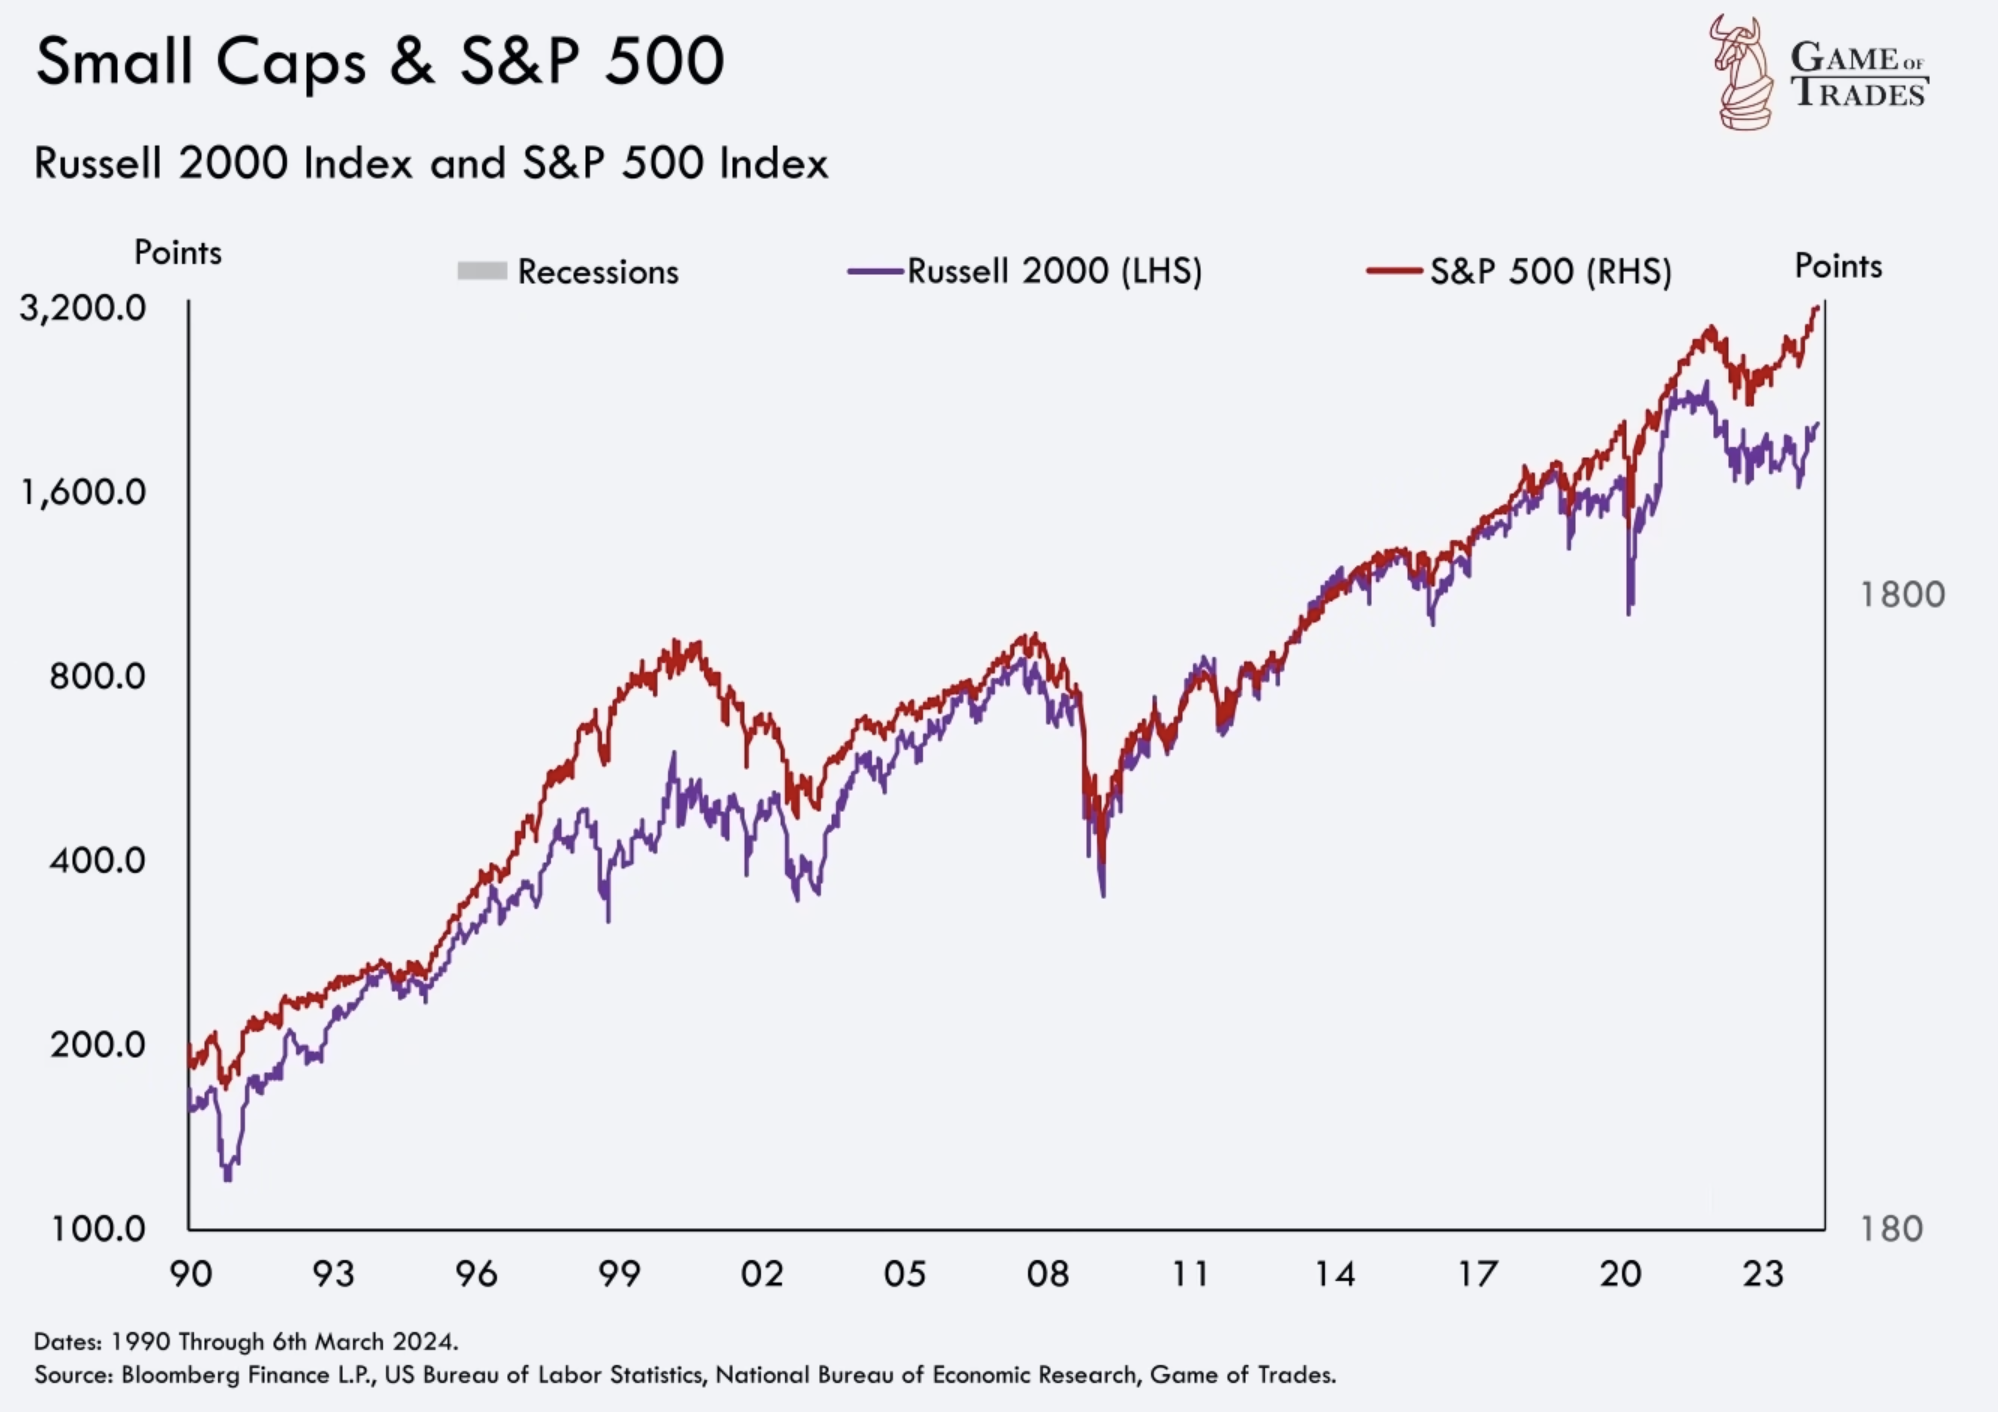
Another sign of the current market landscape is the divergence between the Russell 2000 small-cap index and the S&P 500. While the S&P 500 continues to trade higher than its previous all-time high (ATH), the Russell 2000 remains far below its ATH. This situation occurred previously in 1999 before small caps experienced a remarkable melt-up, catching up to the market just before the onset of the 2001 recession. While short-term upside moves are possible, caution should be exercised regarding another secular bull run.
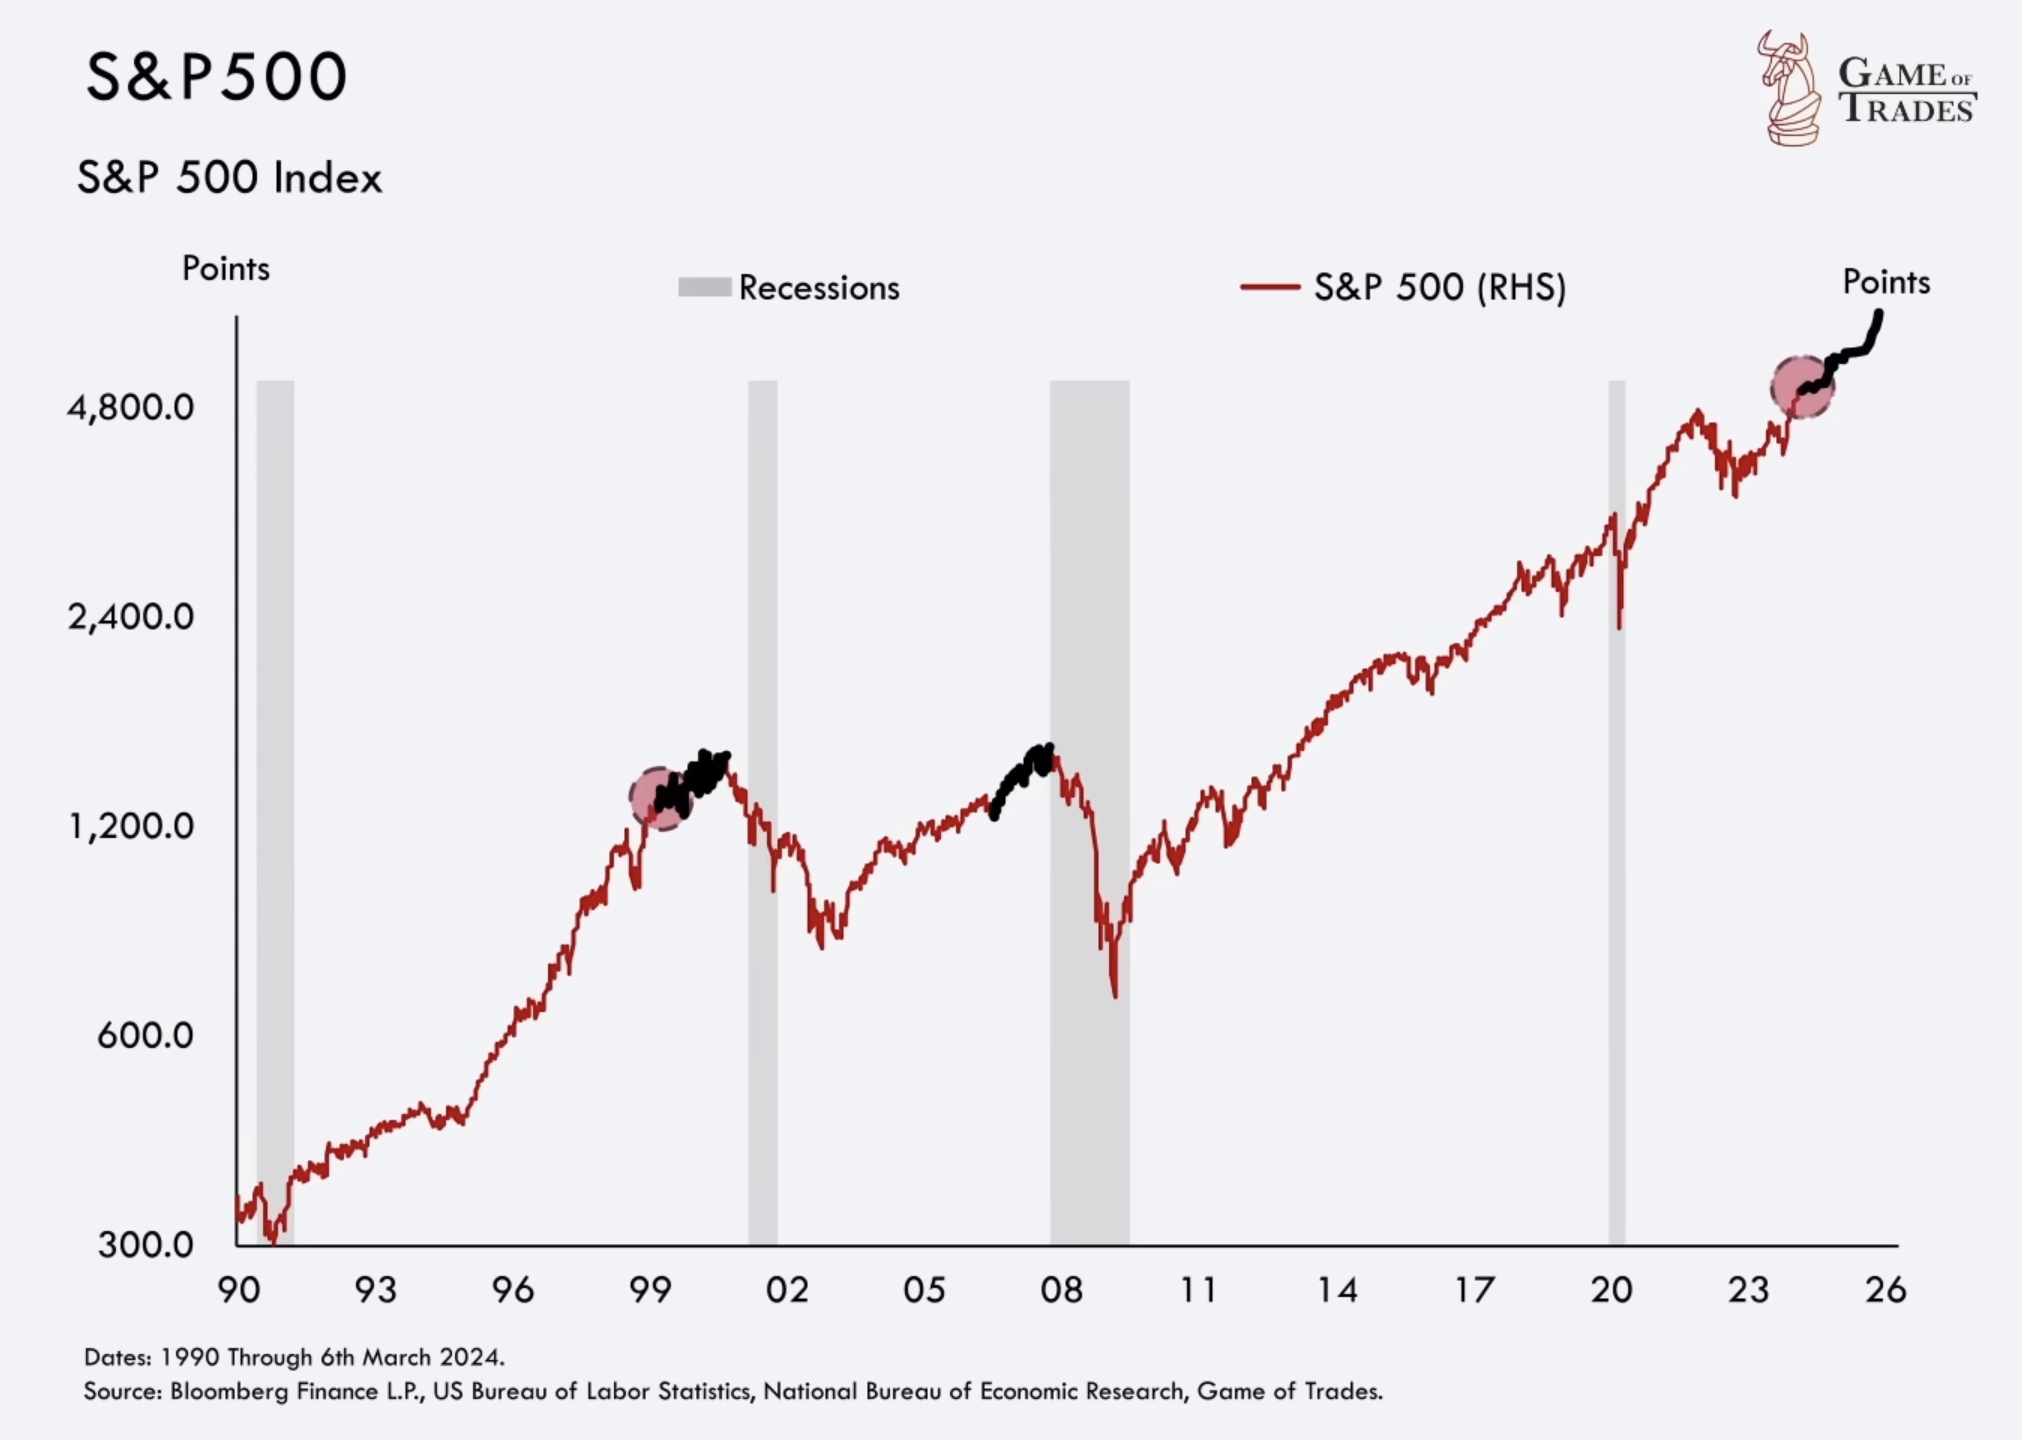
Yield Curve and Resilient Stock Market
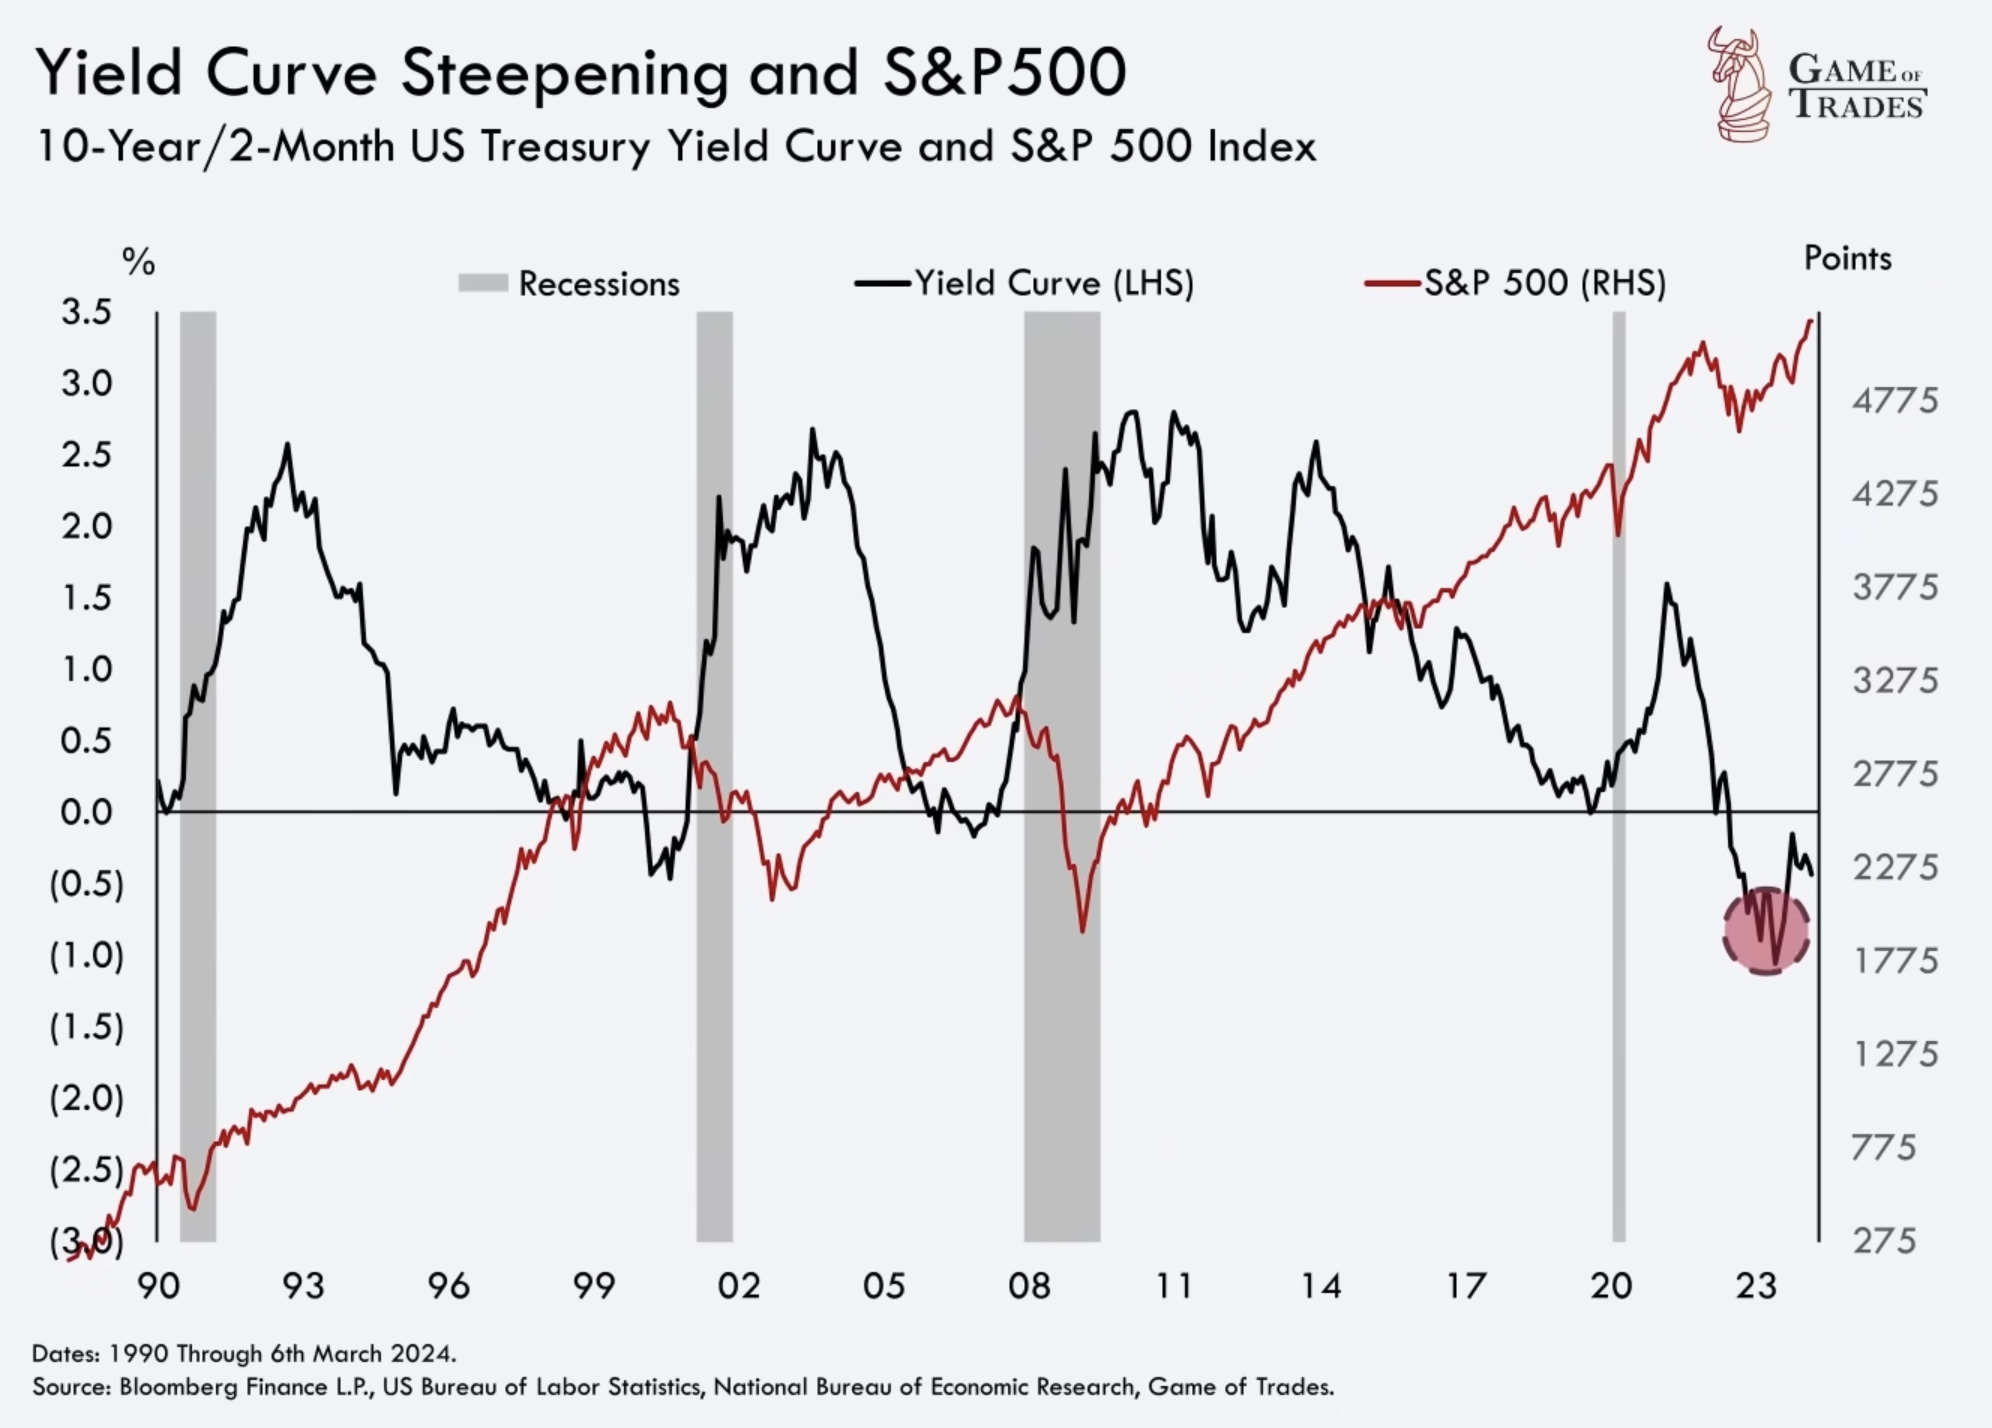
In 1999, an inverted yield curve signaled an upcoming recession, yet the stock market, as represented by the S&P 500, continued to reach new highs. This mirrors the current situation, where an inverted yield curve indicates a future recession, but the stock market remains resilient and robust for now.
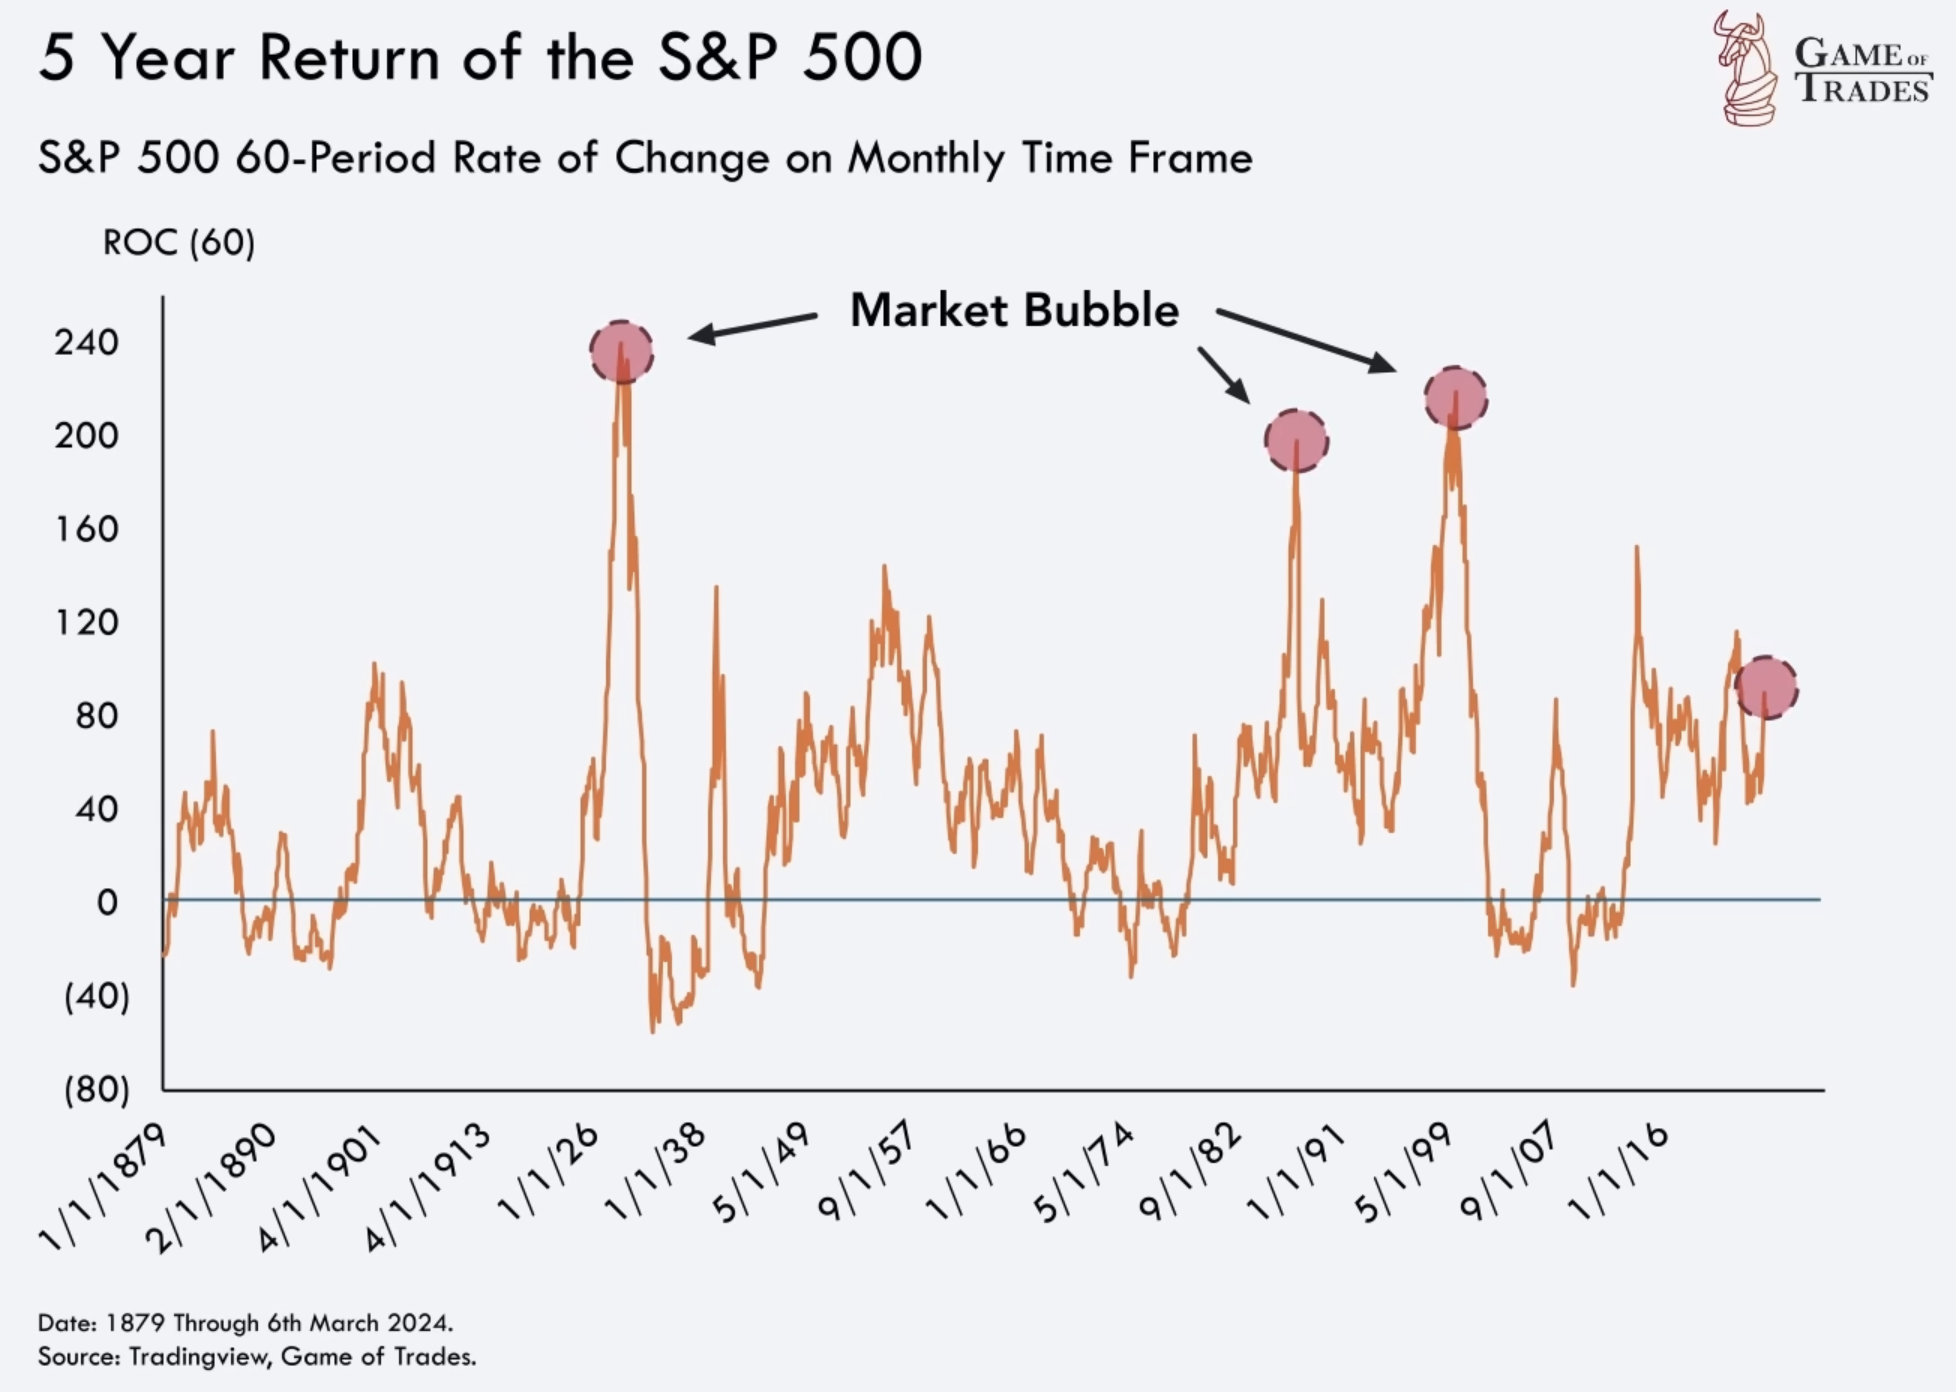
The S&P 500’s current 5-year return stands at around 79%, which is not spectacular but still respectable. In comparison, historical market bubbles in 1999, 1987, and 1929 experienced extraordinary returns of around 200% before steep corrections. The current market is not as overextended as those instances, suggesting a more stable growth trajectory.
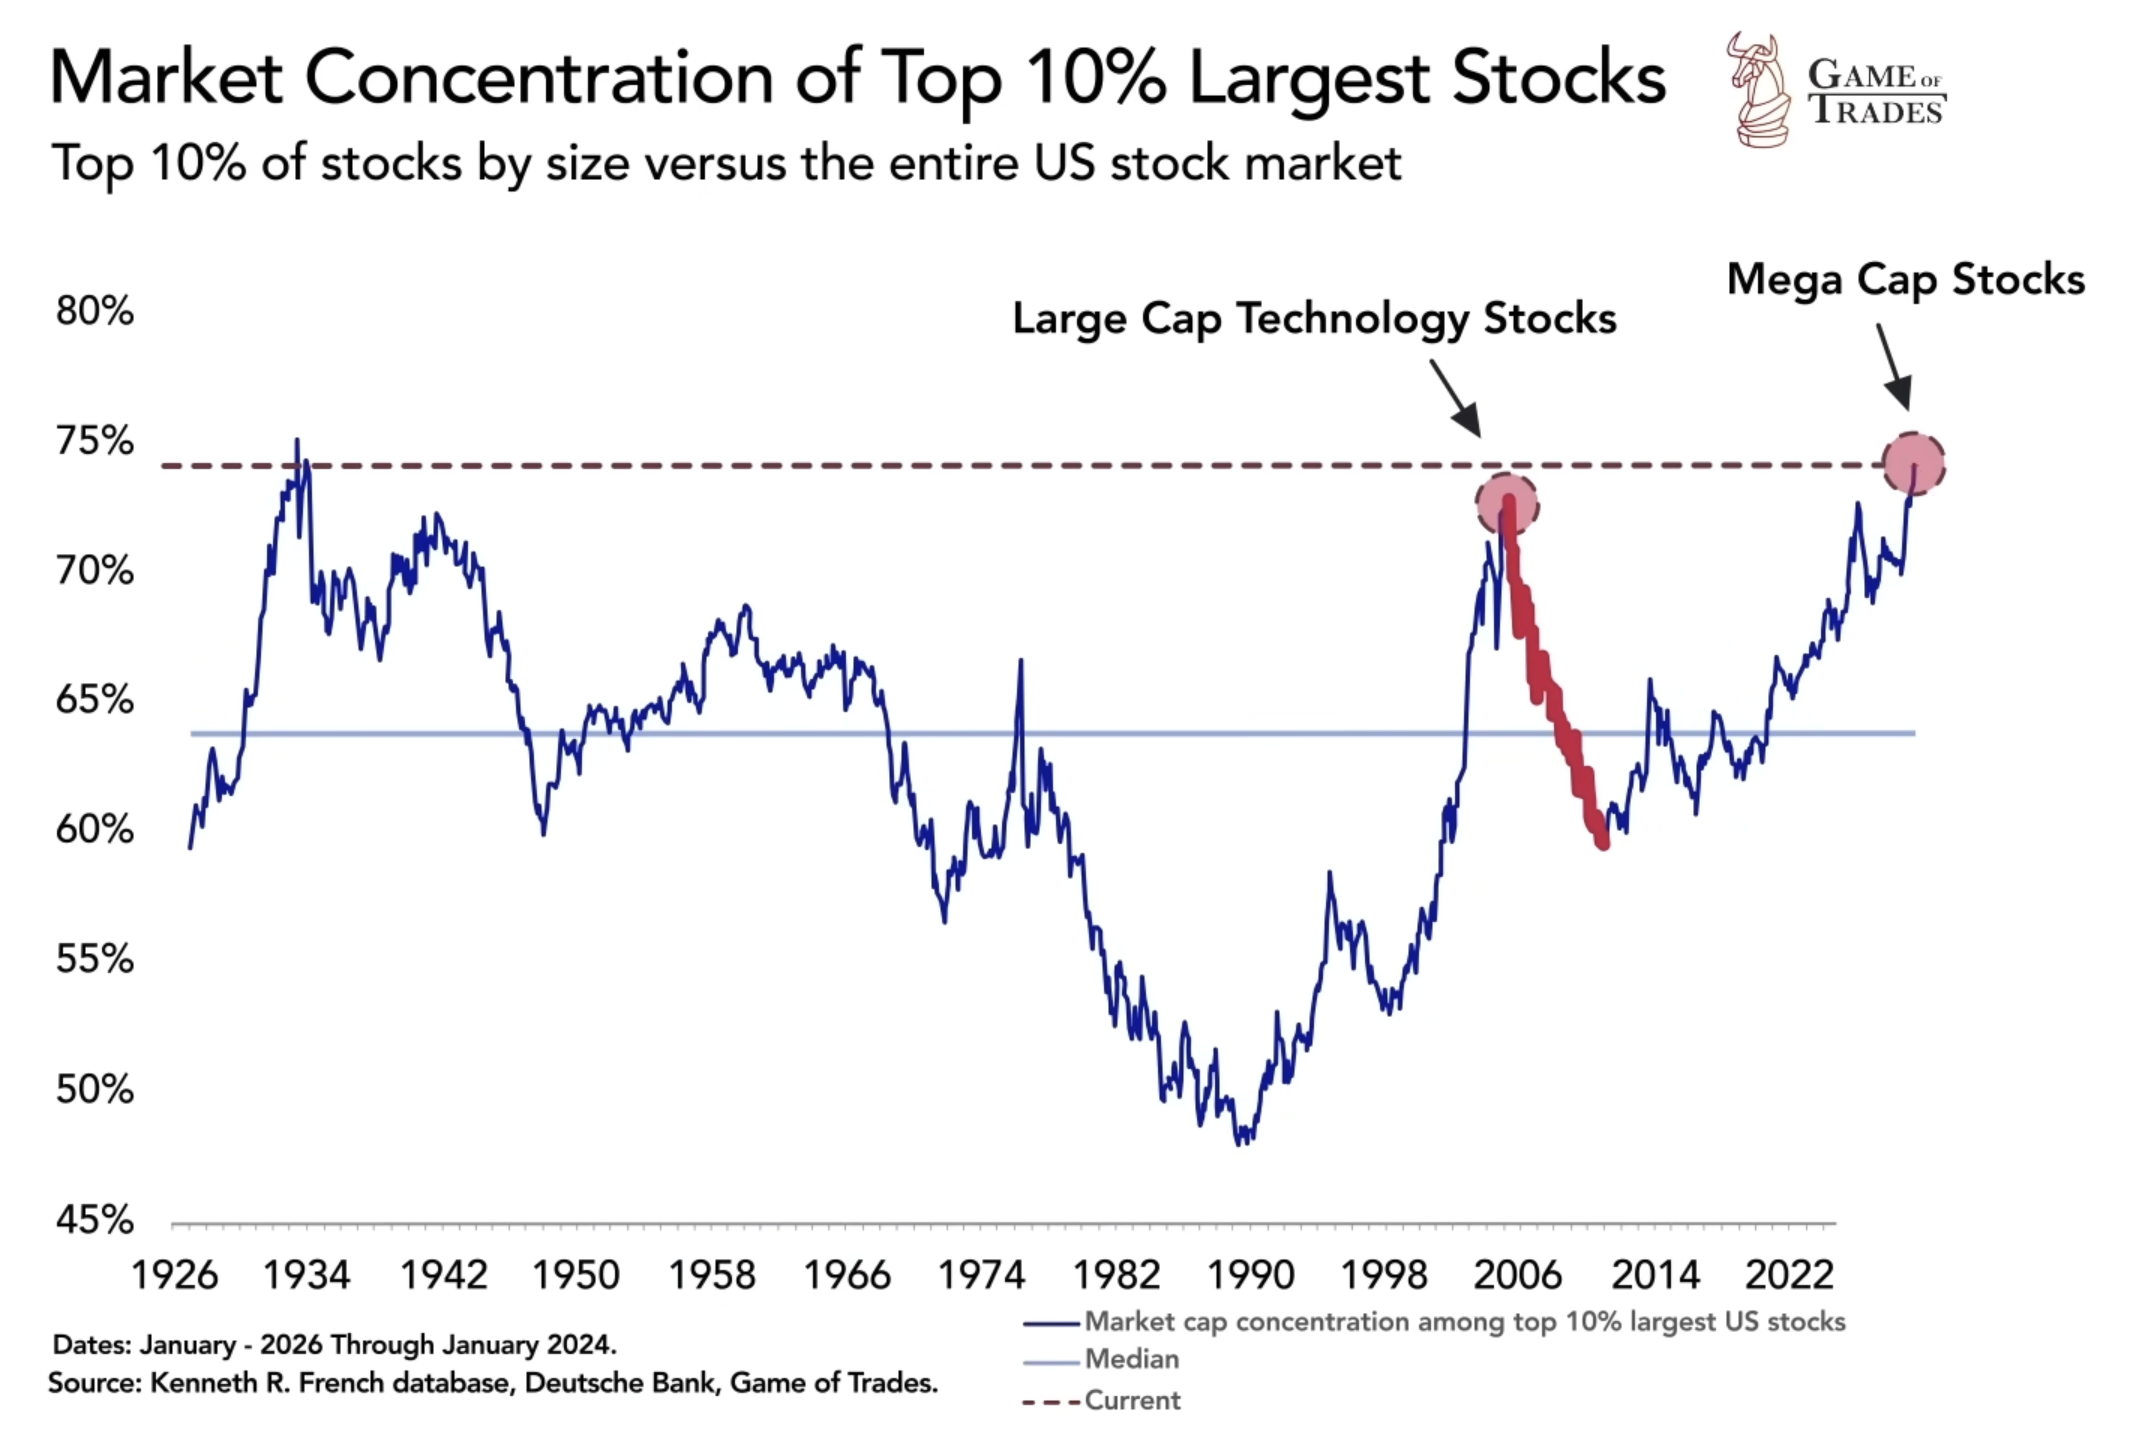
The Magnificent 8 and Market Concentration
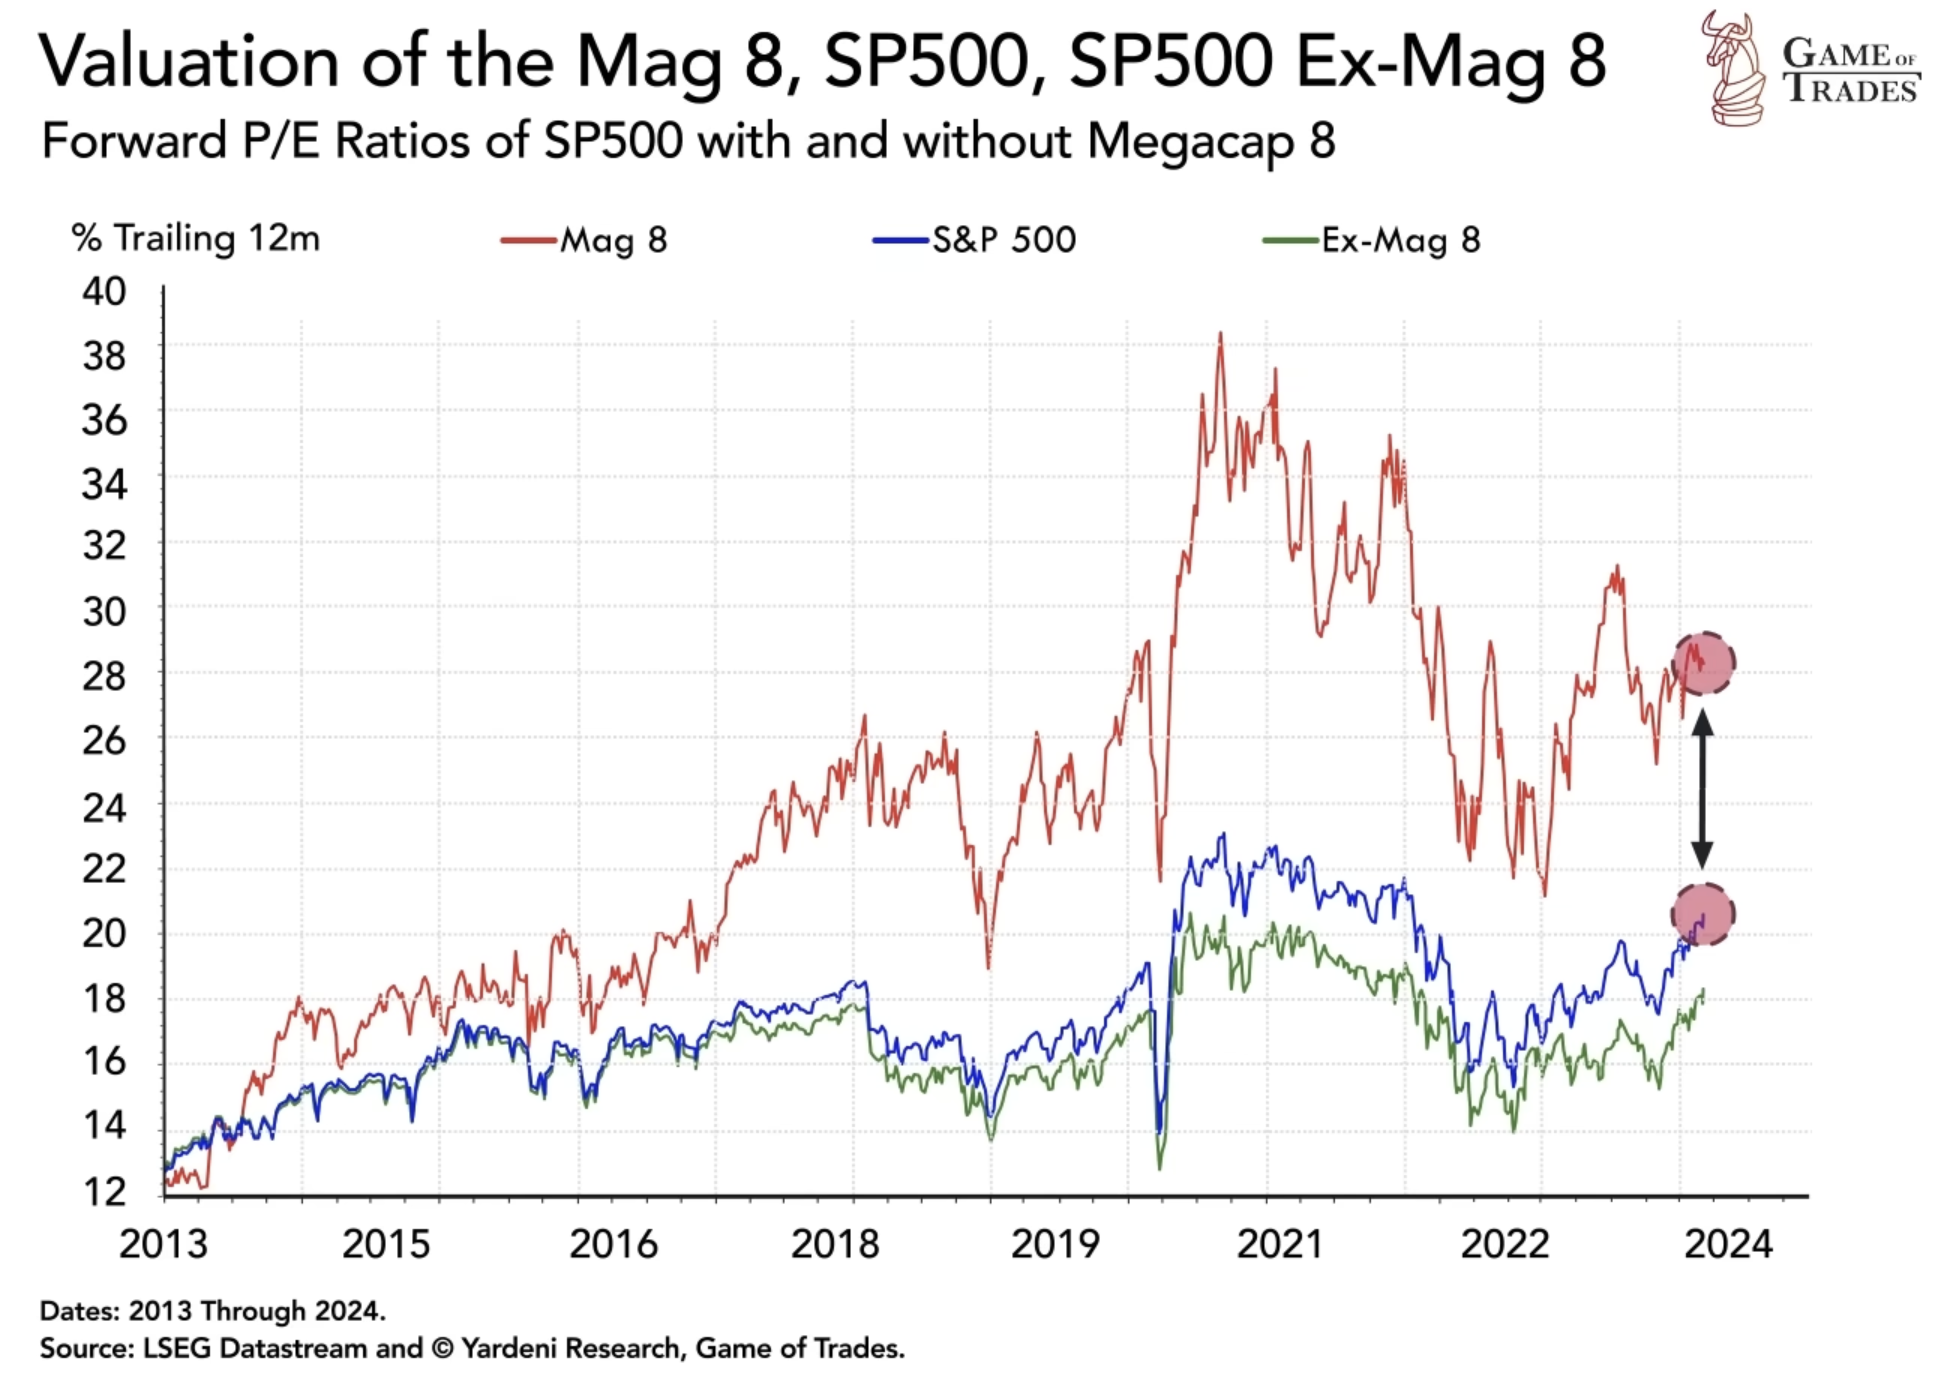
The Magnificent 8, comprising Google, Amazon, Apple, Meta, Microsoft, Netflix, Nvidia, and Tesla, have an average PE ratio of 28, higher than the rest of the market at 20. Over the past decade, the Mag 8’s average PE ratio has doubled from 13 in 2012. This concentration of mega-cap stocks represents a substantial portion of the US stock market.
The concentration of mega-cap stocks in the current market is reminiscent of the dot-com era in 1999 when a few large-cap tech stocks dominated the market. However, there is one significant difference. The market’s vulnerability to concentration risks is acknowledged, but the current market environment lacks the same level of euphoria seen during the dot-com mania.
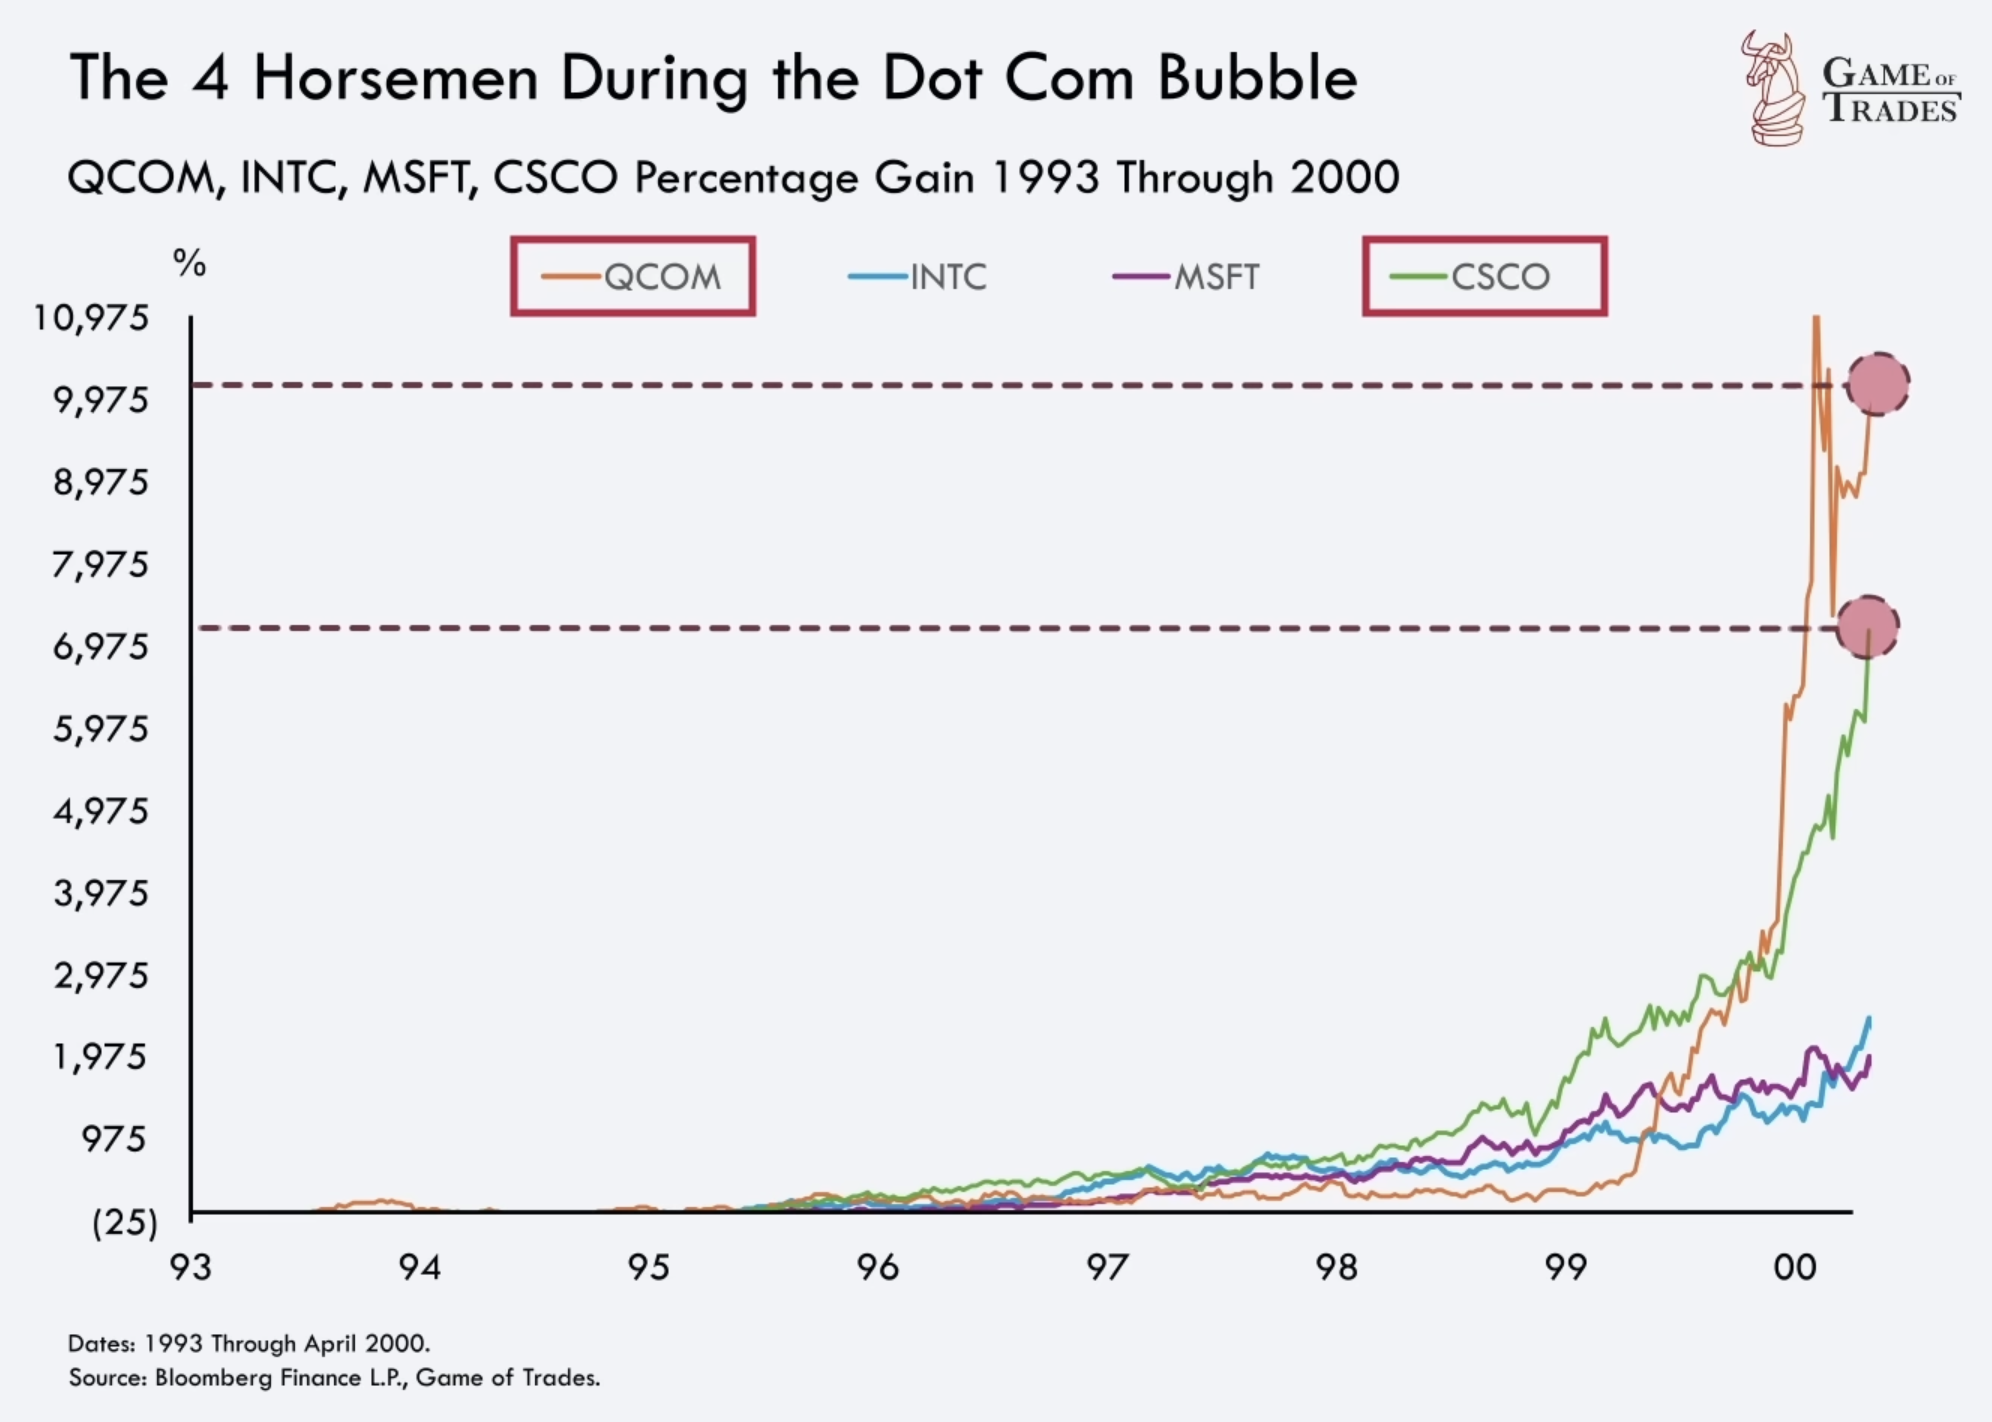
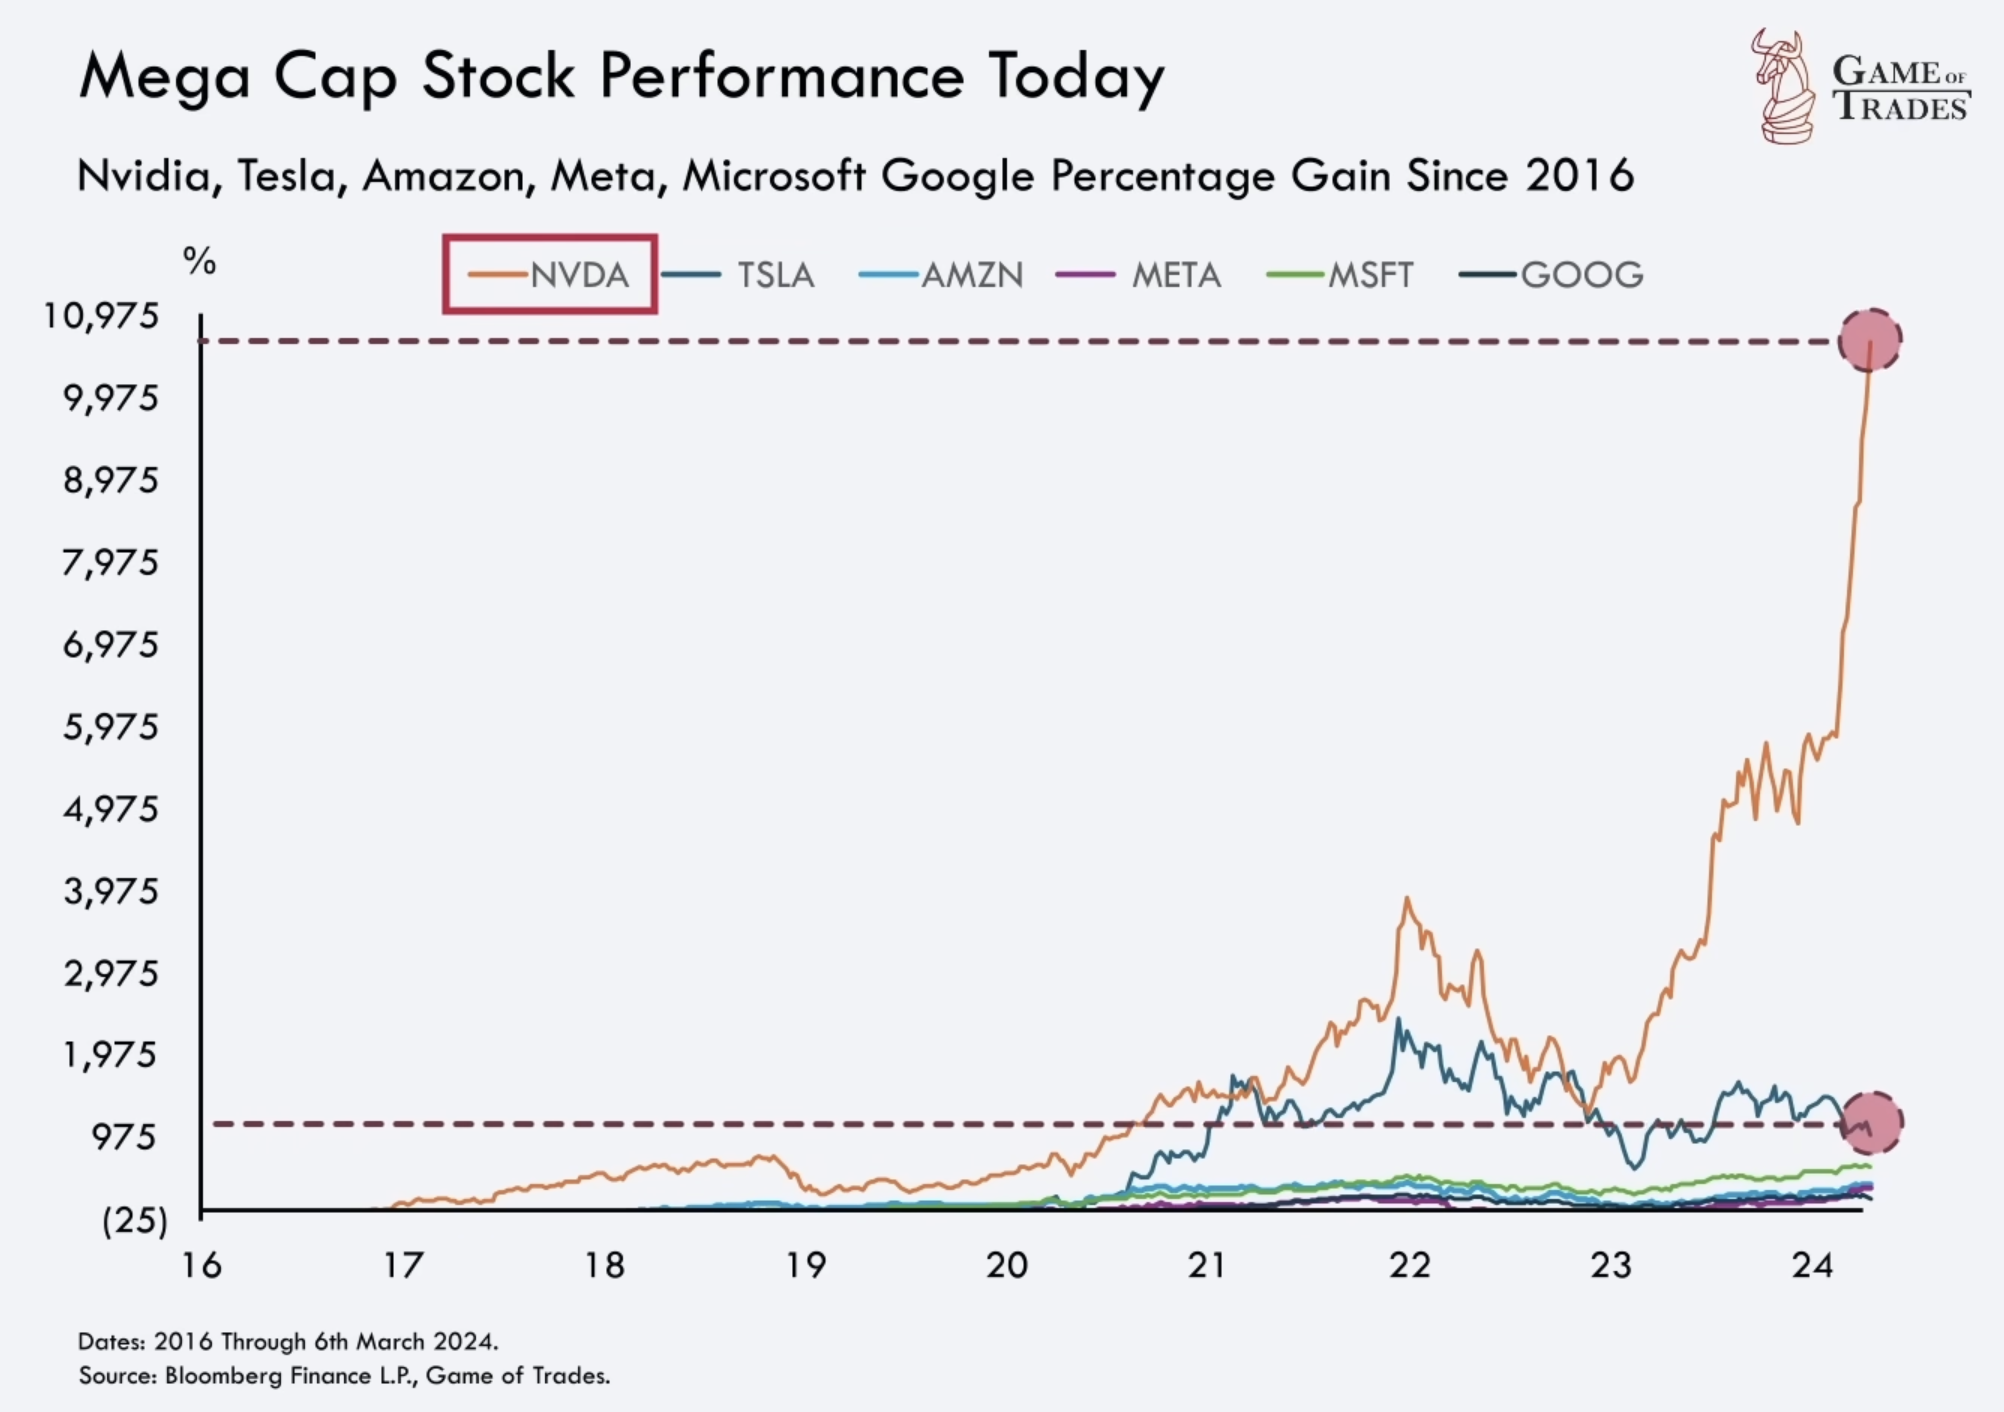
During the dot-com era, the “Four Horsemen” – Intel, Microsoft, Cisco, and Qualcomm – achieved exceptional returns. Intel and Microsoft soared nearly 1,000% in 7 years, while Cisco and Qualcomm saw astonishing gains of 7,000% and 9,000% respectively.
Comparing the returns of current mega-cap stocks over the past 8 years, we observe that Amazon, Meta, Microsoft, and Google have returned between approximately 300% to 600%. While these returns are significant, they are noticeably less compared to the large-cap tech stocks’ performance during the 1999 mania. Among the current stocks, Tesla stands out with a remarkable 1,000% increase, while Nvidia has experienced a staggering 10,000% increase.
Euphoria Levels and Market Outlook
The current market lacks the euphoria witnessed during the peak of the dot-com bubble in 1999/2000. The ongoing rally in the market could continue, as even the successful Magnificent 8 have not yielded similar returns to the top tech stocks during the 1999 mania. However, it is crucial to acknowledge that we may be in the later stages of the business cycle, akin to the late 1990s, where euphoria tends to rise and peak, signaling the nearing end of the cycle.
Conclusion
As we assess the current market environment, it becomes evident that while some similarities to the dot-com era exist, significant differences prevail. The tech sector’s improved profitability, more reasonable valuations, and the presence of undervalued small-cap stocks contribute to a different market dynamic. While caution is warranted in the later stages of the business cycle, characterized by rising euphoria, the current market does not exhibit the same level of vulnerability yet as seen in the late 1990s. Click here to get free trial for 7 days! Subscribe to our YouTube channel and Follow us on Twitter for more updates!
Read more: The Yield Curve is Not Right Yet, What Happened to the Recession?


