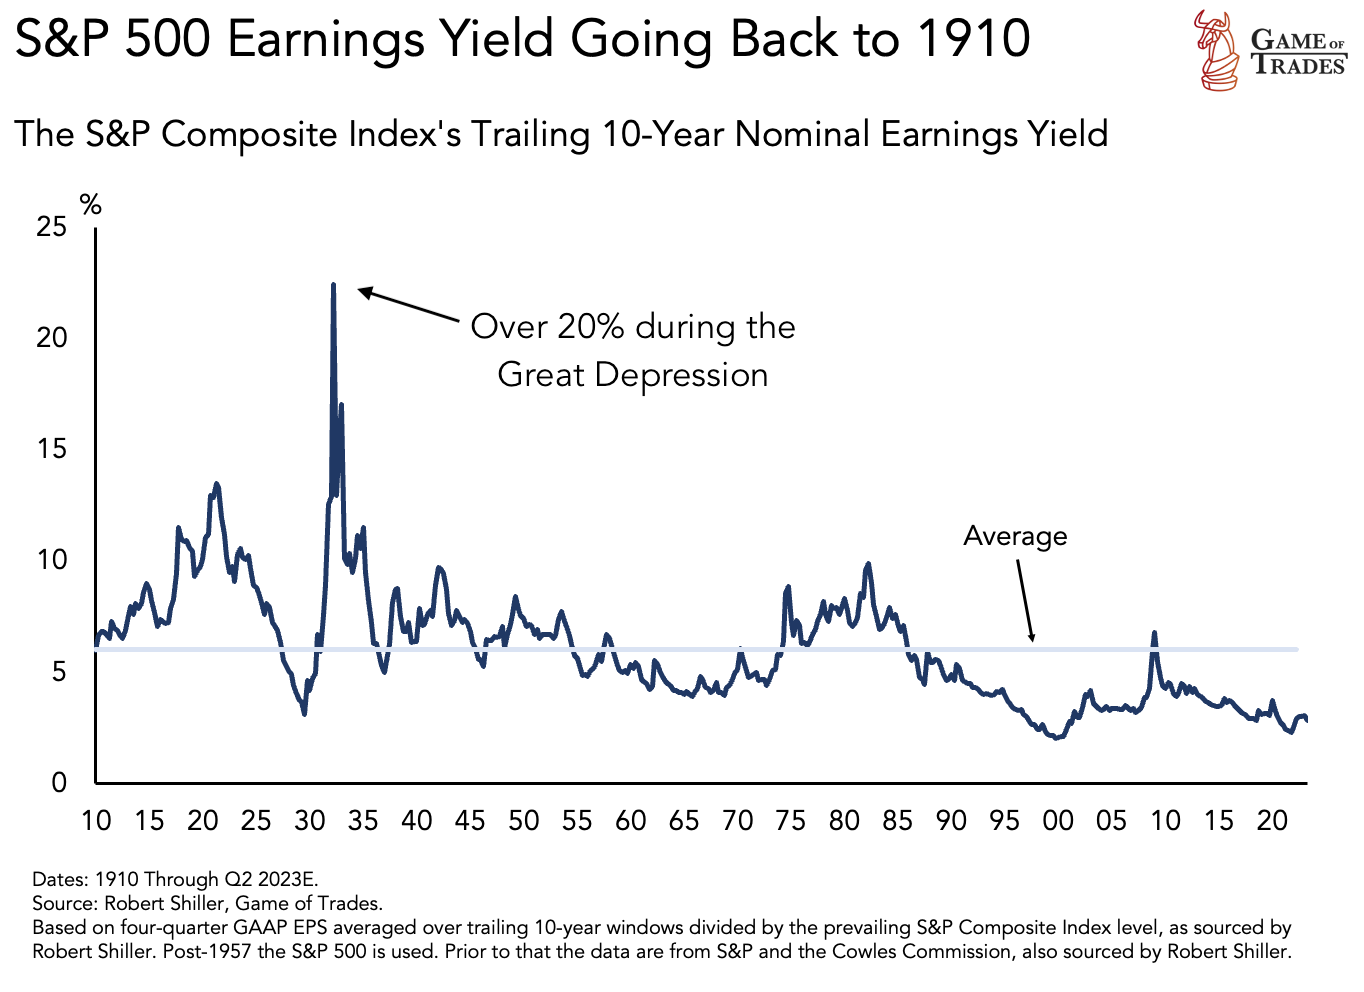
Earnings yield is a financial metric that helps investors assess the attractiveness of a stock. This ratio shows the proportion of a company’s earnings in relation to the stock’s price, typically expressed as a percentage. In plain terms, it shows how much bang for the buck you get from the earnings of the companies in which you invest.
Historical Significance of the S&P 500 Earnings Yield
Examining the S&P 500’s earnings yield since 1910 provides an interesting perspective on market trends. The market was most attractive following the Great Depression, with the S&P 500 yielding over 20%. This meant that a $100 investment in the S&P 500 in 1932 could generate an annual profit of $20 or more, making it an opportune time to purchase equities given the enticing risk-reward ratio.
The Relationship Between Earnings Yield and Short-Term Rates
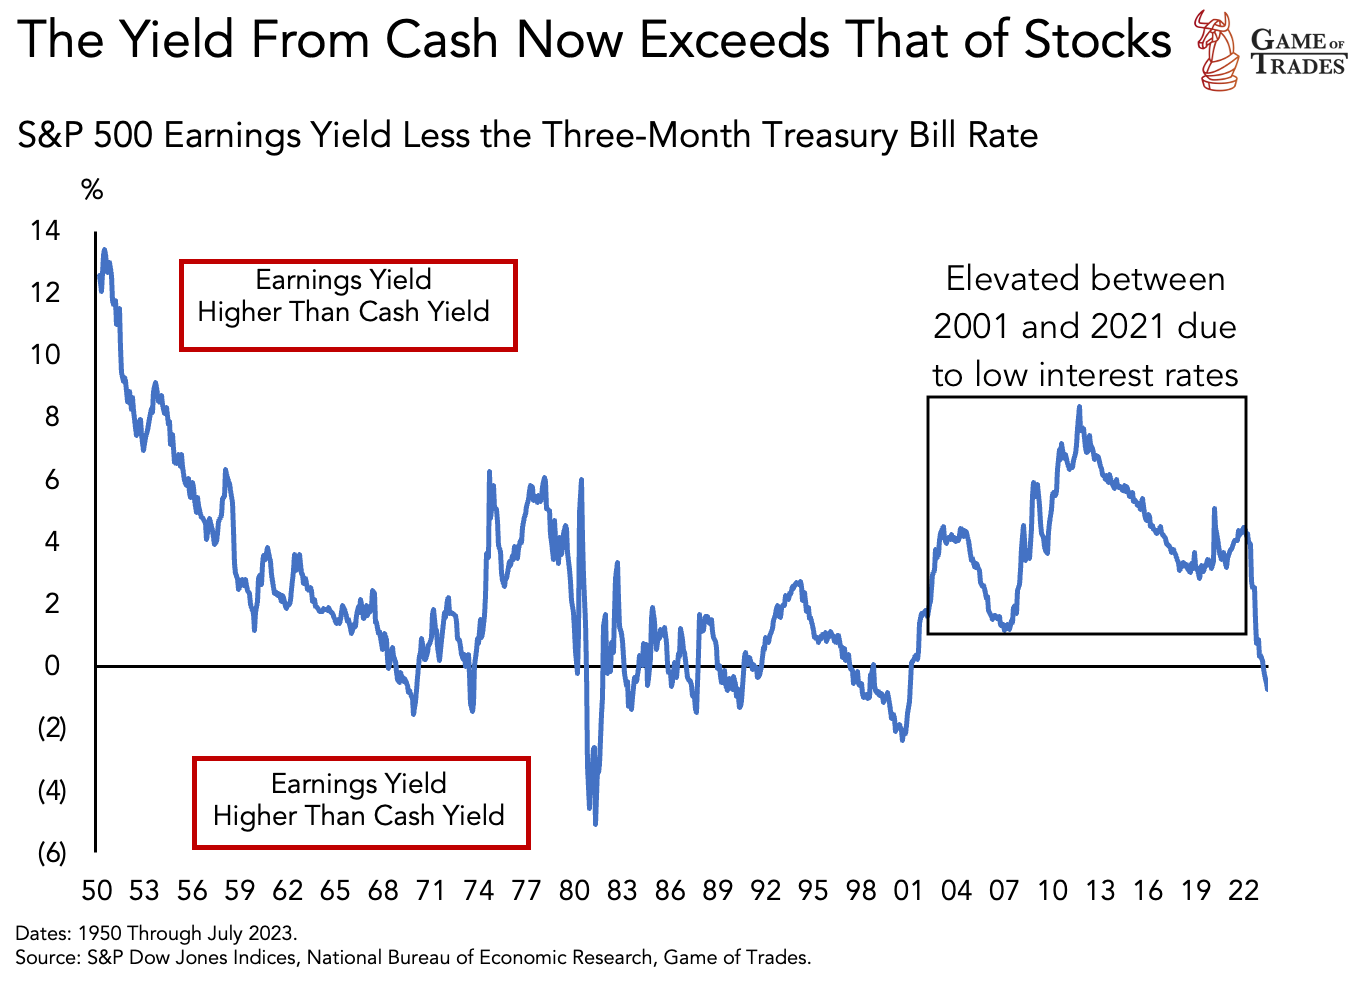
From 2001 to 2021, the earnings yield of the S&P 500 was particularly appealing relative to short-term rates. This spread was elevated due to the Fed maintaining low rates, especially after the Global Financial Crisis. Short-term rates reflect the yield investors earn from holding cash. Therefore, the low rates during this period encouraged investors to buy stocks despite high valuations, as the S&P 500’s earnings yield remained relatively high.
A Shift in the Macro Landscape
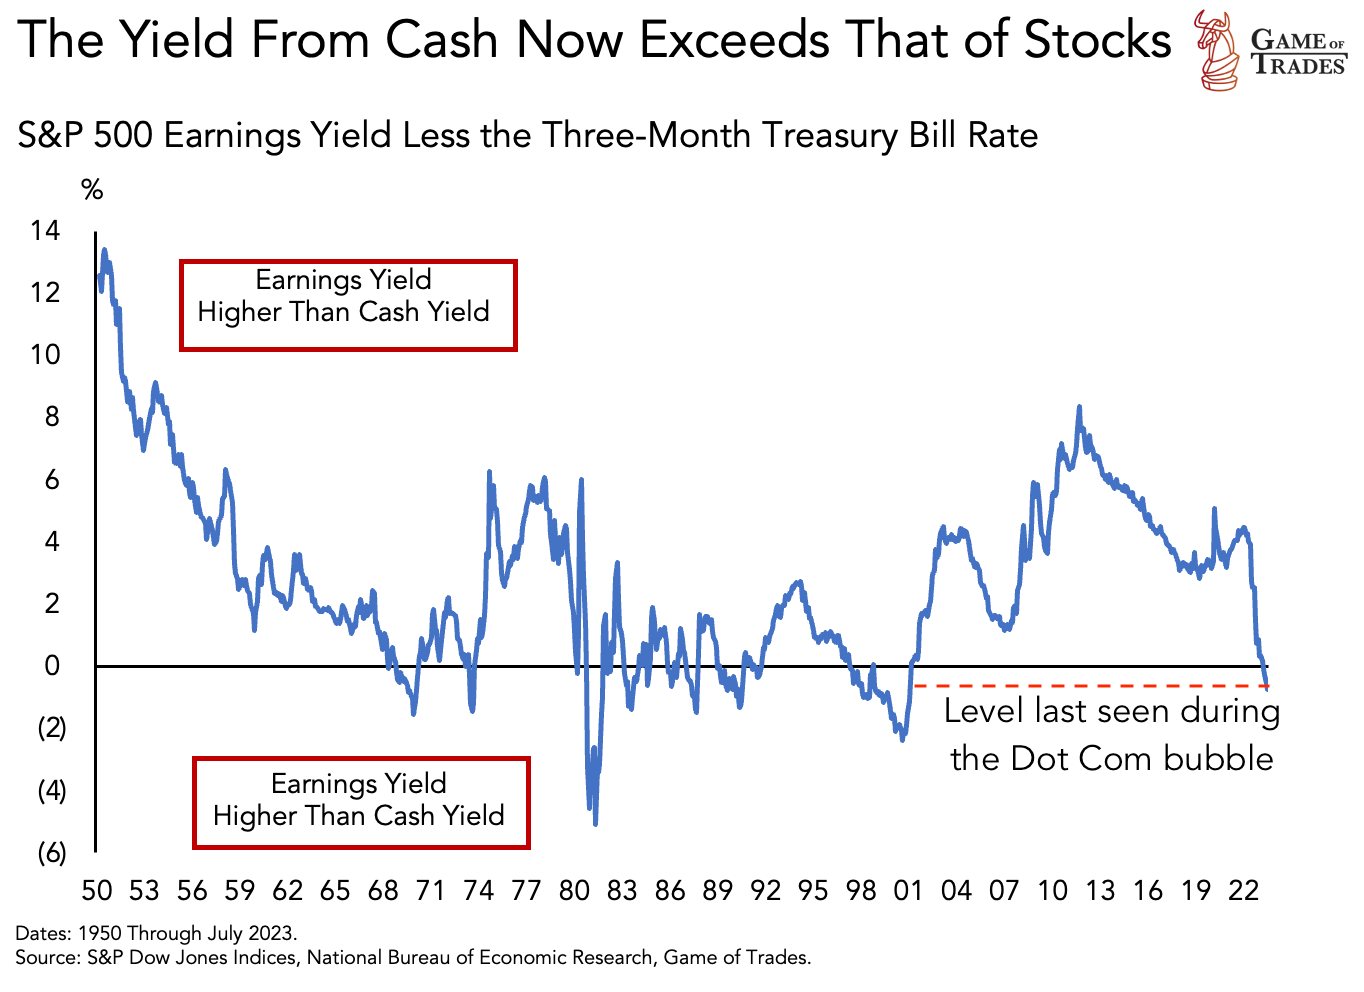
Over the past year, the Fed has raised short-term rates from 0% to above 5%, causing significant changes in the macro landscape and investment incentives. However, investors appear slow to adapt, with earnings yields at levels similar to those seen during the Dot Com bubble. This suggests that investors continue to pay high prices for minimal earnings.
The Negative Spread and Its Implications
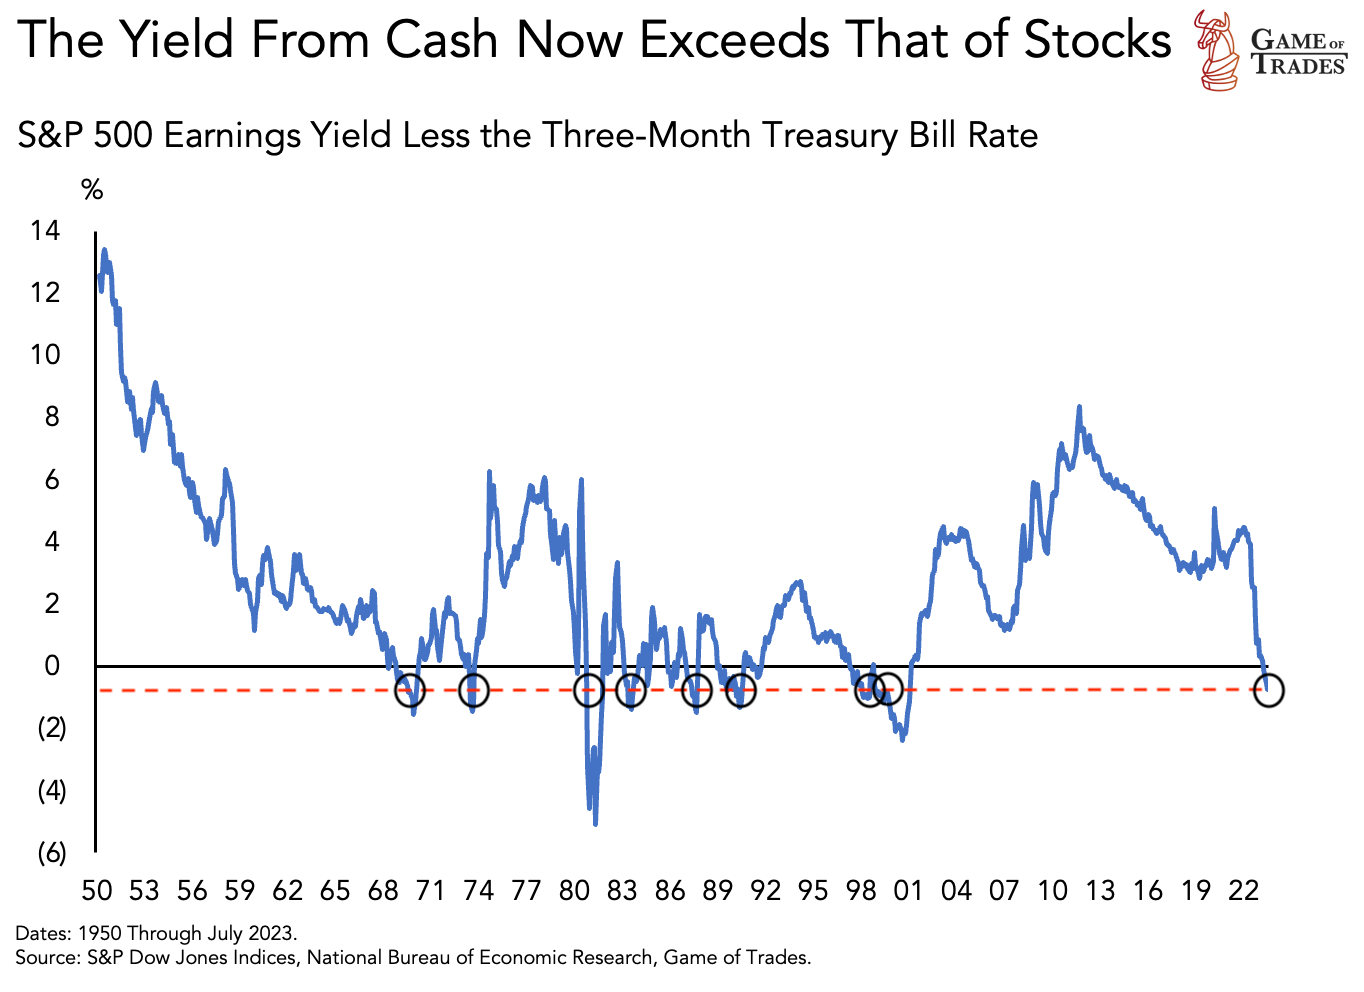
Since 1950, the spread between the S&P 500 earnings yield and the 3-month Treasury bill has turned negative 8 times. Most of these instances occurred prior to substantial drawdowns in equities, including the infamous 1929 multi-decade top.
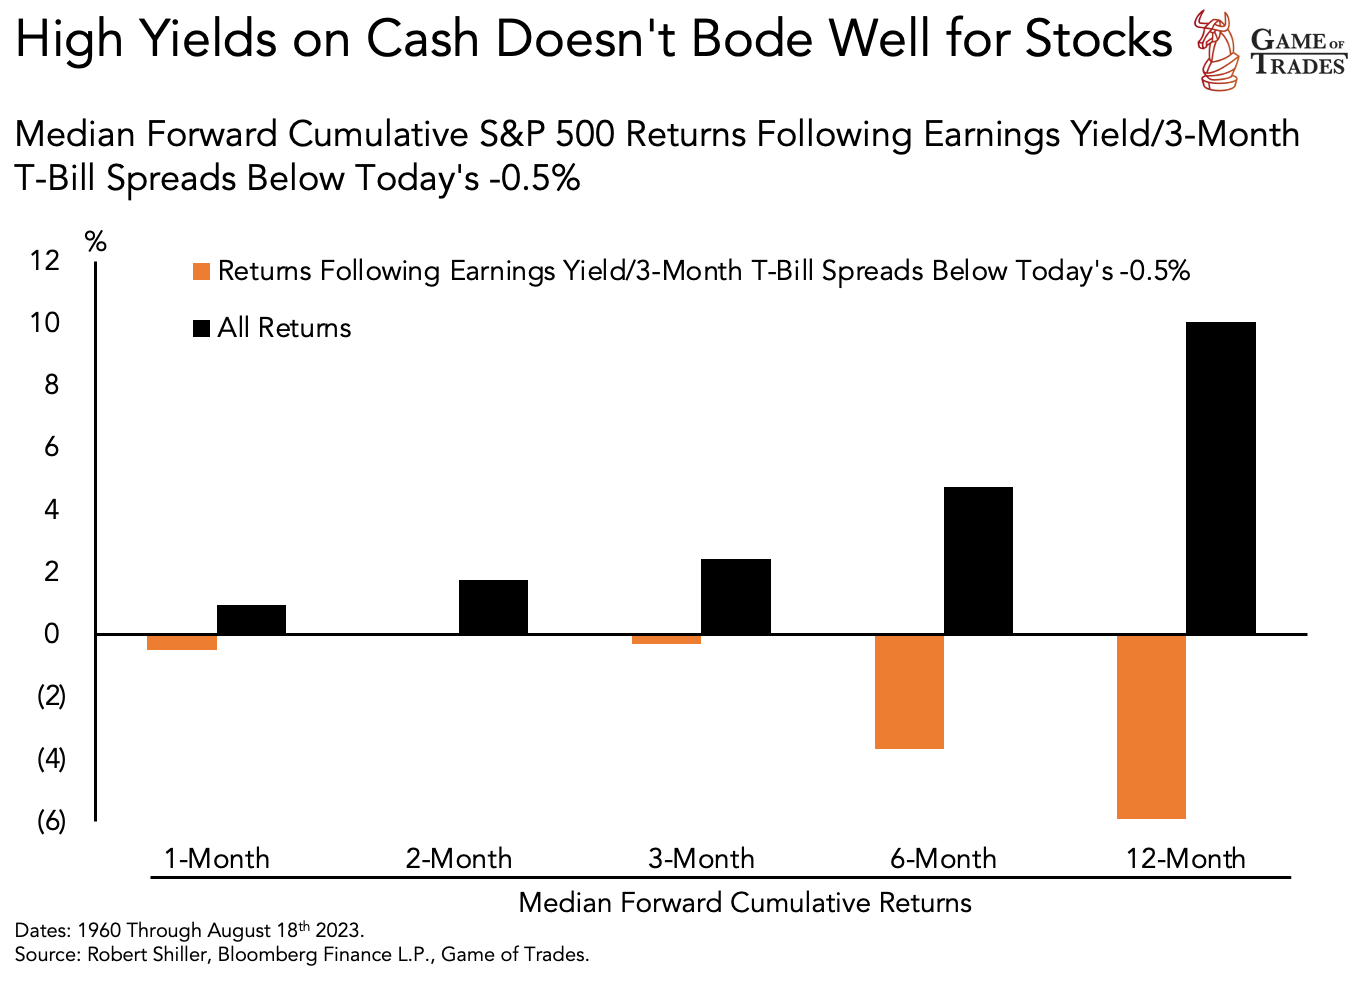
Following such a signal, the 3-month median S&P 500 forward return is near 0%, with stocks typically having negative returns looking out 6 to 12 months. This contrast is stark compared to the average returns.
Analysis of Historical Episodes With Negative Spread
To better understand the current situation, let’s examine the past episodes and determine which one most resembles our present day. In 5 out of 8 episodes (red circles), the Fed had substantially raised rates prior to the signal. In the other 3 (green circles), the Fed was not raising rates rapidly
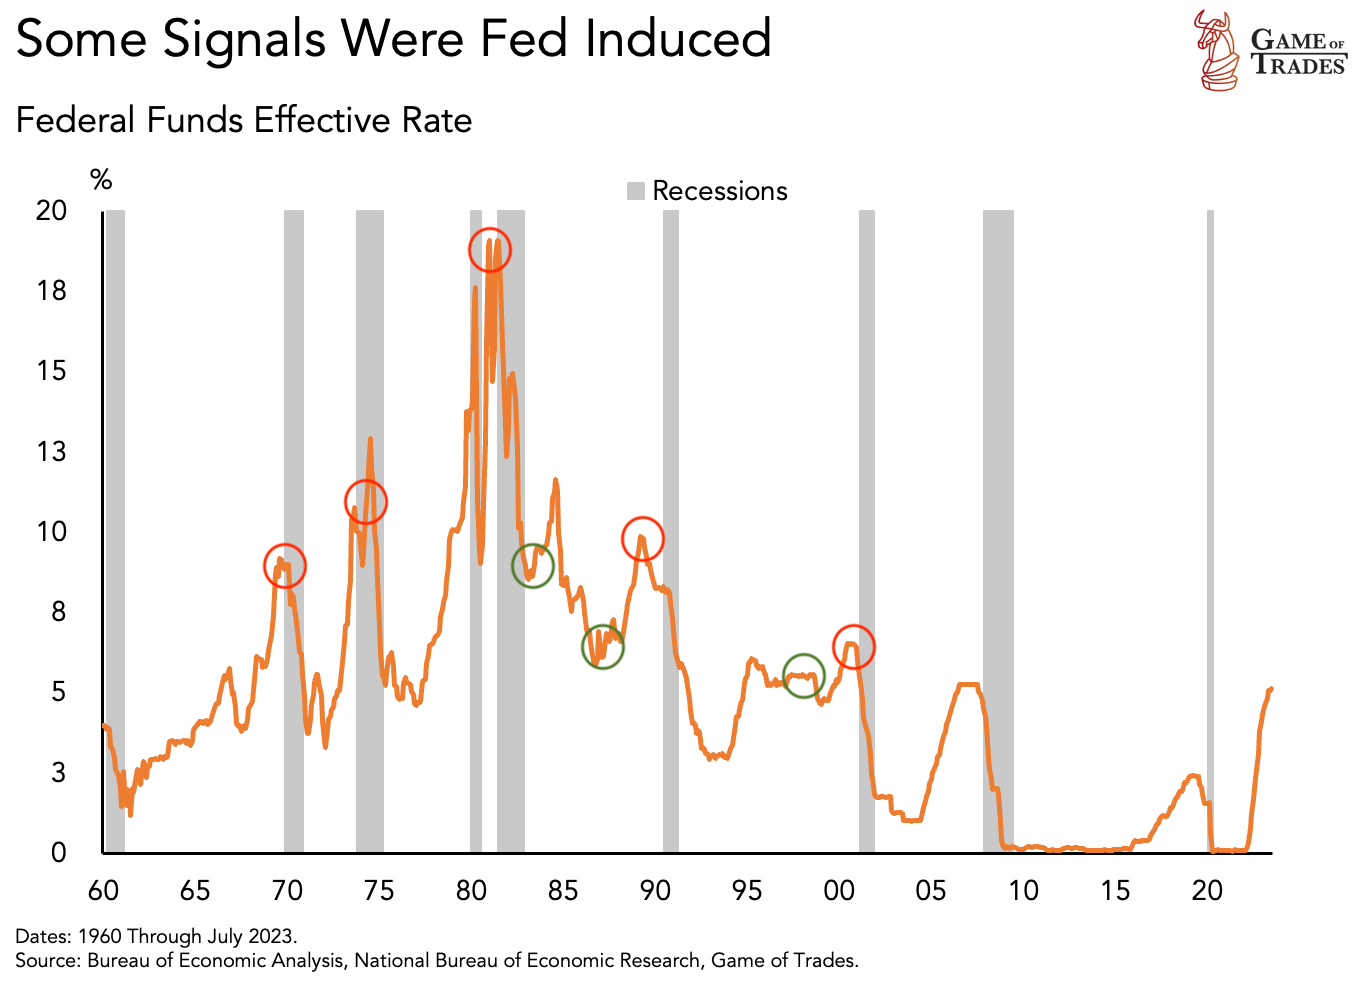
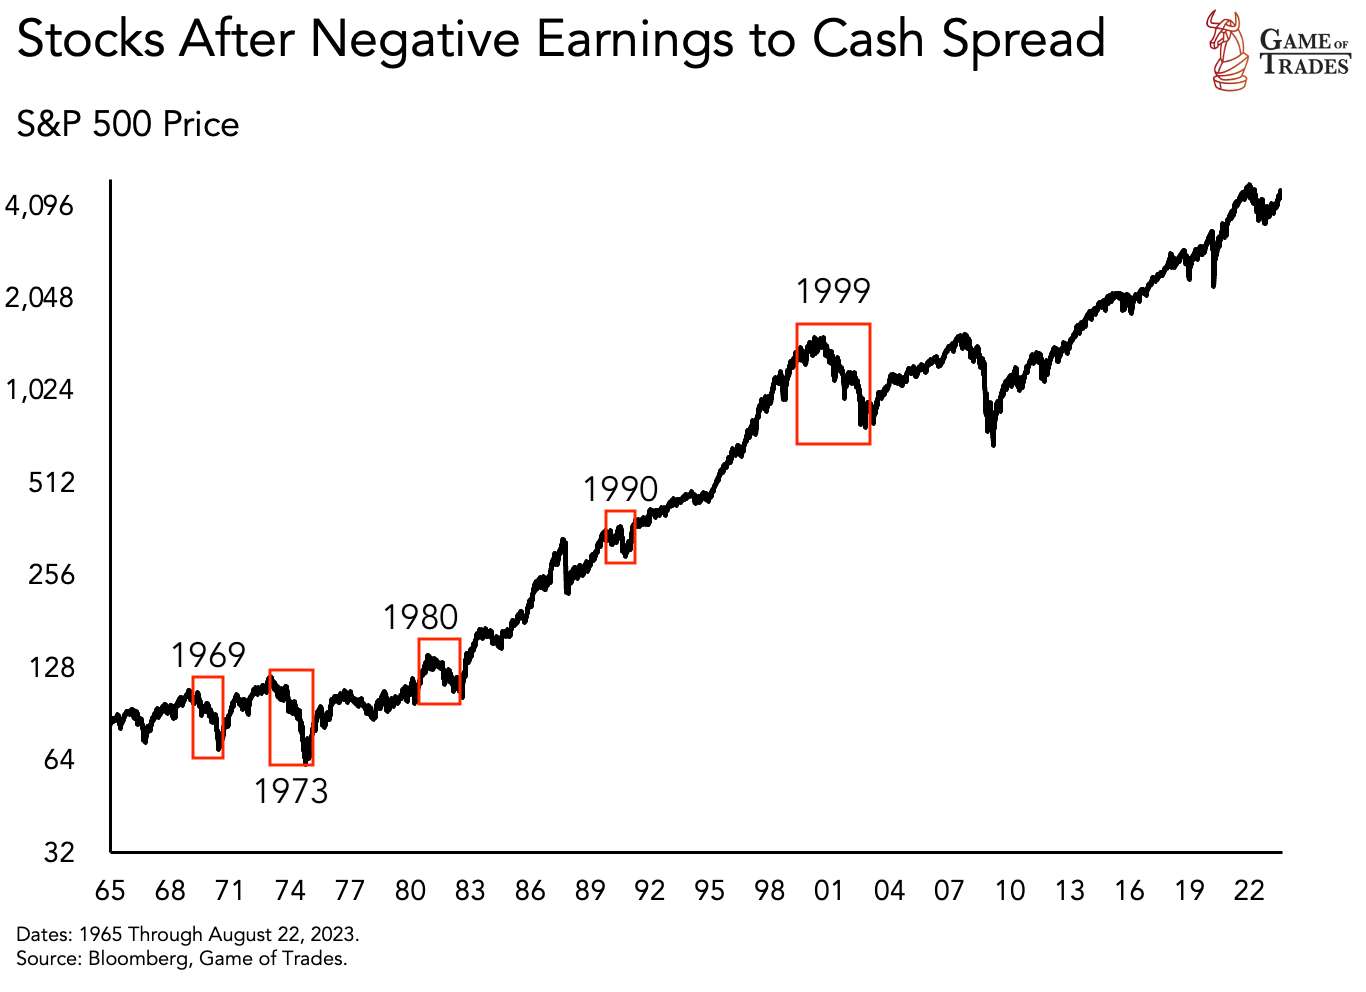
Considering the Fed’s aggressive rate hikes this cycle, below are the details for the 5 episodes when the Fed was raising rates:
October 1969: Stocks dropped 20% +
October 1973: Equities plummeted by 40%
August 1980: Stocks first moved higher, but then saw a 26% drawdown
July 1990: Equities declined nearly 20%
January 1999: Stocks initially moved higher, but then the Dot Com bubble top followed
In 3 out of the 5 episodes (1969, 1973, and 1990) stocks fell immidiately following the signal. Whereas, in the other 2 cases (1980 and 1999), equities peaked soon after and saw sizable drawdowns.
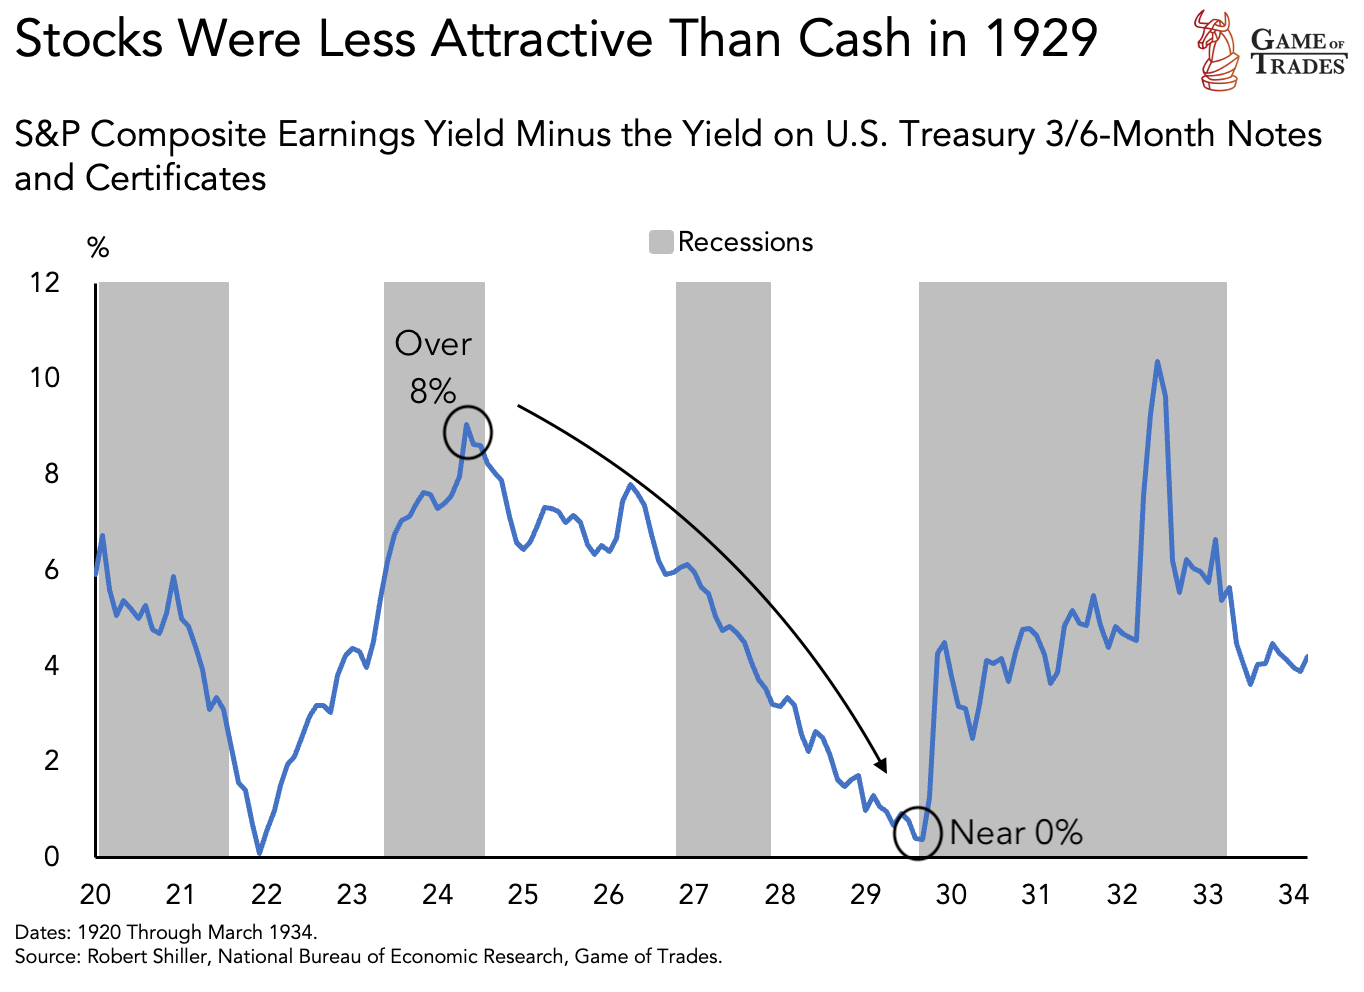
A similar development occurred in 1929, where the spread between S&P 500 earnings yield and three-month treasury note yield plunged from around 8% to near 0% (October 1929), coinciding with the stock market top. It’s important to note that the spread didn’t go negative in 1929, despite the Fed raising rates, because the market peaked before the spread could decline further. However, the episode supports the notion that raising rates into a relatively unappealing market increases the likelihood of large drawdowns
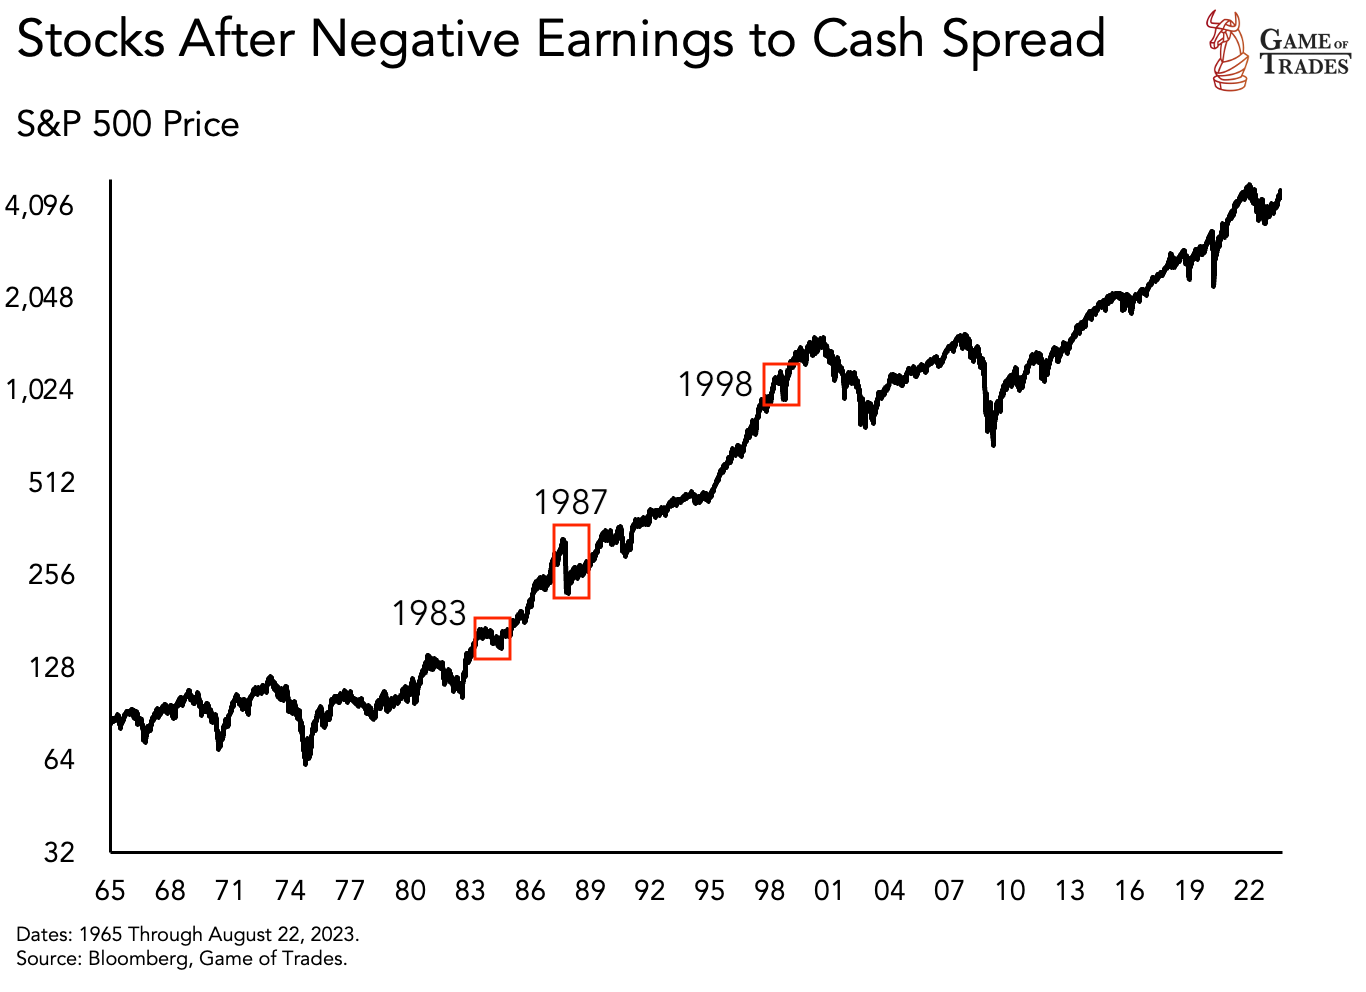
The other 3 episodes when the Fed wasn’t raising rates during a negative spread, i.e., 1983, 1987, and 1998, saw muted downside following a negative earnings to cash spread
Conclusion
Remember, nothing is guaranteed in the markets. In 1999, it took 1.5 years before the market peaked, largely due to the tech bubble. Today, one could argue that excitement around AI technology is contributing to similar market euphoria. However, past trends suggest that investors should tread cautiously in the current environment, where earnings yields are at historical lows and short-term rates have risen aggressively. This combination could signal less attractiveness for stock ownership and has historically preceded substantial drawdowns in equities. Click here to get free trial for 7 days! Subscribe to our YouTube channel and Follow us on Twitter for more updates!
Read more: The “Soft Landing” Narrative: A Deep Dive Into Consumer Behavior and Labor Market Dynamics


