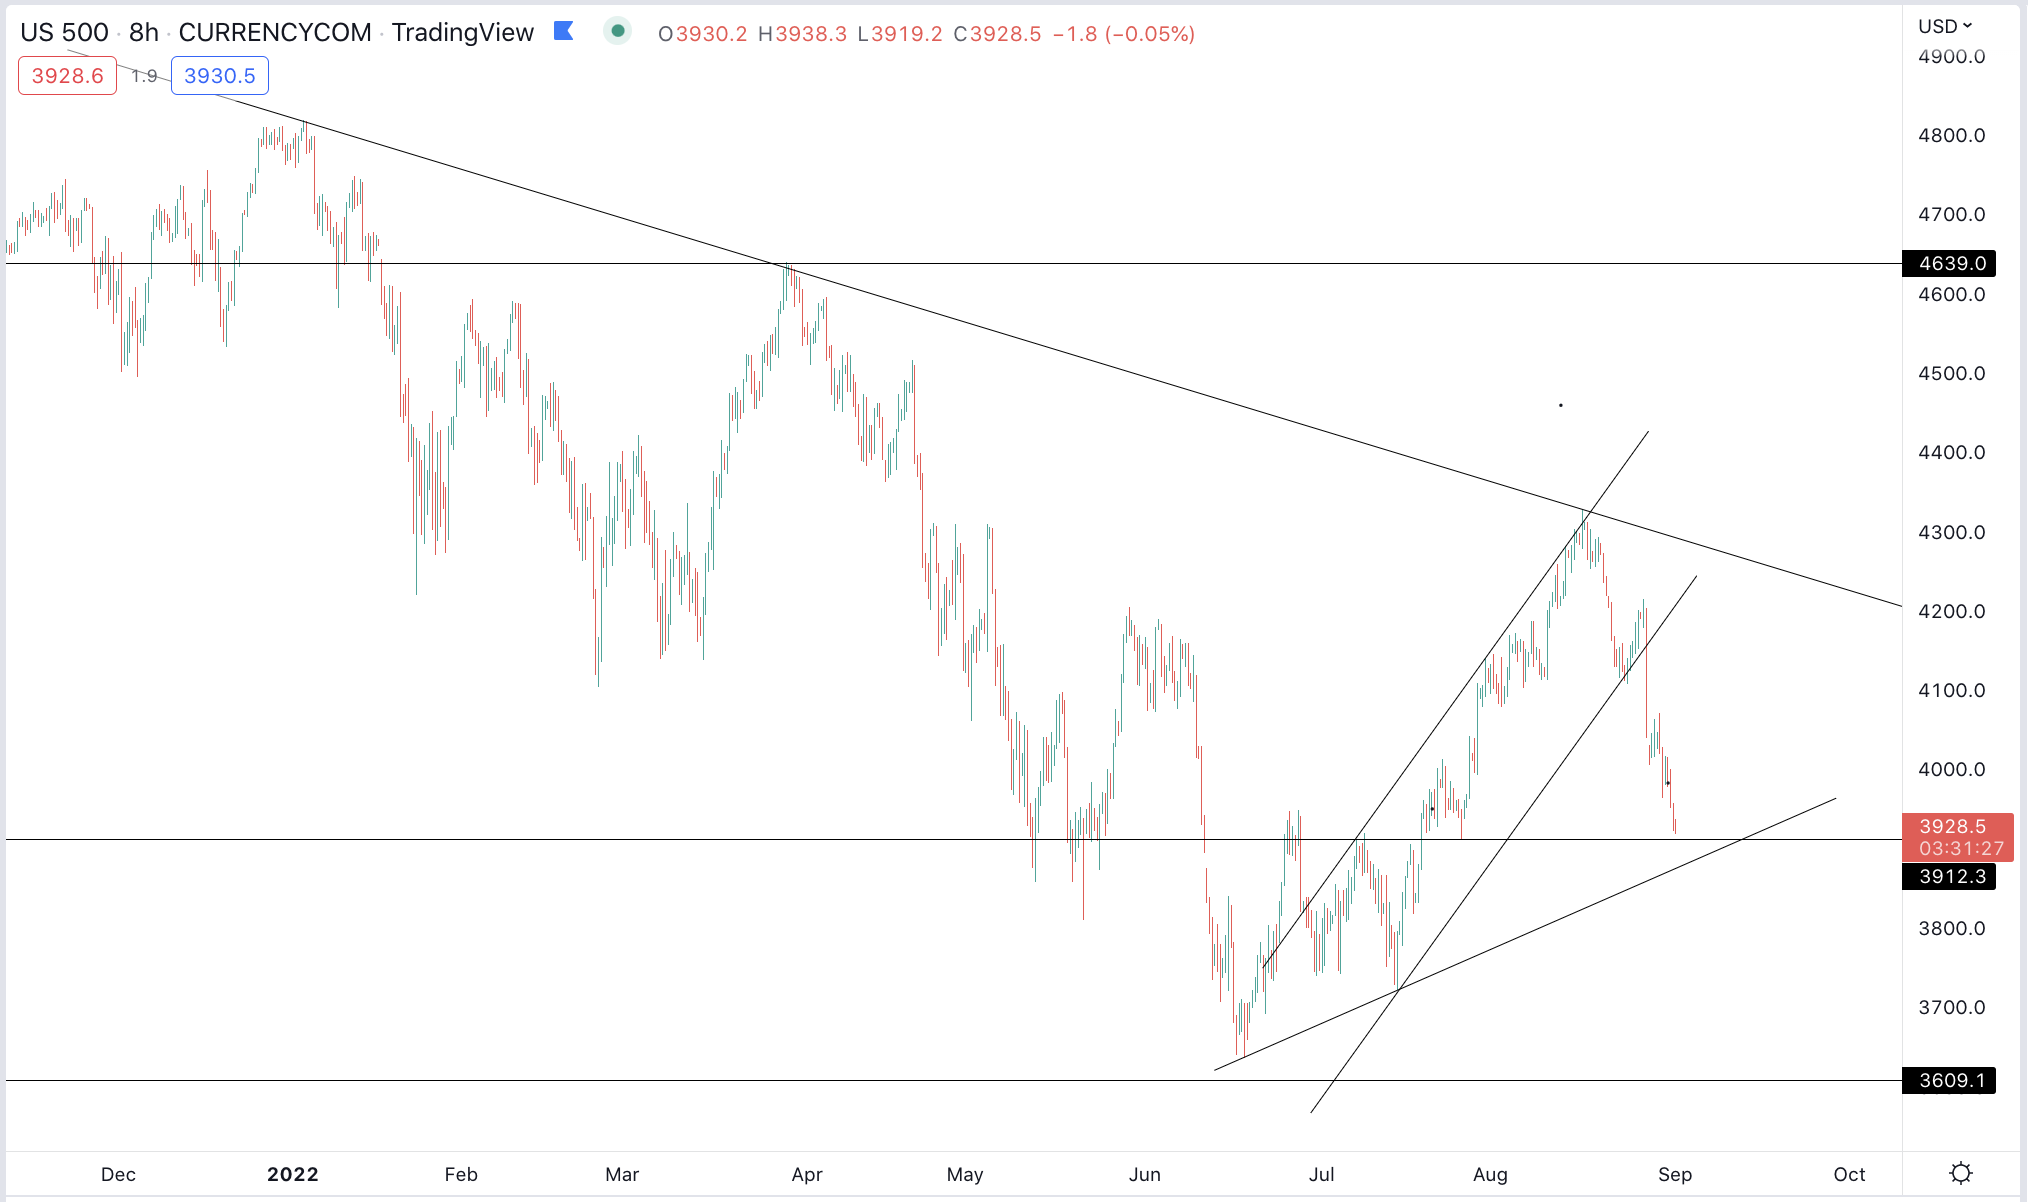
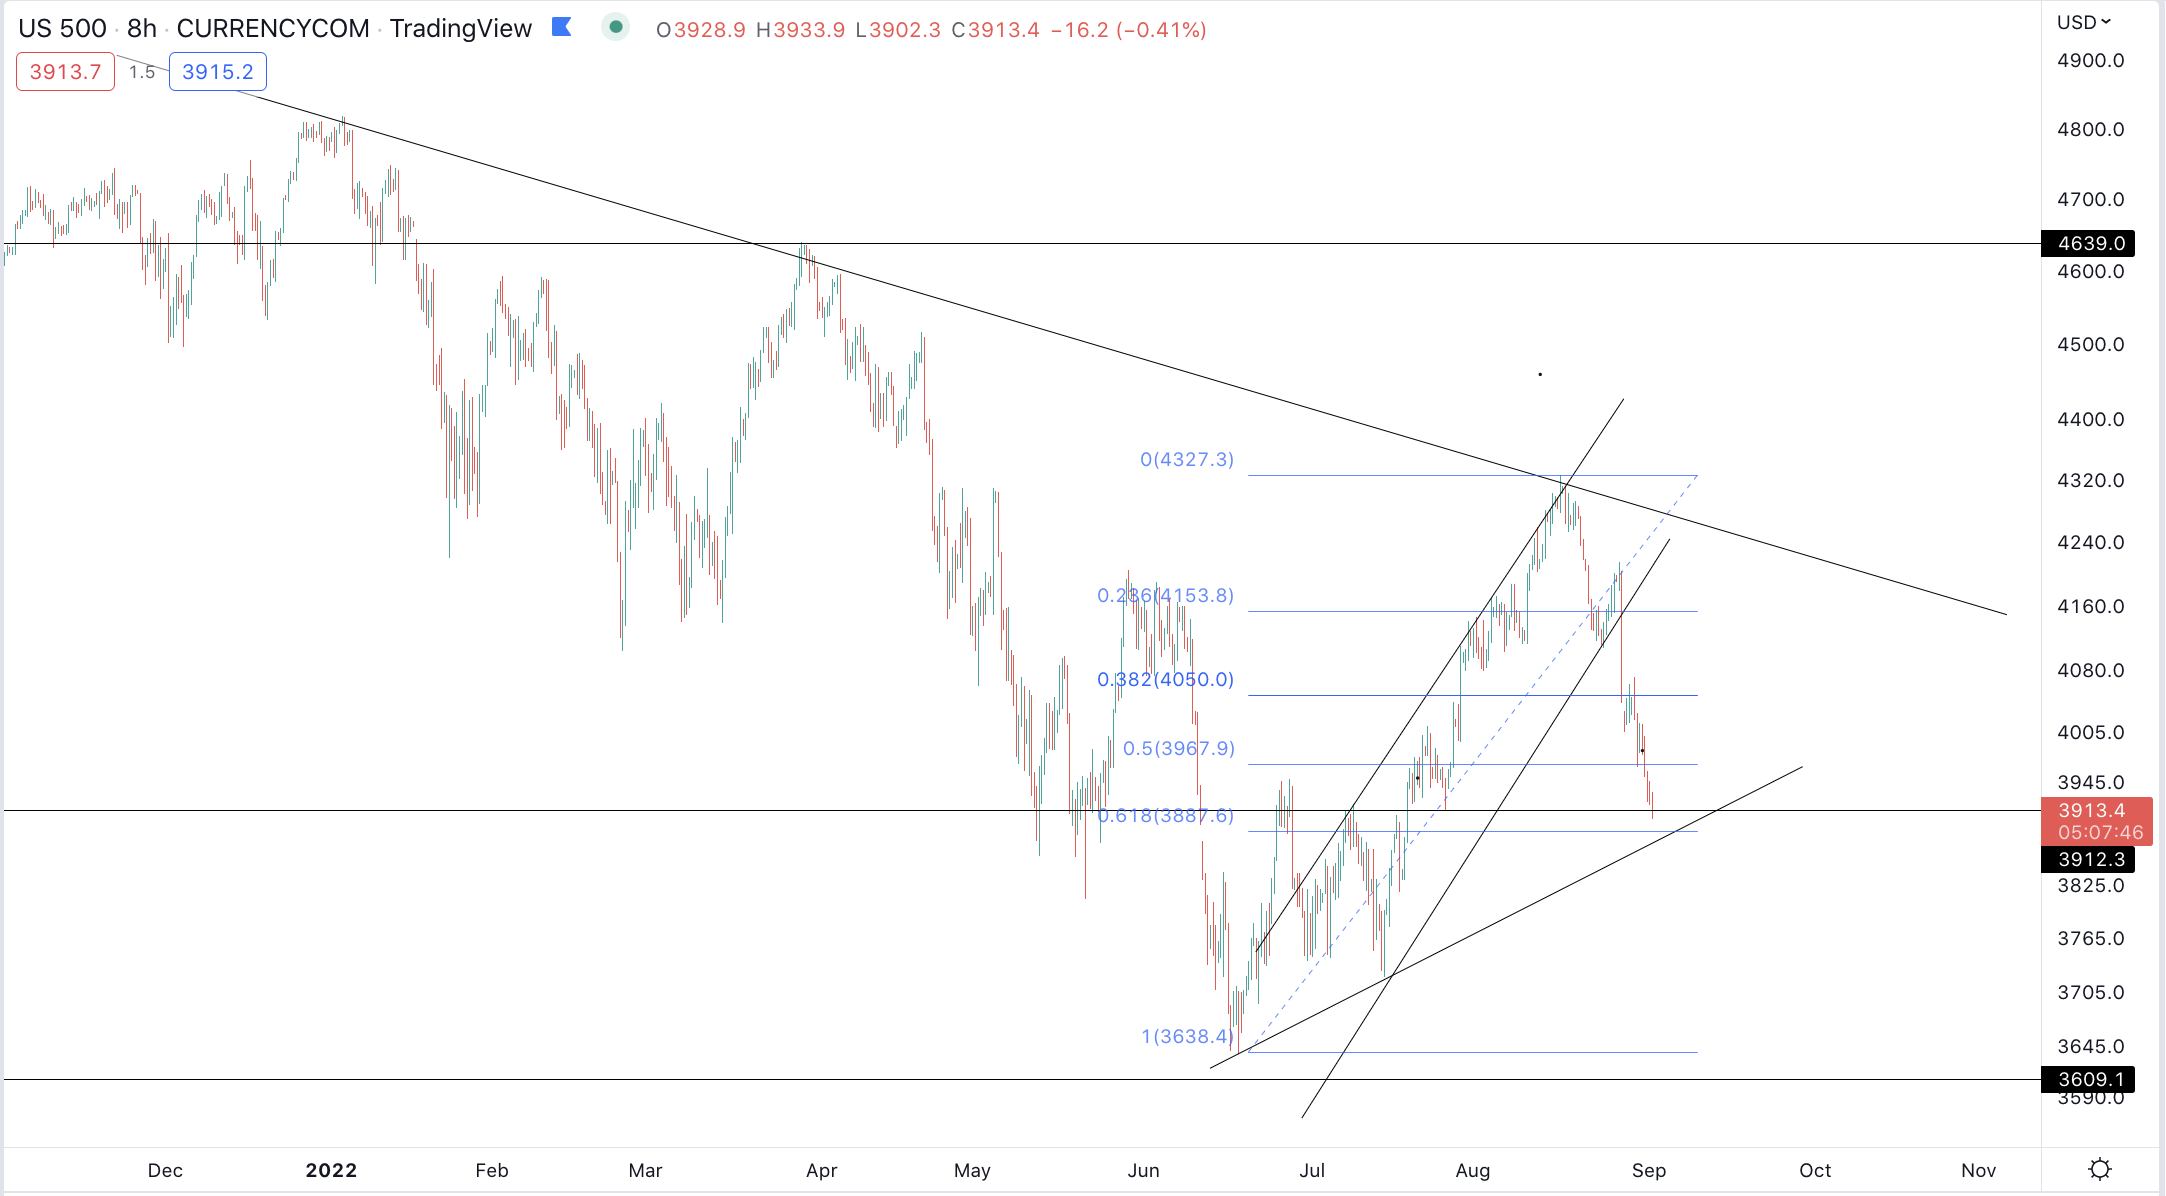
Following Jerome Powell’s hawkish comments last Friday, the stock market seems to be free falling. We saw a clean rejection off the down trendline connecting the all-time high and the March 2022 top, this was immediately followed by a breakdown below a bullish price channel. Price is now rapidly approaching the third key level of support we’ve been watching at 3900 points.
Our recent article “Optimism makes a comeback” discussed some key breadth thrust signals triggered during the summer rally. These signals have historically corresponded to short-term price appreciation on the SP500, and we used them to make the case that the 2022 June low would likely not be revisited.
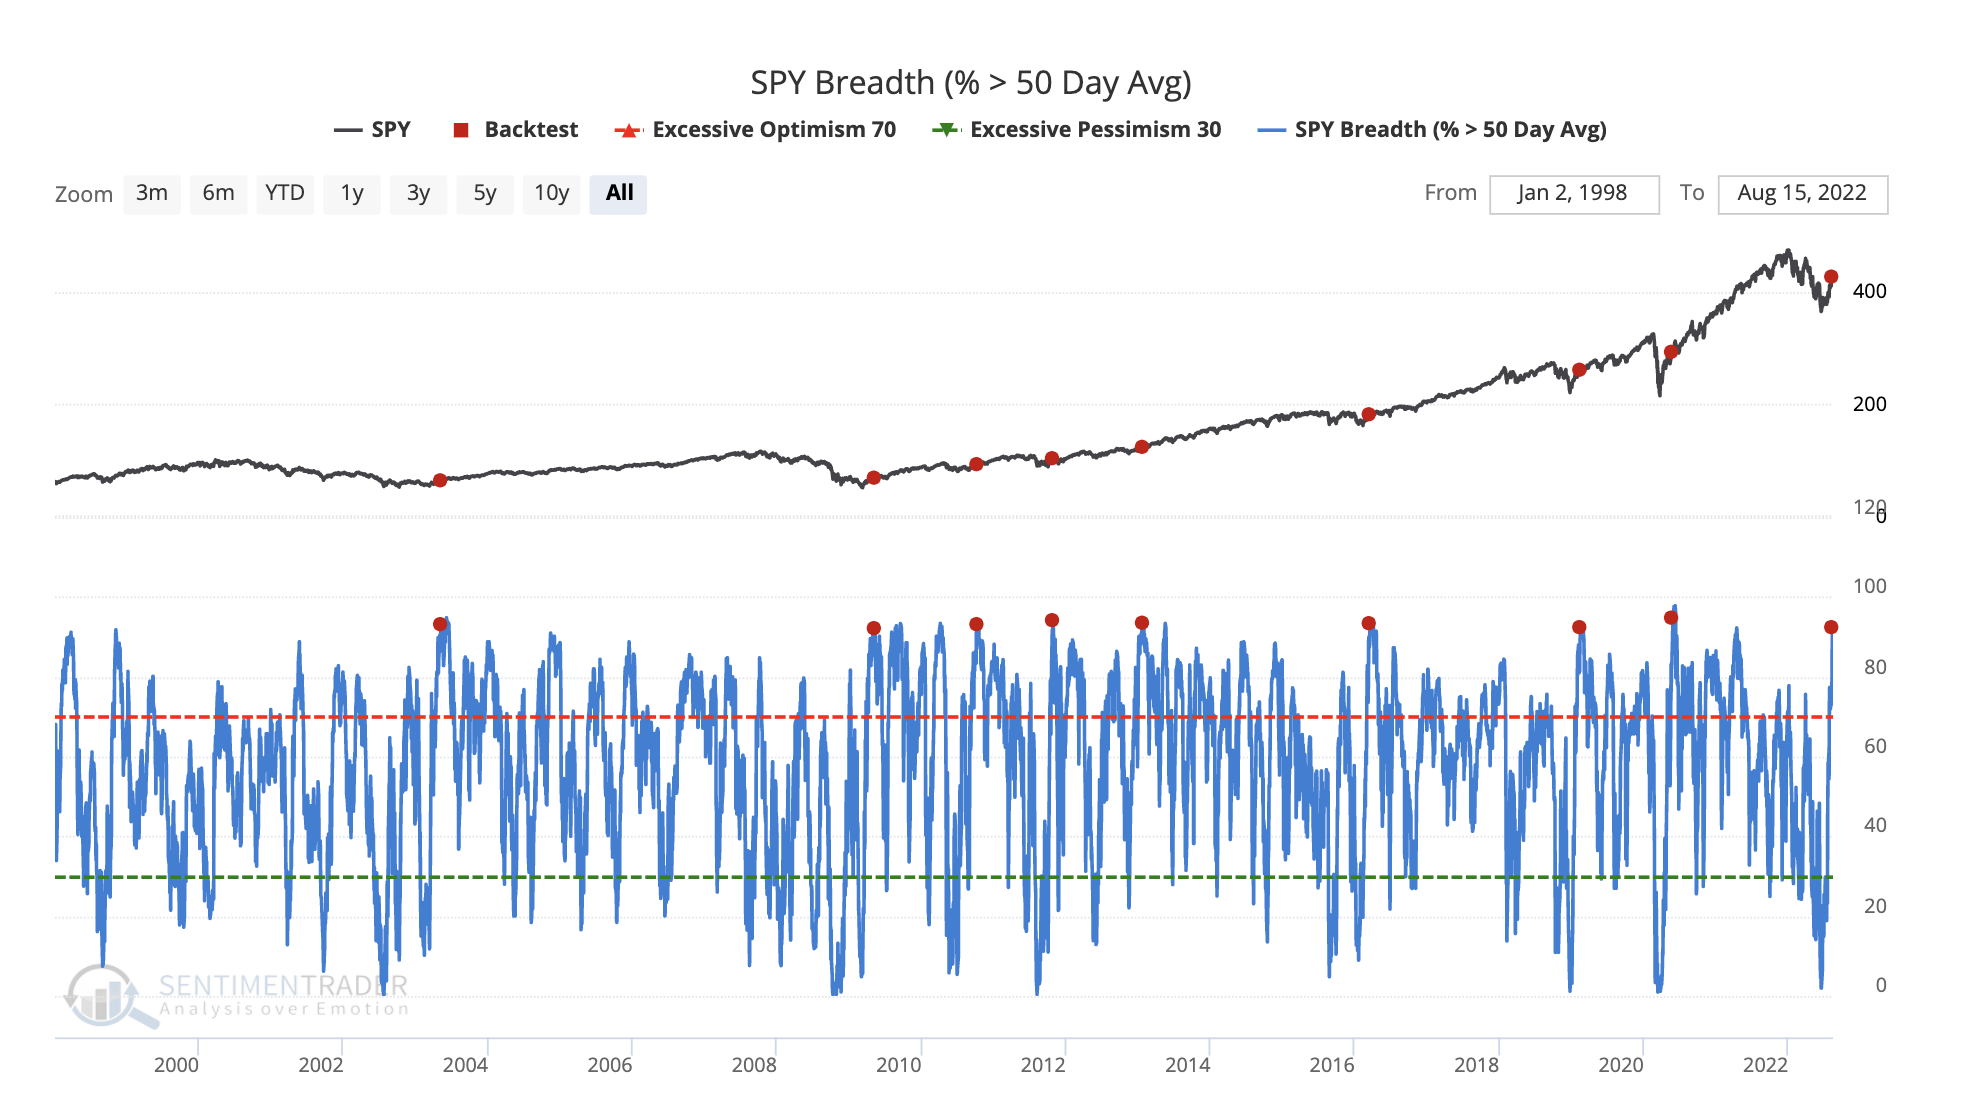
The question is, how do we know when this breadth thrust signal is invalidated and no longer looks comparable to the previous signals? This is the topic of today’s Youtube video, and we dive into a little bit more detail in this update. Over the next week, we’ll also be diving deep into the underlying fundamental driving factors of the market to see if we’ve seen major changes in the macroenvironment over the last few weeks that could invalidate the bullish case for stocks.
Is the Breadth Thrust Invalided? If so, How Bad Could it Get?
We can look at the breadth thrust readings that have occurred throughout the current secular bull run, which began in 2009, we believe these are good benchmarks to compare whether or not we are seeing comparable “secular bull run” behavior today.
From the date of the breadth thrust signal, we’ve seen an average maximum drawdown of 2.9%.
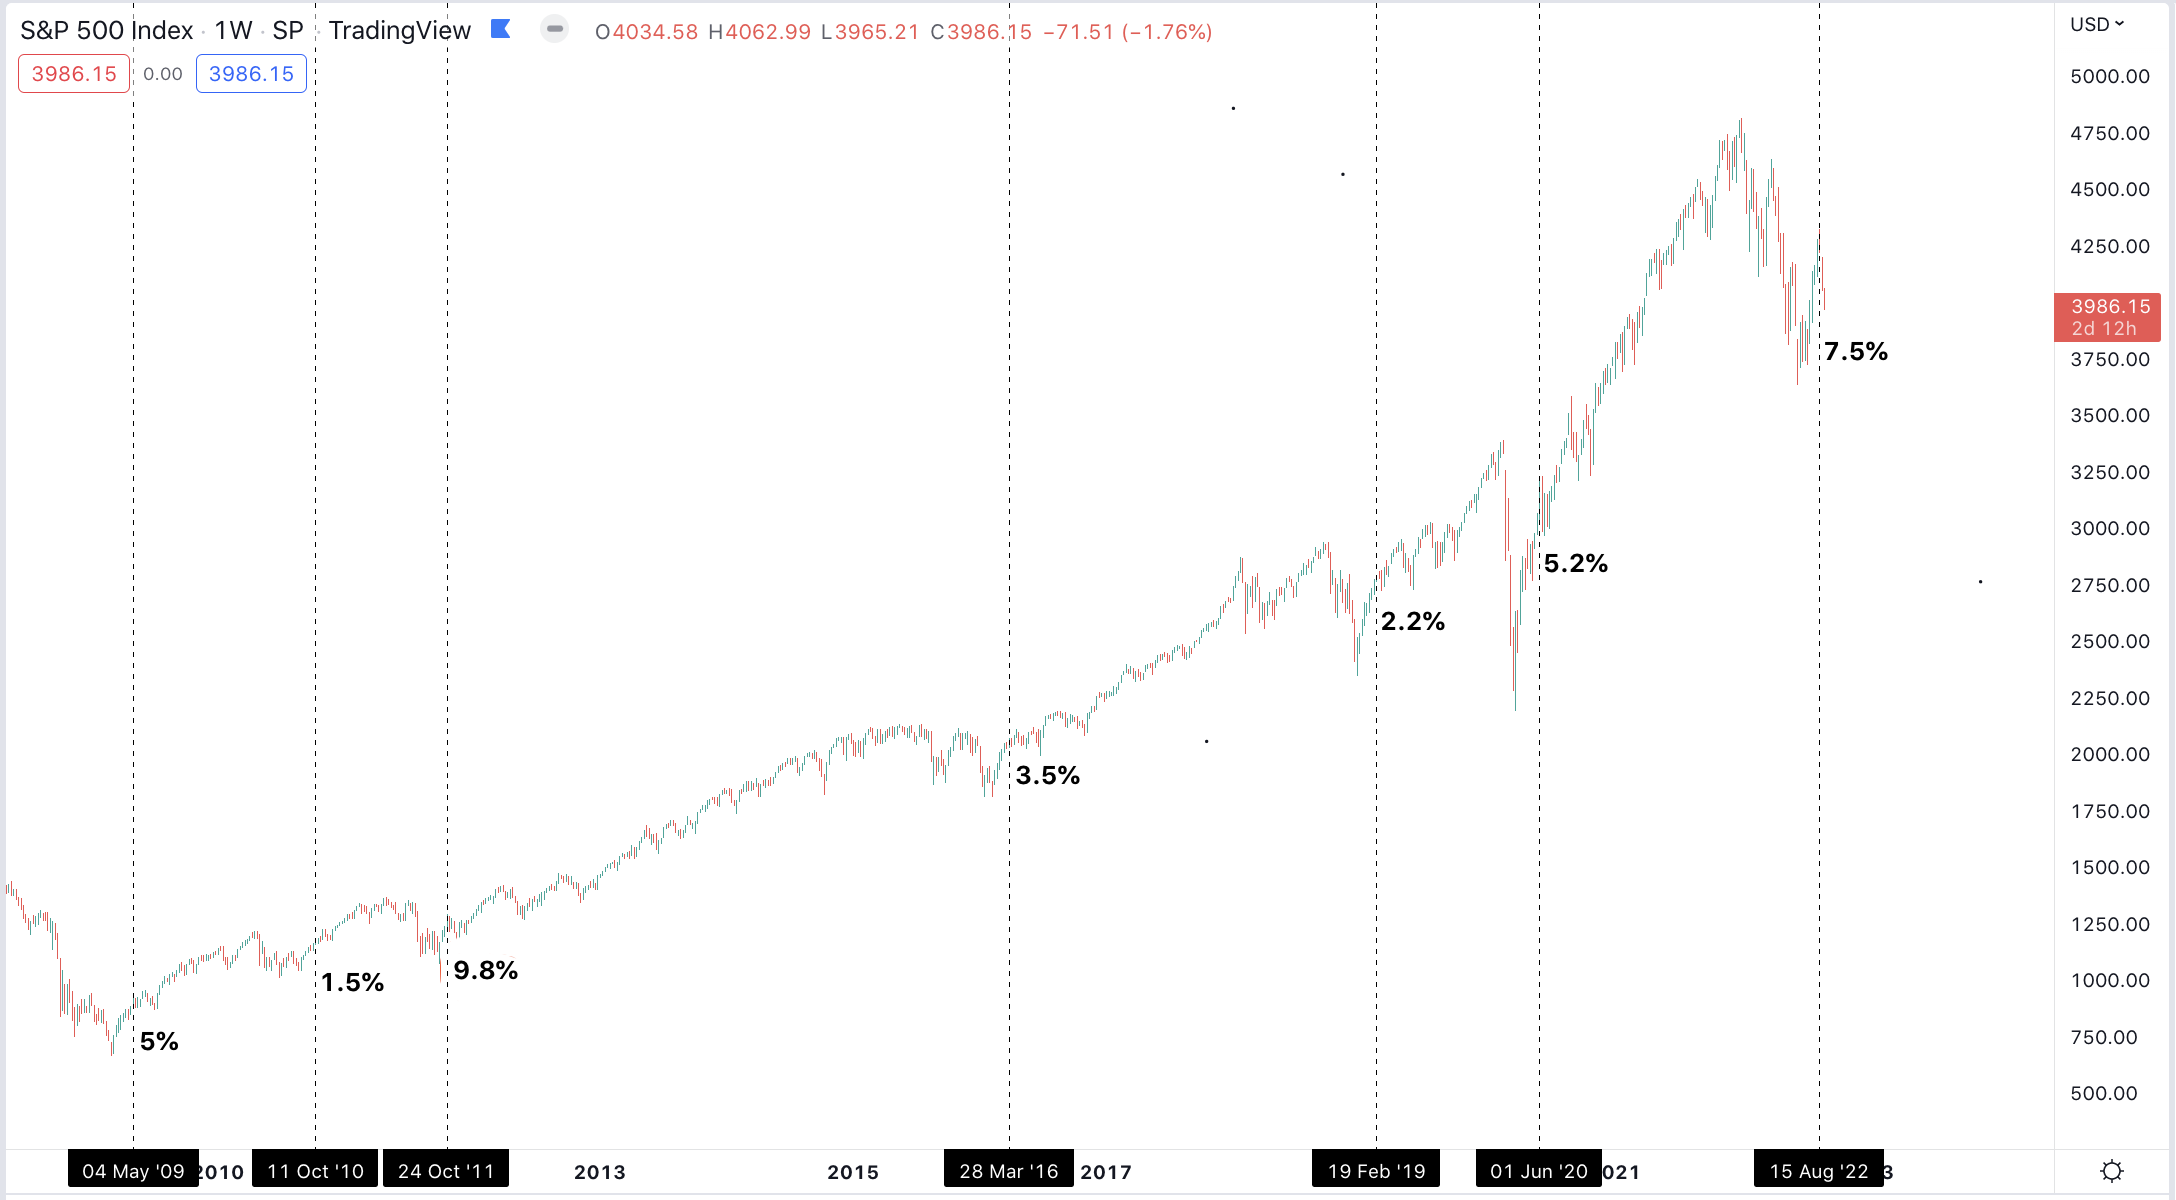
If we put these drawdown levels on today’s chart, it helps us visualize the results. The correction we’ve seen today has been much more painful than what typically happens following these breadth thrust signals. Seeing the market move down rapidly past these benchmarks can already be considered a yellow flag and decreases the odds that the breadth thrust signal plays out.
The last comparable drawdown to today is 2011 when the market rapidly dropped 9.8% following the breadth thrust signal. A correction of this magnitude would take the market down to 3885 points (which is just a hair below where the market is currently sitting).

If we take a closer look at the 2011 reading, we can observe that the market found support at the 61.8% Fibonacci retracement level from the rally.
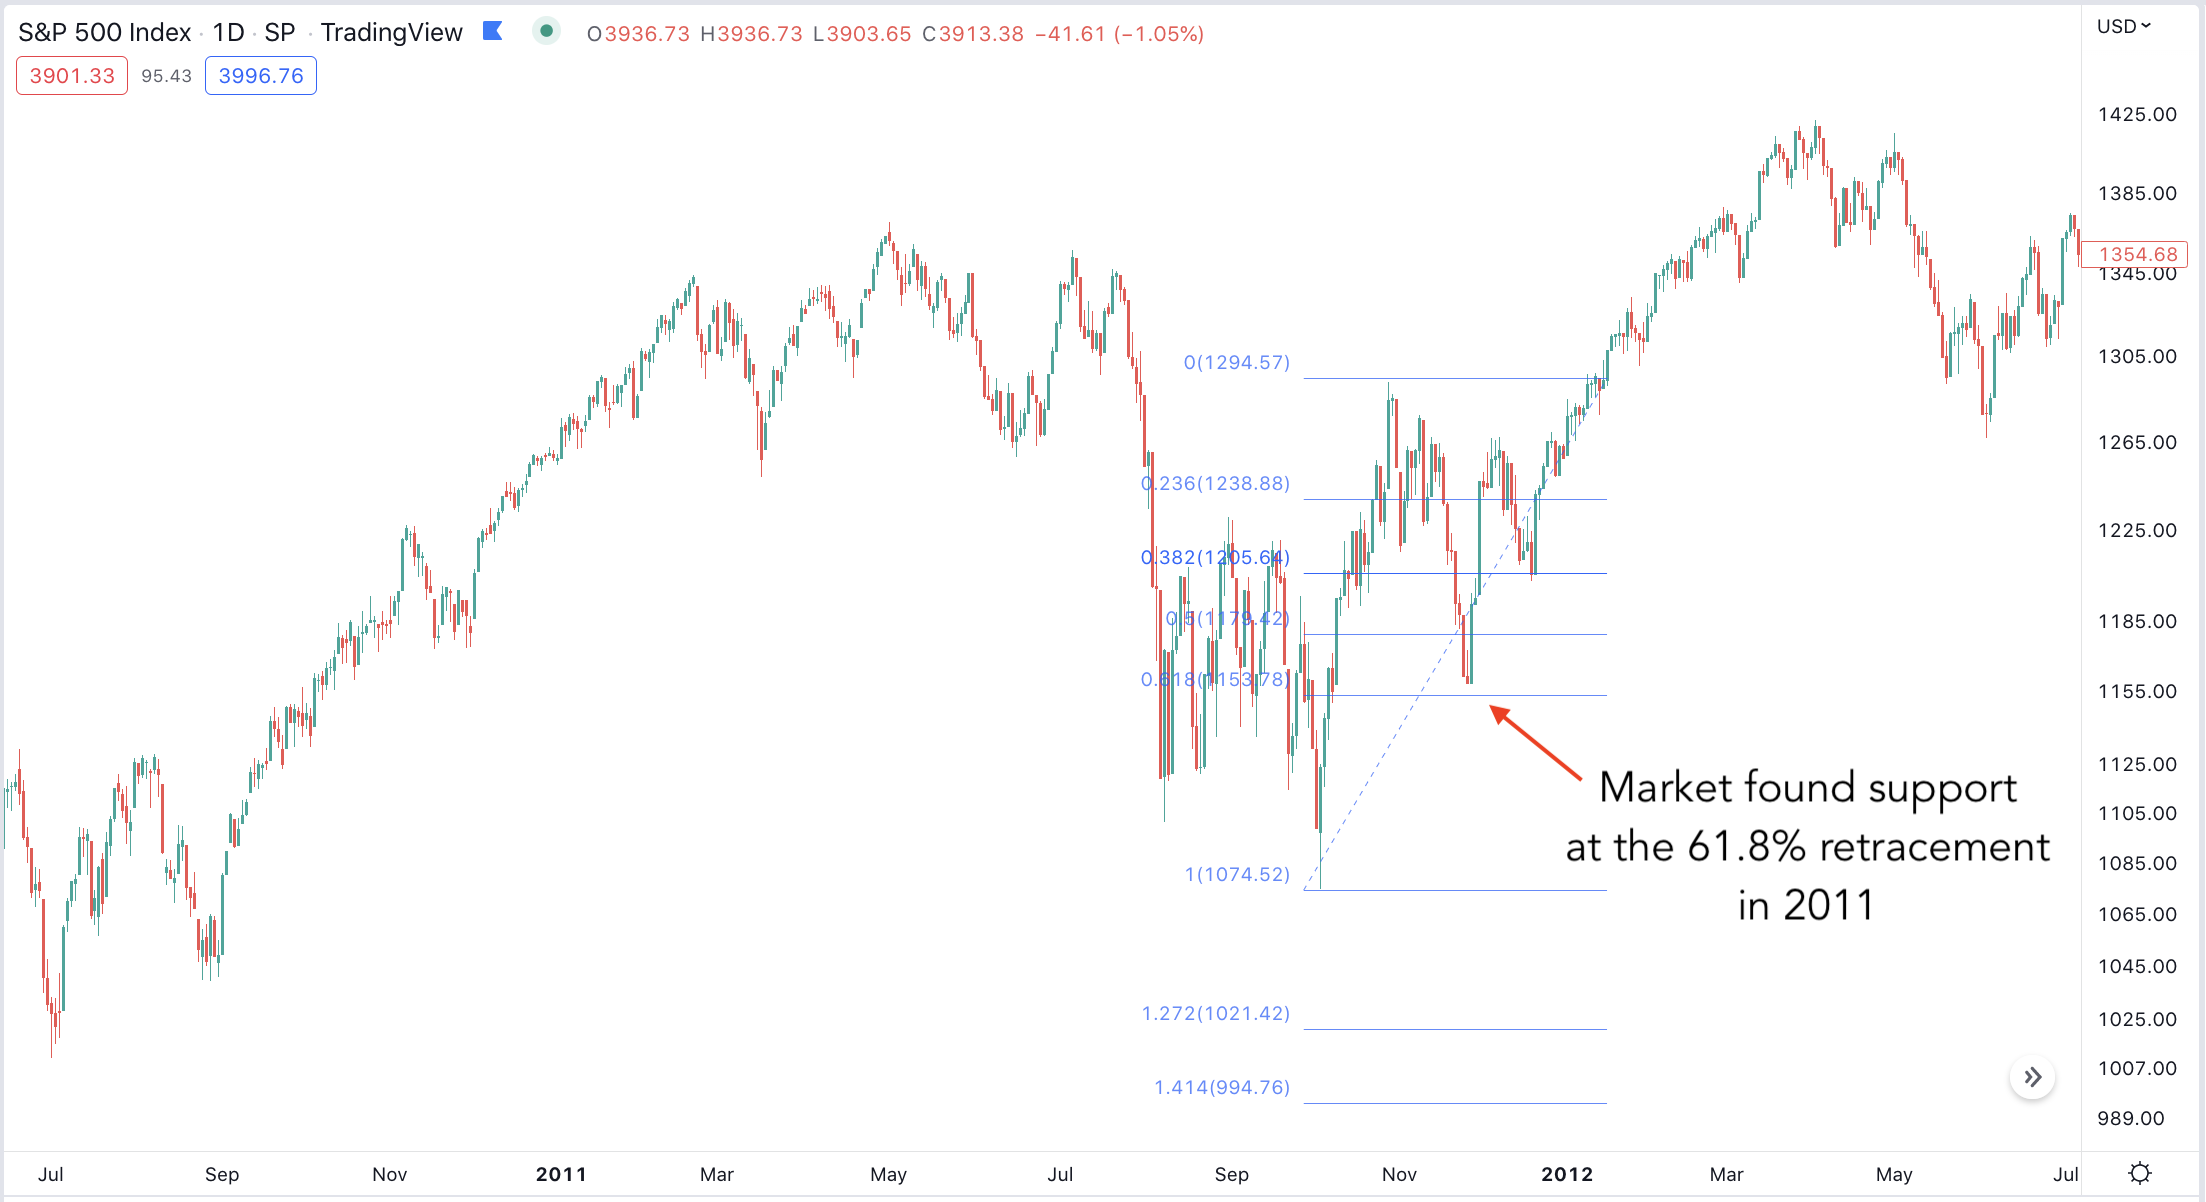
Today, the 61.8% retracement level also happens to coincide with the 3900 points level on the SP500. Fibonacci retracements can also be used to interpret trend behavior. A correction that goes past its 61.8% retracement level can no longer be considered just a “counter-trend correction”, seeing price drop below 3900 points would very much be an invalidation of the bullish technical structures we’ve seen develop over the last few months.
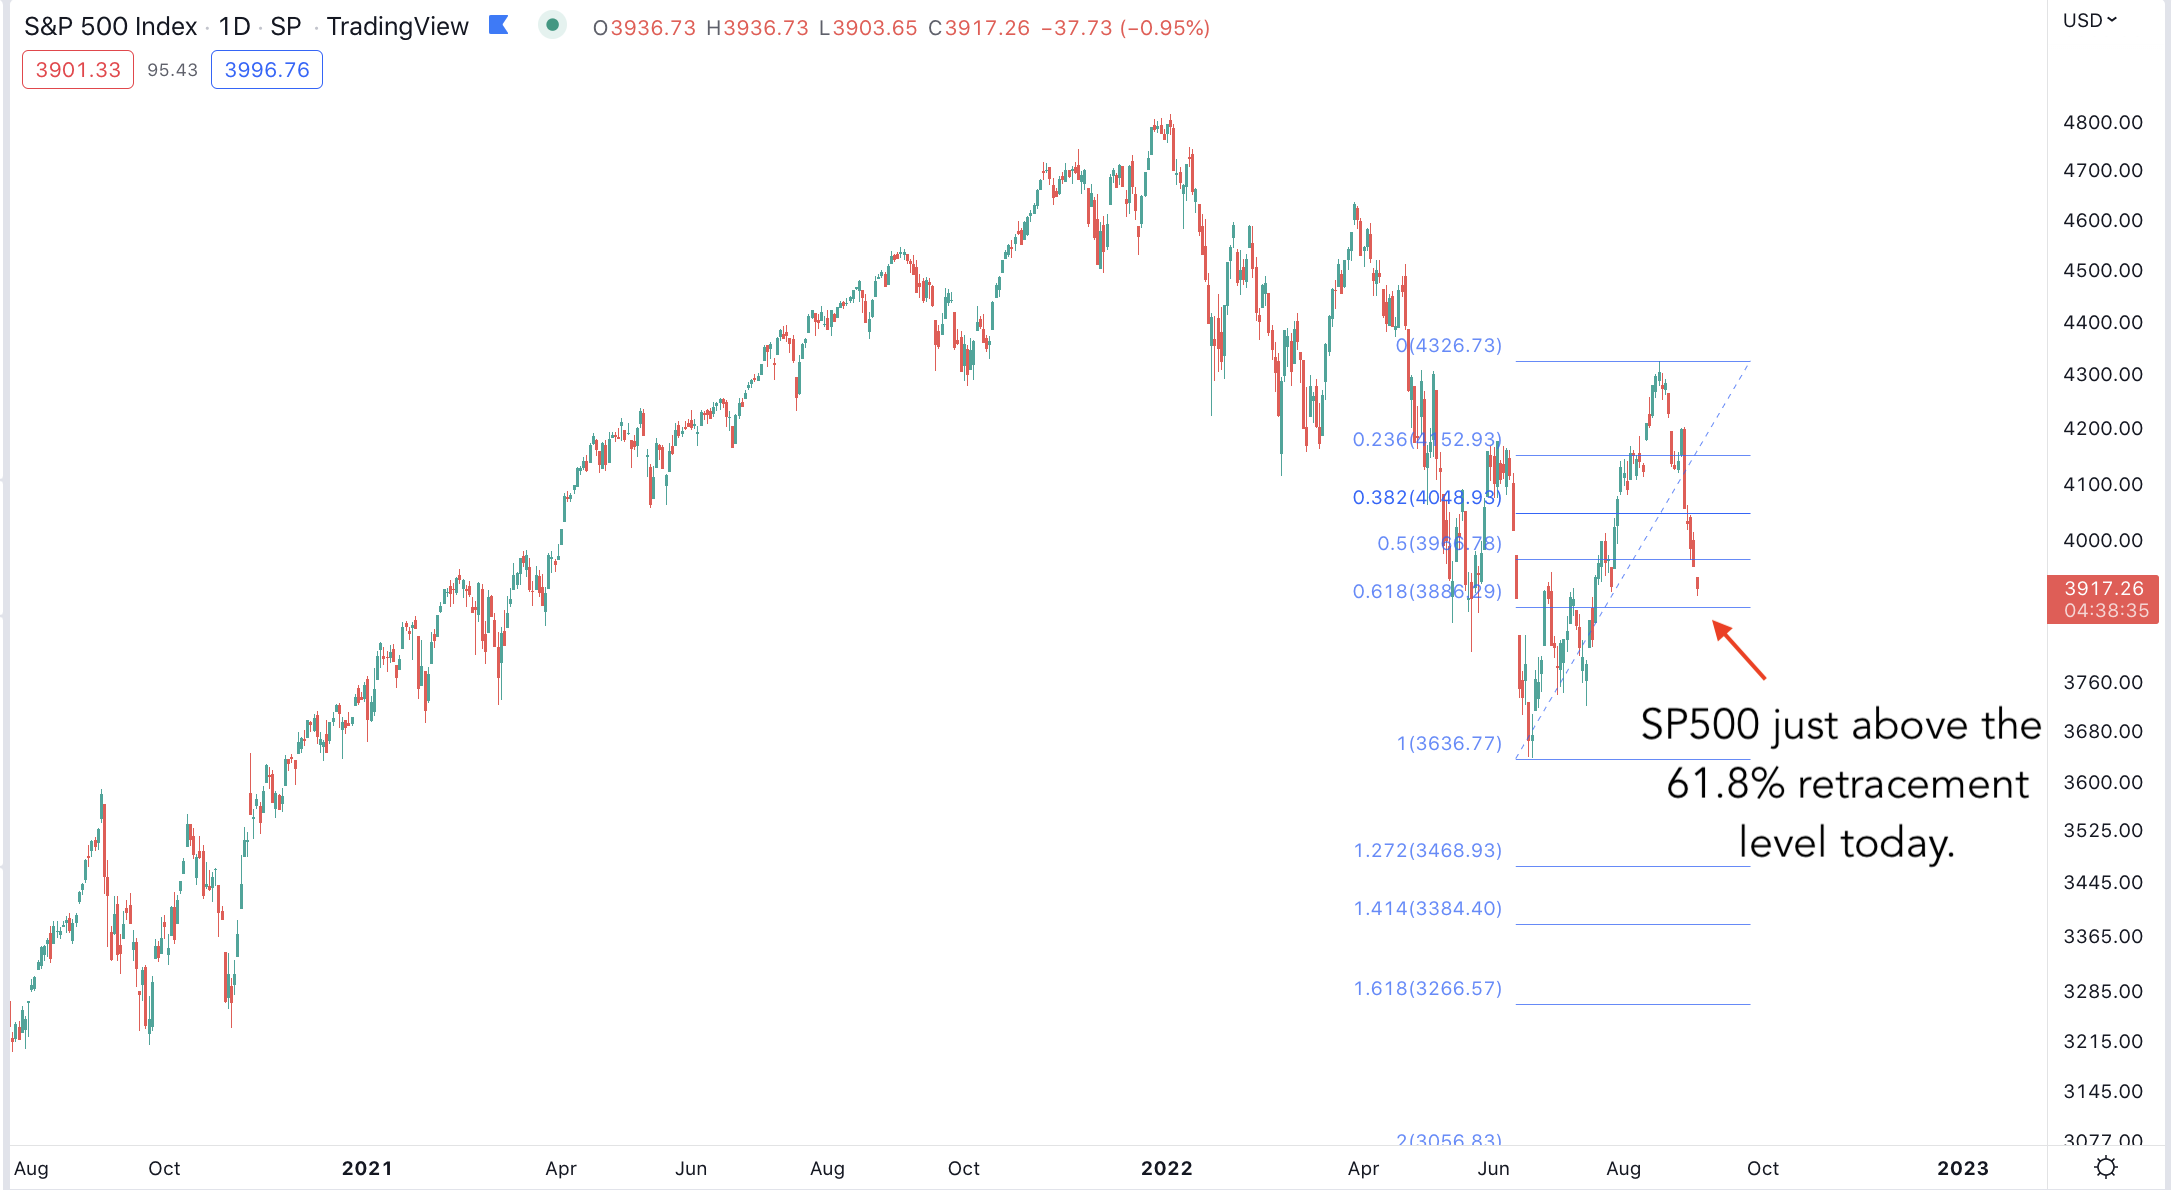
While seeing price breakdown below 3900 points would not invalidate the fundamental macro picture we’ve been discussing over the last few months, it would decrease the odds of seeing significant short-term upside (which the breadth thrusts suggested we should expect) and increase the odds that the macro bullish case is being delayed and not playing out imminently. Macro shifts can take multiple months before materializing, and we’ve not seen recent data or developments invalidate the fundamental case we’ve been building.
Considering the technical significance of the 3900 points support zone, we’ll be watching the price action carefully over the next few trading sessions to see if it acts as support. If that is the case, it would suggest that the stock market is waiting for the next inflation readings before picking a direction. We expect the CPI reading should surprise to the downside but making such predictions can prove to be incredibly difficult. Dip-buyers who are constructive on the market can consider this a favorable risk/reward opportunity to take advantage of the next leg higher. Short-term traders can see this as an objective long entry placing a stop loss below the technical support levels highlighted on the chart below.
If the market were to slice through the 3900 points level in the coming days, it would suggest the market is not quite yet ready to begin trending up in a consistent manner. It would lean more in favor of a lengthier bottoming process with an undercut of the June low.
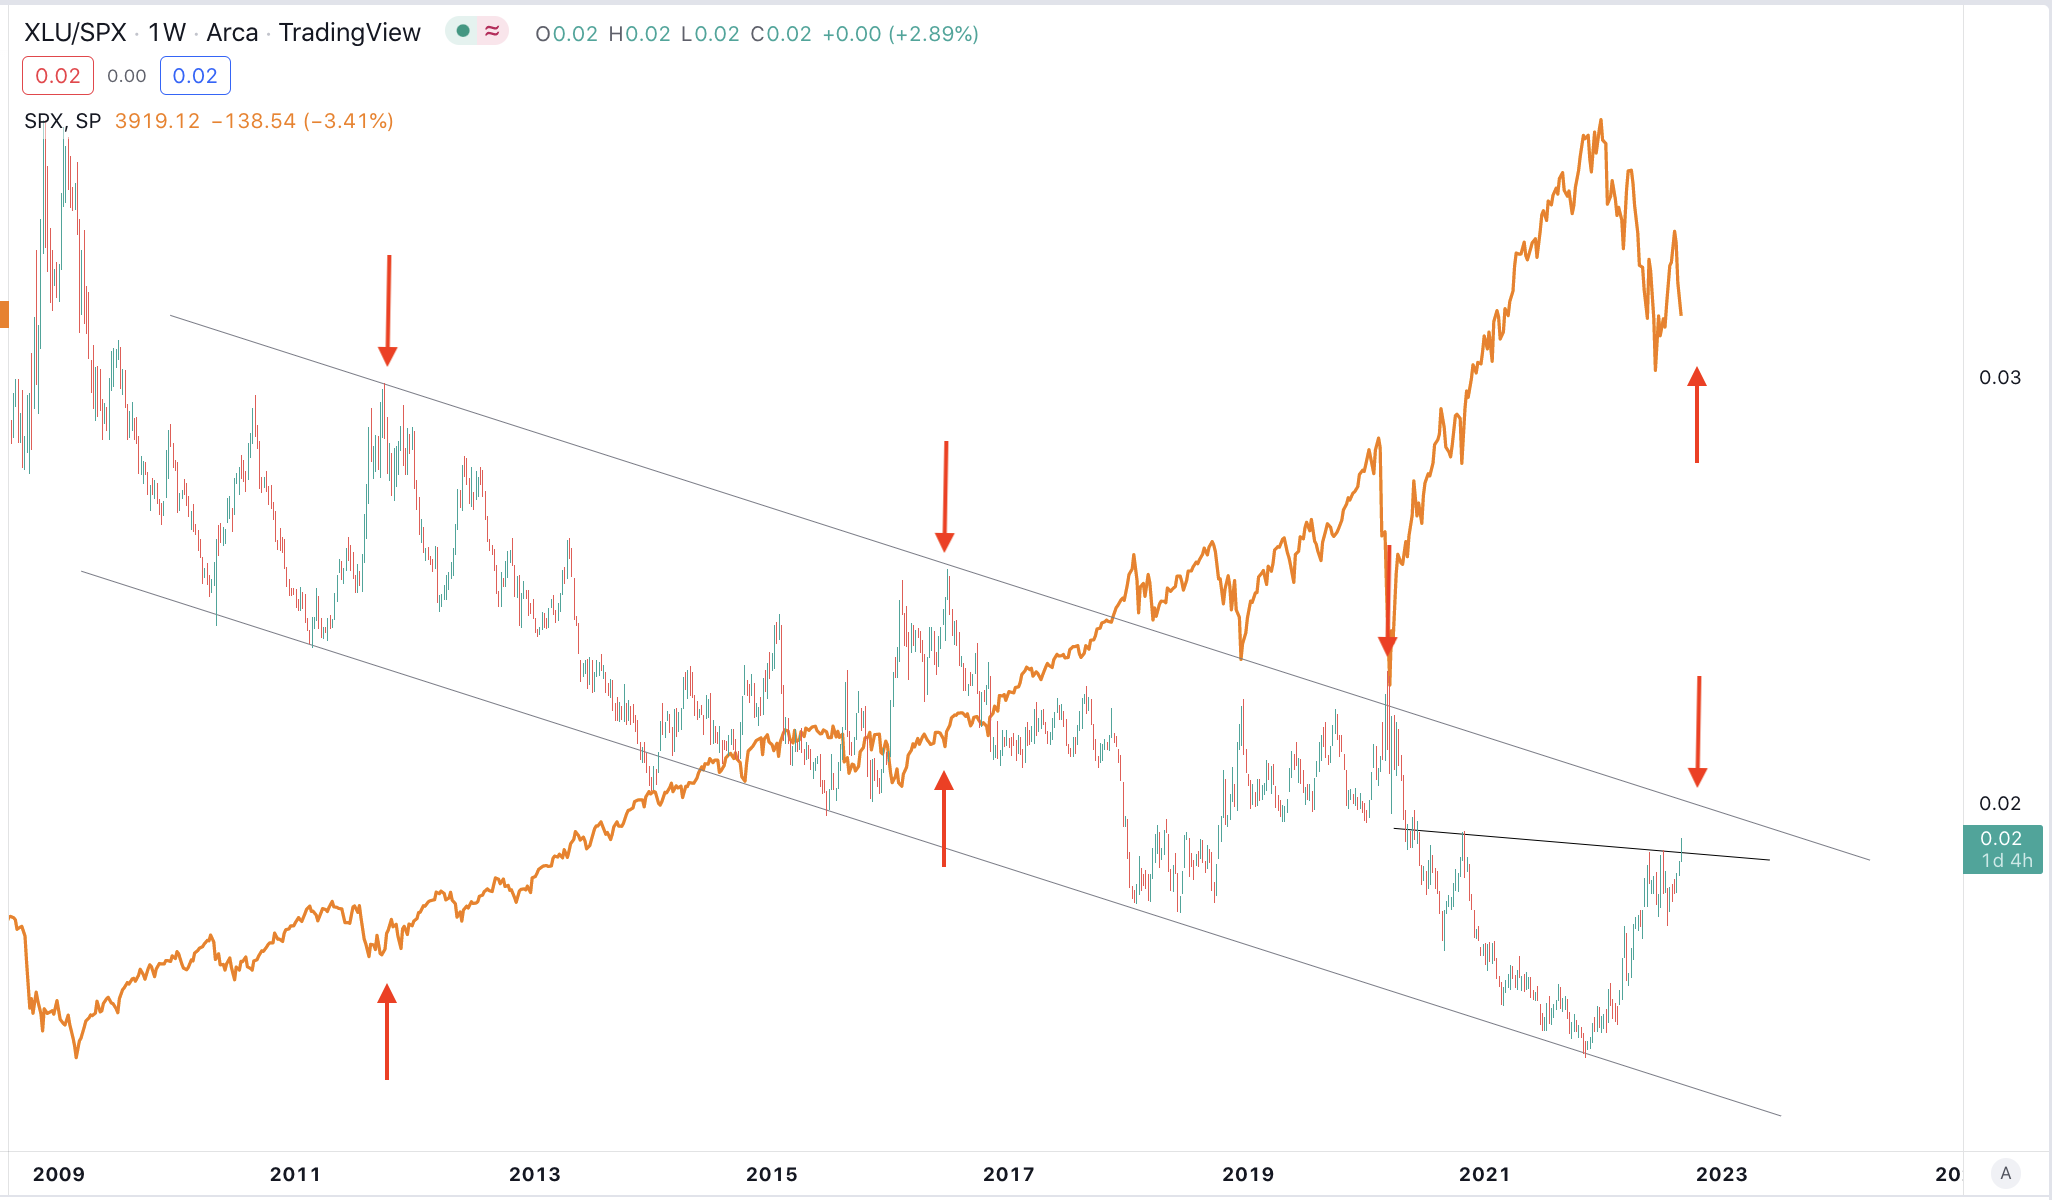
Finally, XLU/SPX is coming closer to testing the top of its secular bearish price channel. XLU/SPX is typically seen as a defensive sector (ie: it outperforms the market when the SP500 is going down). Over the last 10 years, we’ve seen the top of the price channel act as a tough area of resistance for the defensive sector, coinciding with bottoms in the SP500. If history were to repeat again, and the ratio was to reverse off the price channel resistance, it would suggest there is a bit more pain ahead in the broad market as the ratio rises to encounter the resistance line. It would also suggest we are nearing the end of the correction. Of course, that is just one small piece of the puzzle, in the next SP500 update, we’ll be diving into earnings, a big narrative amongst market participants is that we should expect earnings to be collapsing in the next couple of quarters which would take the SP500 down significantly from current levels (in a similar fashion to what we saw in 2008). We’ll be taking an in-depth look at whether or not we should expect that to play out.
Here is today’s youtube video:
I am glad to see you reconsider your thesis that the breadth indicators point to a new bull run. Obviously that has not played out as expected. Regarding earnings, i have not heard many people say they expect them to collapse. Perhaps Jeremy Grantham and Michael Burry who have predicted the mother of all asset bubbles popping. Most people I follow who are negative on the market — there are plenty who are constructive — see an earnings slowdown rather than a collapse. Especially in 2023 where S&P earnings estimates are still pretty high = $243. The market has priced in very slight declining earnings in 2023 imo if we use S&P 500 3900 and 18 PE of around $216, which is below consensus 2022 earnings of $225. It is also possible the market instead is pricing in higher interest rates and reducing the PE multiple accordingly. 3900 is about fair value if you factor in higher interest rates and a mild recession which caps 2023 earnings at around $215 which represents zero earnings growth year over year.
Thank you for your thoughts. Keep an eye out for our earnings piece.
Thanks
Great article and video. This has to happen every once in a while. I put my bet in today. We will see what happens. Don\’t forget about crypto. This is by far your biggest chance to bet on absolutely outrageous returns and most of the risk has been sold off.
Glad you enjoyed it!
I find it difficult to identify key turning points in the market despite following your guidance closely. The trouble is that the turning points are reached when you are not making a post, and I don’t have updated charts in front of me to see that the market is reaching a trend line where you have predicted a reversal. It would help to have a heads up when that is happening, so that we can play the higher probabilities found at those points more effectively.
It’s for this purpose we have the Trading Room. Perhaps you should check it out and feel free to pose market timing questions there.
I was looking at this Breadth myself just the other day & couldn\’t find any predictive bearish market correlations at all, but the chart history only goes back to 2007 which is a shame. Only when you change the timeframe to monthly does the position of the closes change & if you look at both the 50 & 200 then you can potentially see room for some more downside. Be interesting to see whether the daily breadth prints its first anomaly since 2007. Though looking at the 200 Breadth chart historical patterns rejecting off a 2008 bear market trend line you could argue that we are in the date range of June 08 to Sept 08.
This is the answer to a question I asked previously. Thank you!!!! Hey, BTC looks like it may be in a basing pattern. Any updates?
We just published a new piece on BTC:
https://www.gameoftrades.net/what-the-dollar-does-from-here-will-seal-bitcoins-fate/
Keep the great job.
My thoughts.
FED is still tightening and increasing interest rates, which is risk off and not good for the mega caps. Job numbers and PMIs ares till constructive giving the FED room to keep tightening and increasing rates, ie they are not hurting the economy or jobs. This has to be bearish until we get a significant pivot. I suspect, noting I haven’t looked into it, but in 2011, the FED was probably easing into the lows, allowing for a risk on sentiment and a continuation of the Bull market. As you pointed out, the last real support is not far away. If this breaks, you would assume the June lows are tested and perhaps more downside as the Bulls are liquidated.
My short term thesis, with the divergent lows on the 4hour chart, is we get a decent bounce back to the trend line, trapping in more bulls, and then a dump to the June lows. Either way, I’m staying out of the market except for some intraday trading, where price action is a bit easier to determine.
Keep up the great analysis GOT.
Agreed. I have been consistent in stating my opinion that the FED goes higher, mostly because that is what they are clearly stating they intend to do. Especially if economic data supports their ability to raise rates to fight inflation. They have also stated they intend to raise rates and at best hold them there for an extended period of time.
The only scenario I see for a FED pivot is a really bad economy. And a really bad economy is bad for stocks at least in the short term though the market could bounce on the pivot in a don’t fight the FED reaction.
Very helpful video. The problem I have with many videos on the subject is that we are dealing with a 100 year event and data of the last pandemic is scant. The disruption is on a world scale and world wars are a real possibility because of the dislocations and risks to leaders that are in trouble and want to change the focus from them. The whiplash effect of markets is going to get worse before it evens out in two years. I think when looking at things you should assume it will be the exception to the past situations and not follow the rules we have seen. All things considered this is a bad time for this to happen so close after the GFC.
Thanks for your comment. We agree that there are a lot of worrisome events happening in the world.