Summary:
- Bitcoin has been lagging equities since the market bottomed in mid-June.
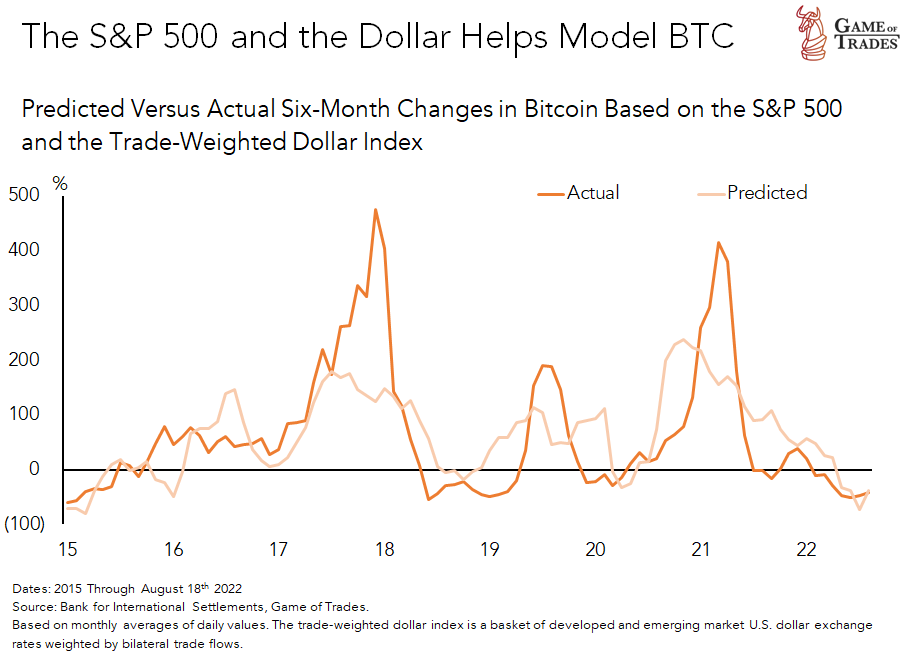
- The best returns to Bitcoin are seen when the rise in the S&P 500 happens gradually, when the VIX is very low and when the dollar weakens the most.
- Two powerful forces have driven the recent appreciation of the dollar: its role as a haven in an environment of rising uncertainty in the global economy and the tightening of monetary policy in the U.S. relative to its global counterparts.
- Our bias for the dollar is negative as there’s potential for the dollar to fall consistent with the Fed relenting. Still, there’s also the aspect of the uncertainty in Europe that might continue to prove a headwind.
- Our research suggests that many of the worries regarding the two current main driving forces of the dollar have been priced in the market.
- We built a model predicting Bitcoin’s volatility with the dollar and equities: idiosyncratic events seem to exacerbate the interest in Bitcoin, which has a genesis in a weaker dollar, low volatility, and rising stocks,
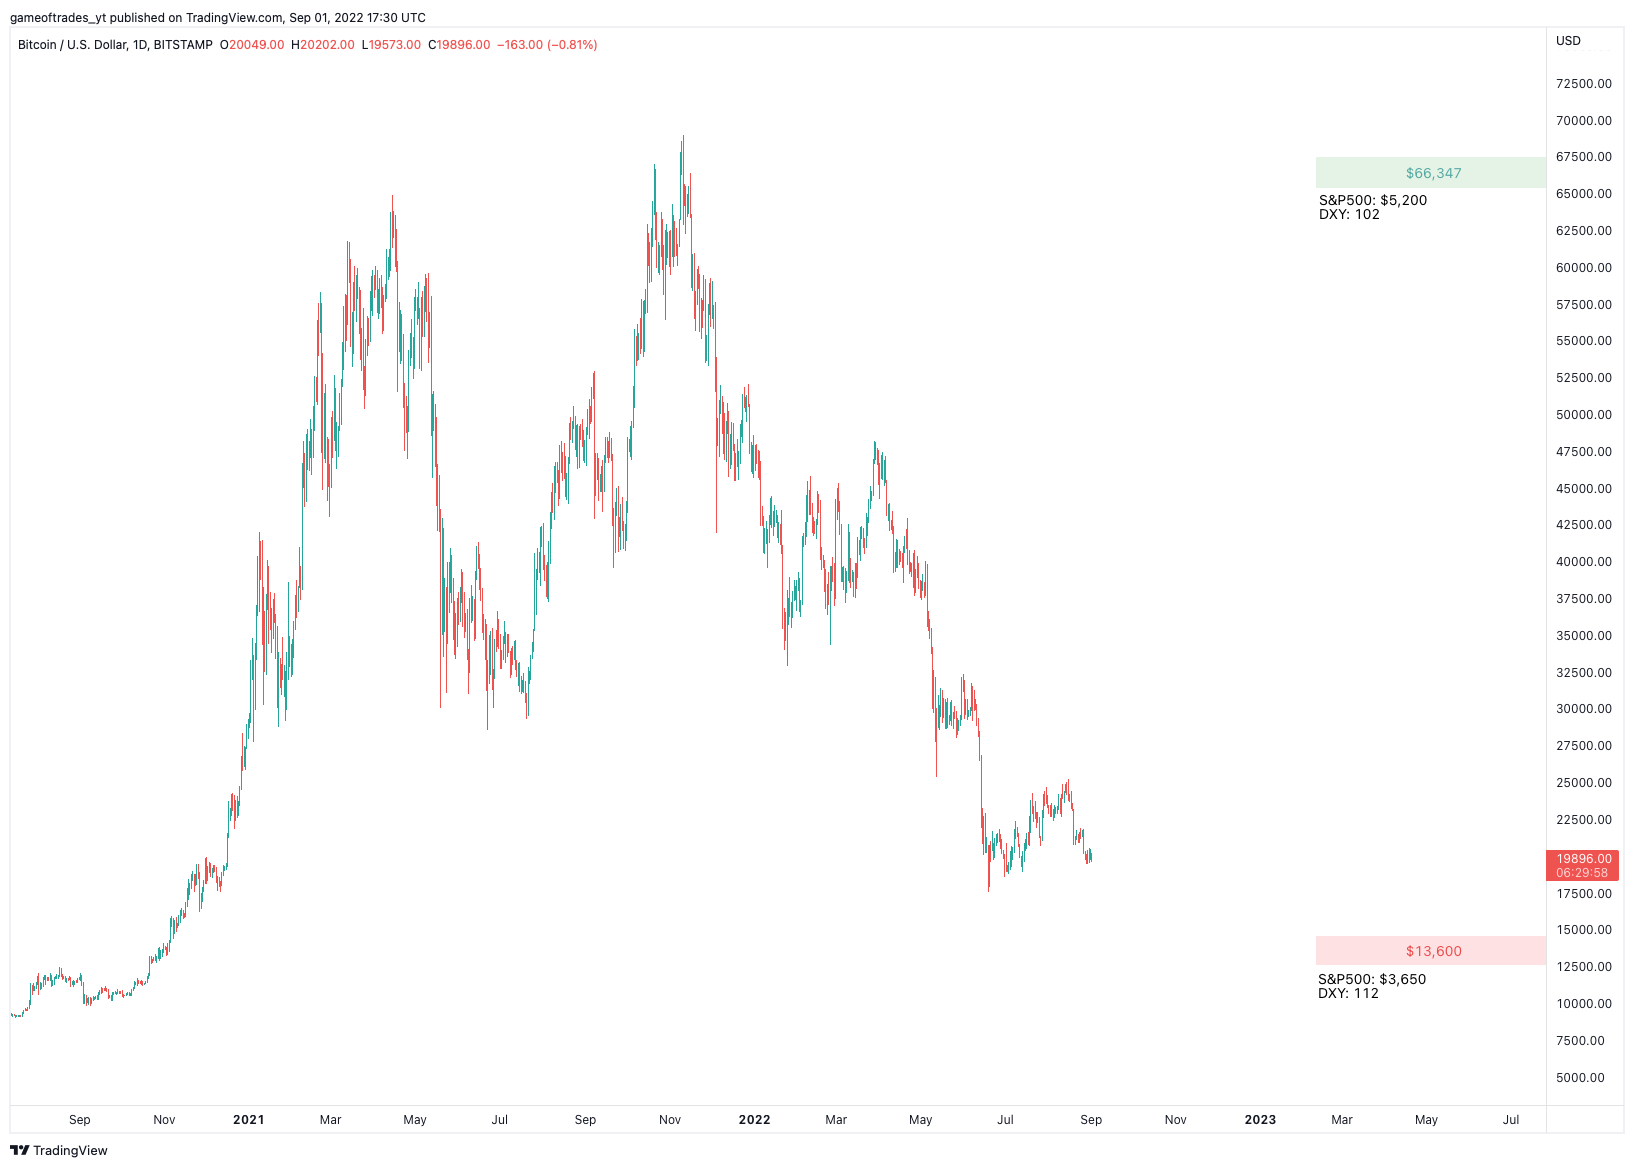
- Our model predicts a target of $66,347 in a bullish scenario and a target of $13,600 in a bearish scenario.
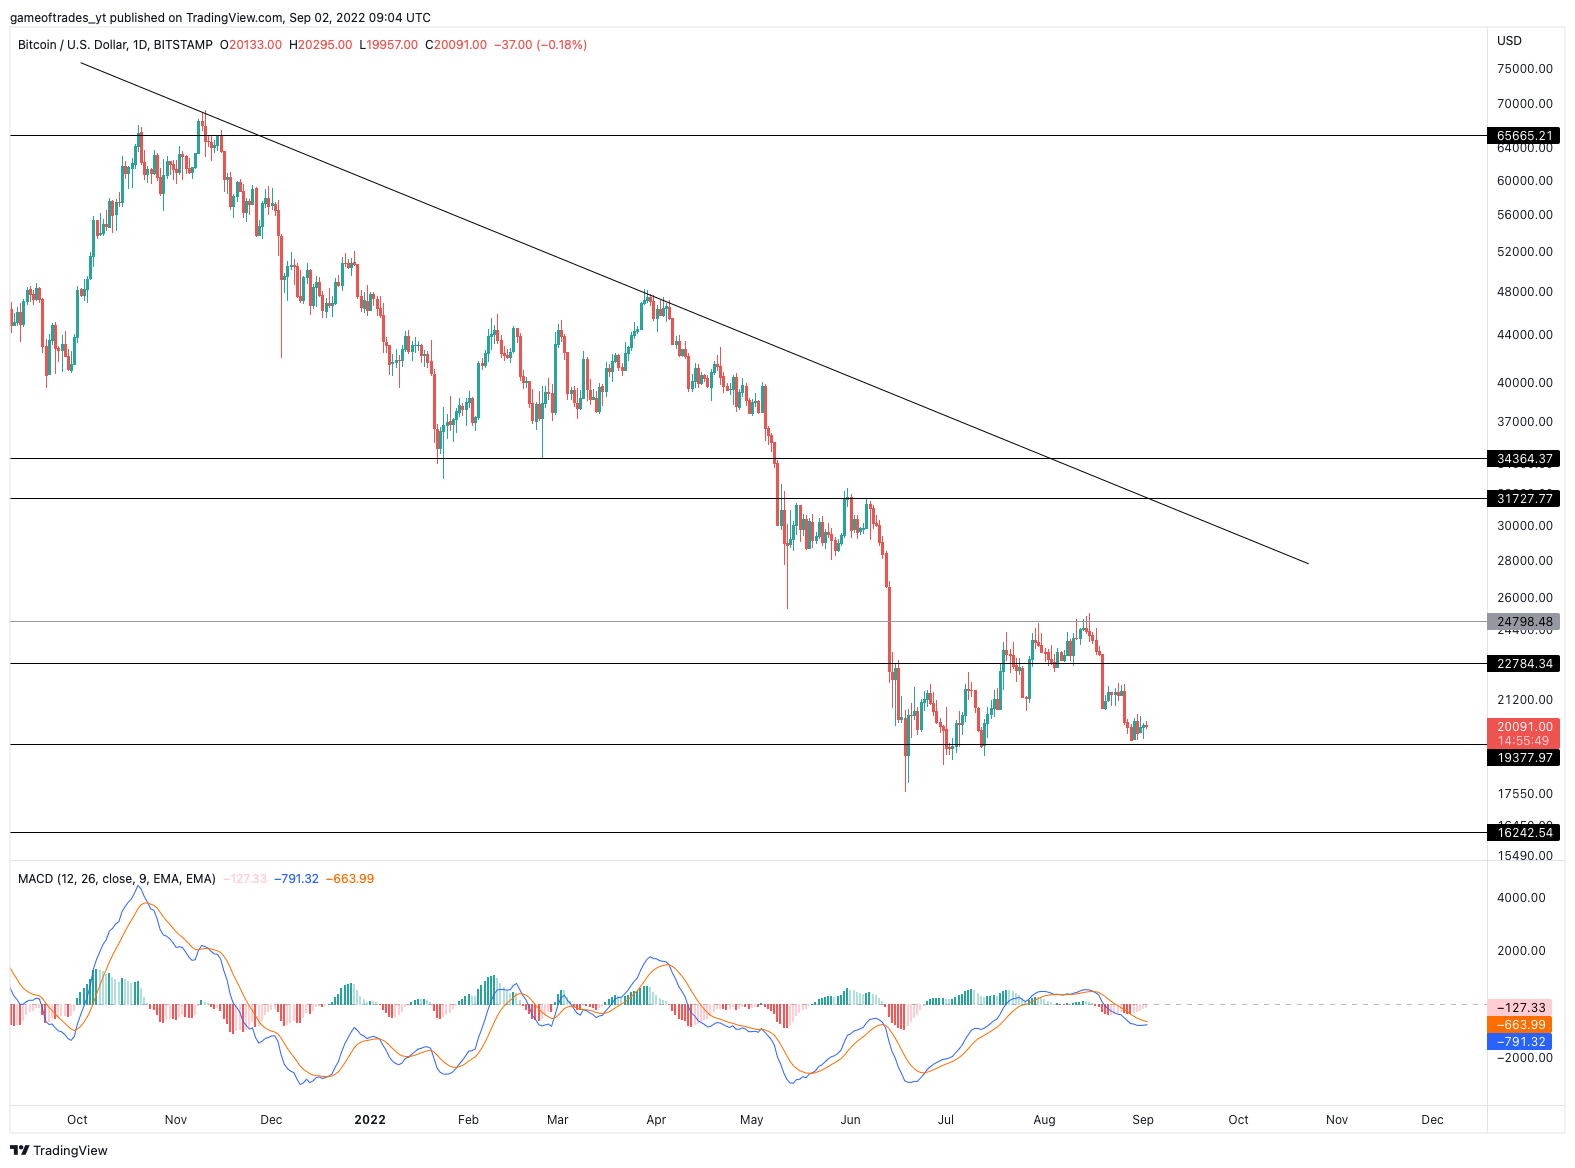
- Momentum on the weekly time frame is still bearish, but the MACD confirmed a bullish cross indicating that downside momentum might be reversing.
- Bitcoin continues to trade between support ($20k) and resistance ($23k). Meaningful signals will be generated from either a breakout or a breakdown of that range.
- Bitcoin historically finds it’s low with the equity market; in other words, there is no reason to expect Bitcoin to find a new low if equities don’t.
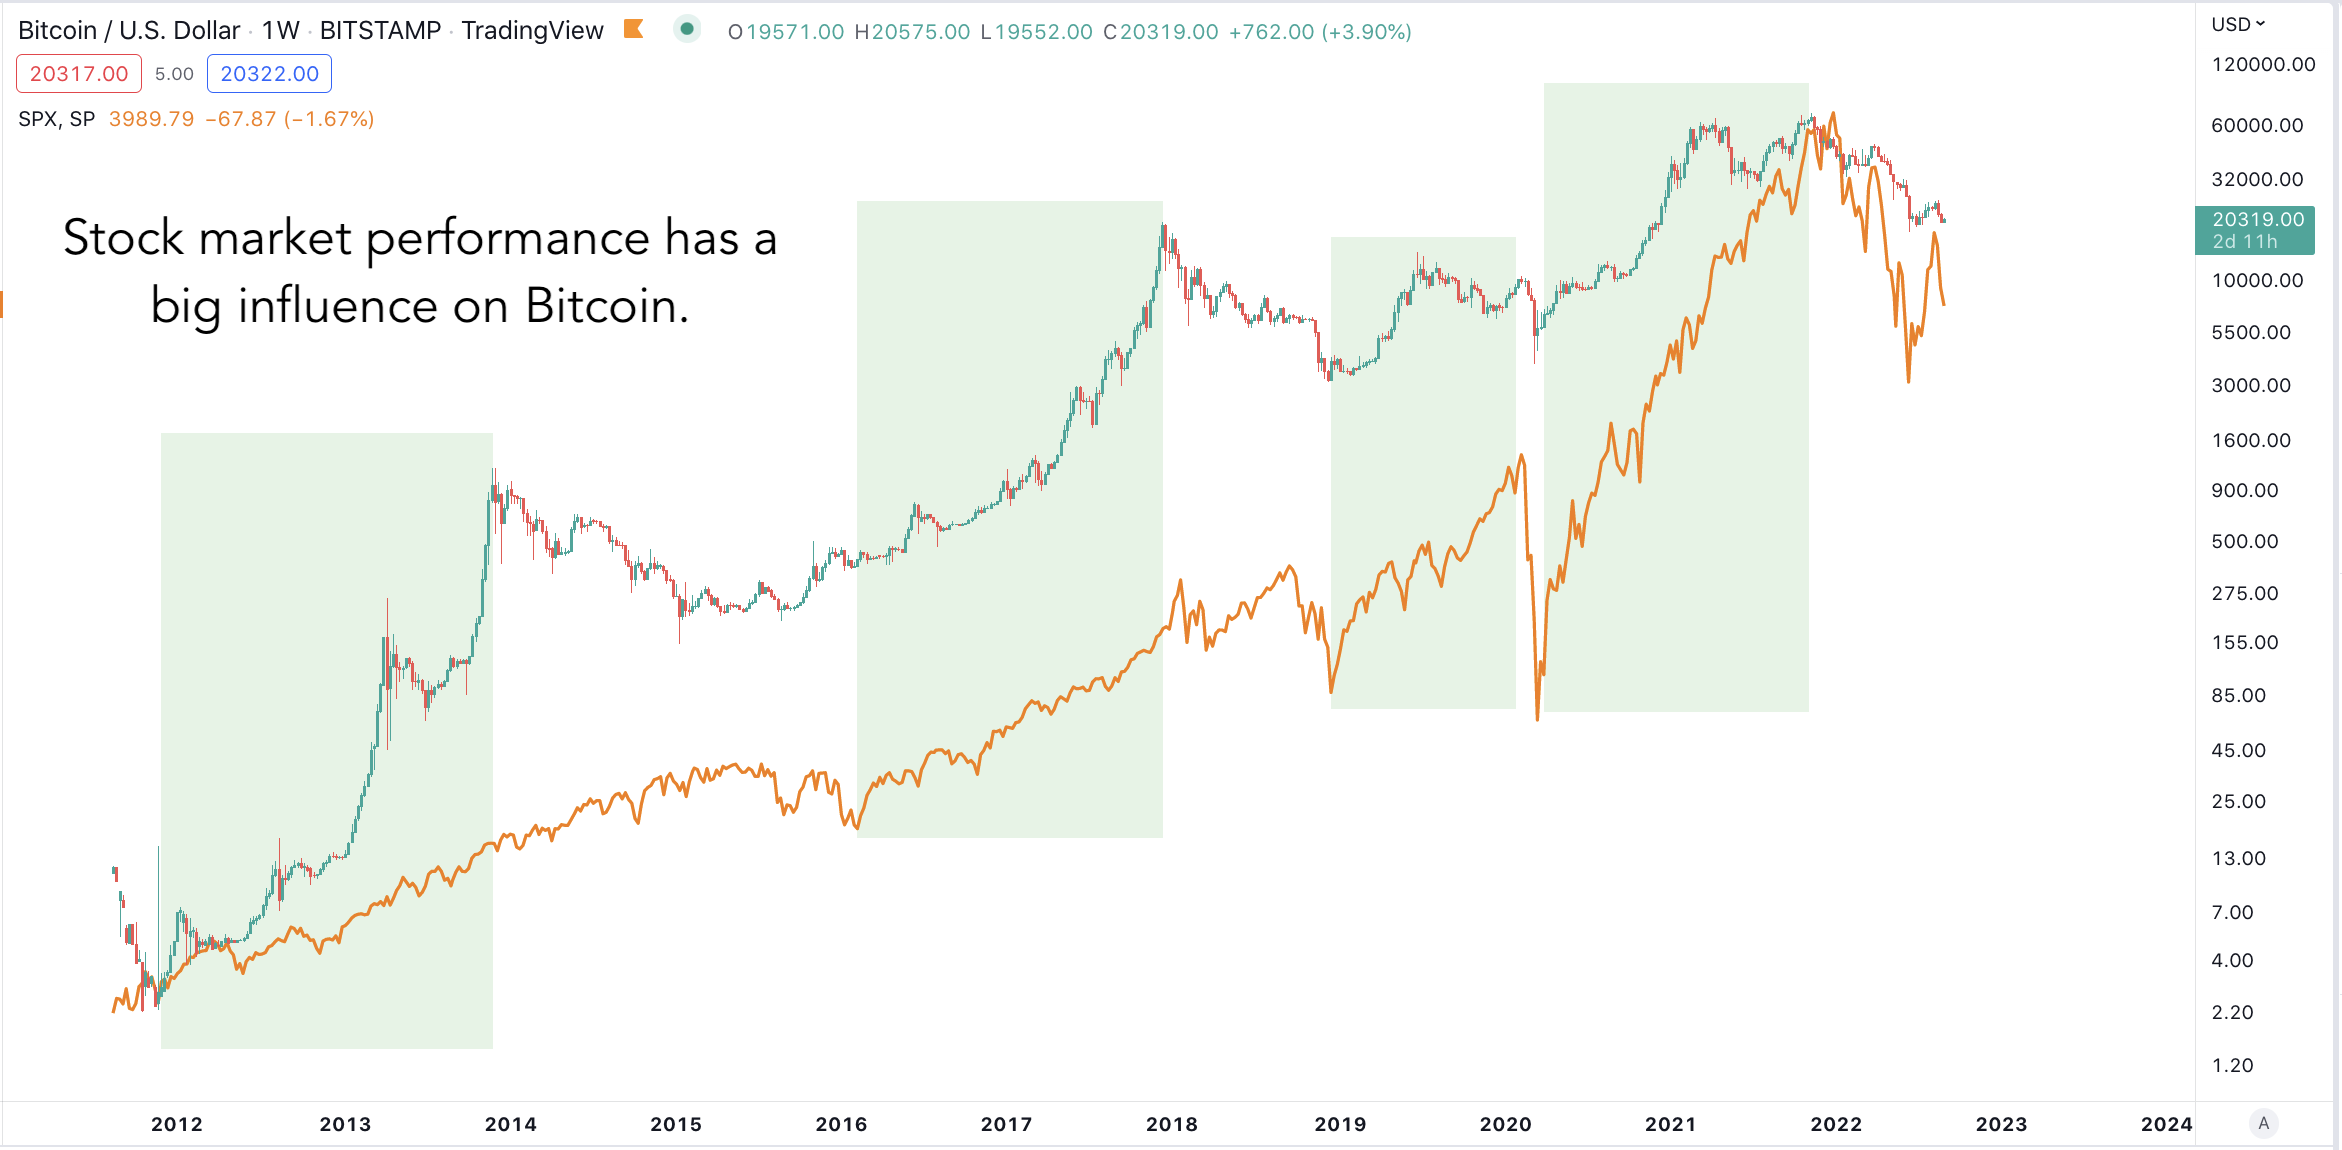
Bitcoin’s Unimpressive Performance Despite a Surging Stock Market.
The recent rally in equities since the June lows disappointed many Bitcoin investors, expecting outperformance when equities picked up. Bitcoin has underperformed since the market bottomed, and as we’ve highlighted in previous articles, this does not fall out of line with how Bitcoin usually behaves. This article will dive deeper into one of the key driving factors of Bitcoin, the USD.
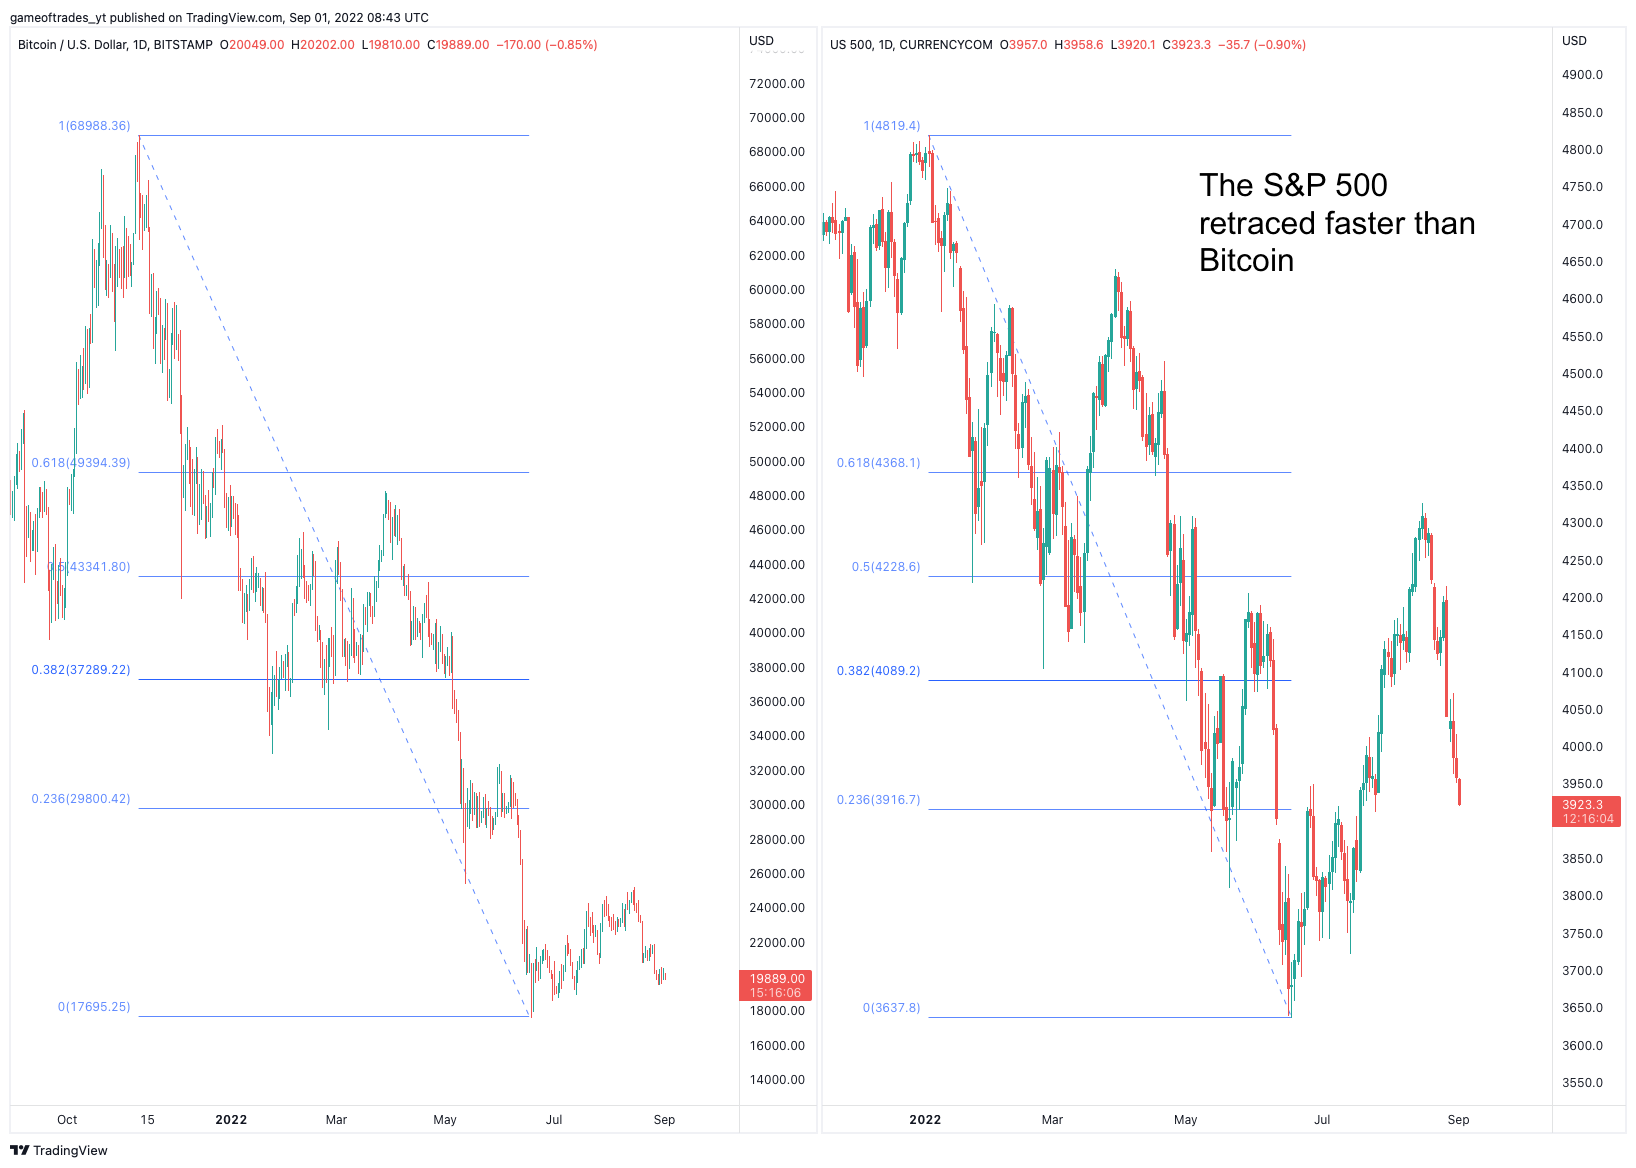
In the aftermath of the pandemic, Bitcoin came to embody a high beta play on stocks. That said, it struggled to find a footing this year, even after the market bottomed in mid-June. Bitcoin historically outpaces stocks coming off bottoms in the market and proves to be a highly-levered bet on stocks. However, in a previous article, we have highlighted our reasons to expect why Bitcoin might initially lag equities coming out of the market bottom. Bitcoin doesn’t show the “rapid recovery” behavior we see on the stock market after a deep sell-off. It takes a multi-month bottoming process for the digital coin to recover from its downtrend. This time is no different, and our thesis proves to be correct so far, with Bitcoin lagging equities since the market bottomed in mid-June. The S&P 500 is trading at the 0.236 retracement level from the ATH, while Bitcoin still trades near the June lows. This chart confirms that Bitcoin is again waiting for confirmation that the risk-on move has legs before accelerating higher.
The macro drivers of Bitcoin’s price action include equities, the market’s volatility, and the dollar. In a previous article, we addressed Bitcoin’s relationship with equities. We found that the best returns to Bitcoin are seen when the rise in the S&P 500 happens gradually, as investors rotate into riskier assets seeking higher yields. We expect to return to that environment over the next 6-12 months. Bitcoin might underperform equities in the short-term, but our research indicates that Bitcoin historically finds its low with the equity market; in other words, there is no reason to expect Bitcoin to find a new low if equities don’t. We also found that Bitcoin outperforms in lower volatility regimes. The best returns occur when the VIX is very low, and the biggest daily drawdowns happen when VIX is very high. The market is pricing in lower volatility for the remainder of 2022 than it was a month ago, which is positive for Bitcoin. However, the VIX futures curve also indicates that the market continues to anticipate high volatility in the short term, which would be a headwind for Bitcoin’s performance.
Bitcoin’s Moves are Anti-Correlated to the Dollar’s
Bitcoin’s road to regaining the leadership looks perilous, with uncertainty around the global economy posing a major headwind to the risky asset. Those concerns are imbued into the U.S. dollar, a proxy for global economic uncertainty and aggressive Fed monetary policy. What the greenback does from here will seal Bitcoin’s fate. Our bias for the dollar is negative as there’s potential for the dollar to fall consistent with the Fed relenting. Still, there’s also the aspect of the uncertainty in Europe that might continue to prove a headwind. This research delves deeper into Bitcoin’s relationship with the dollar.
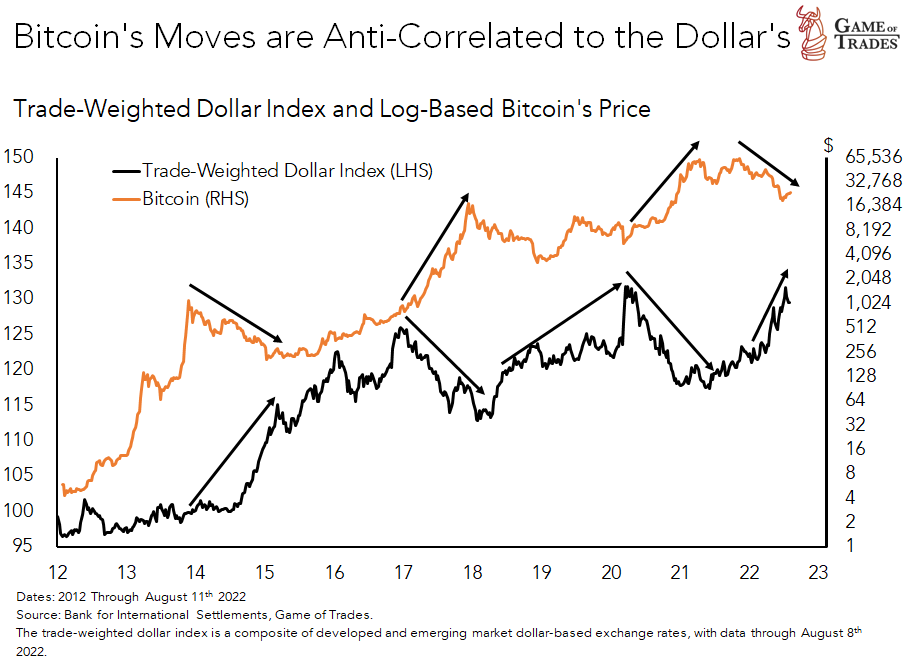
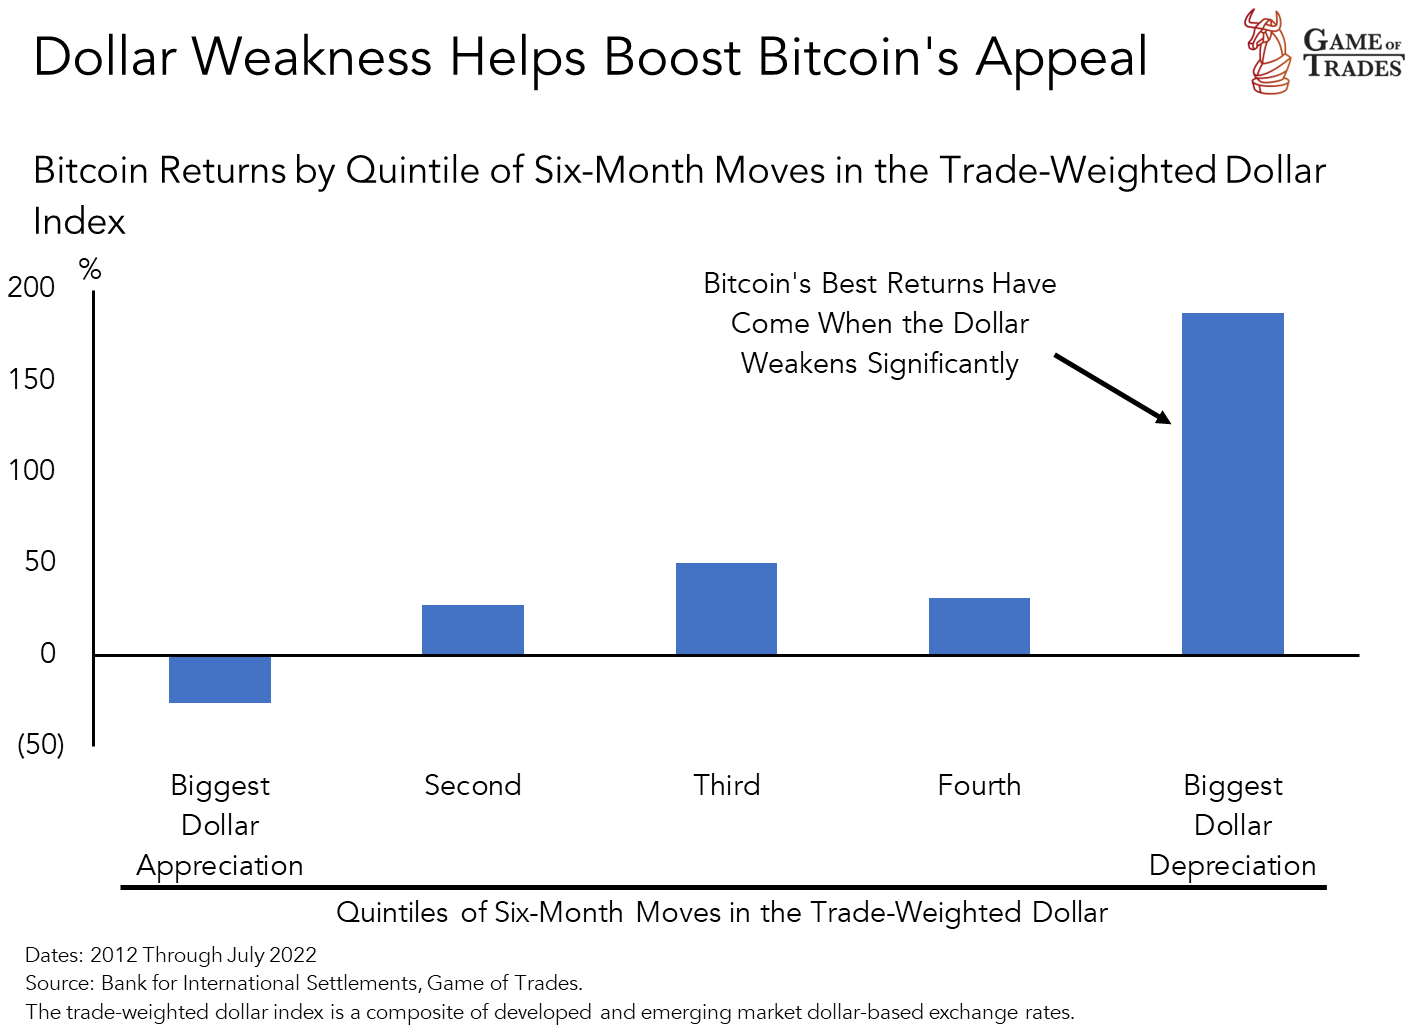
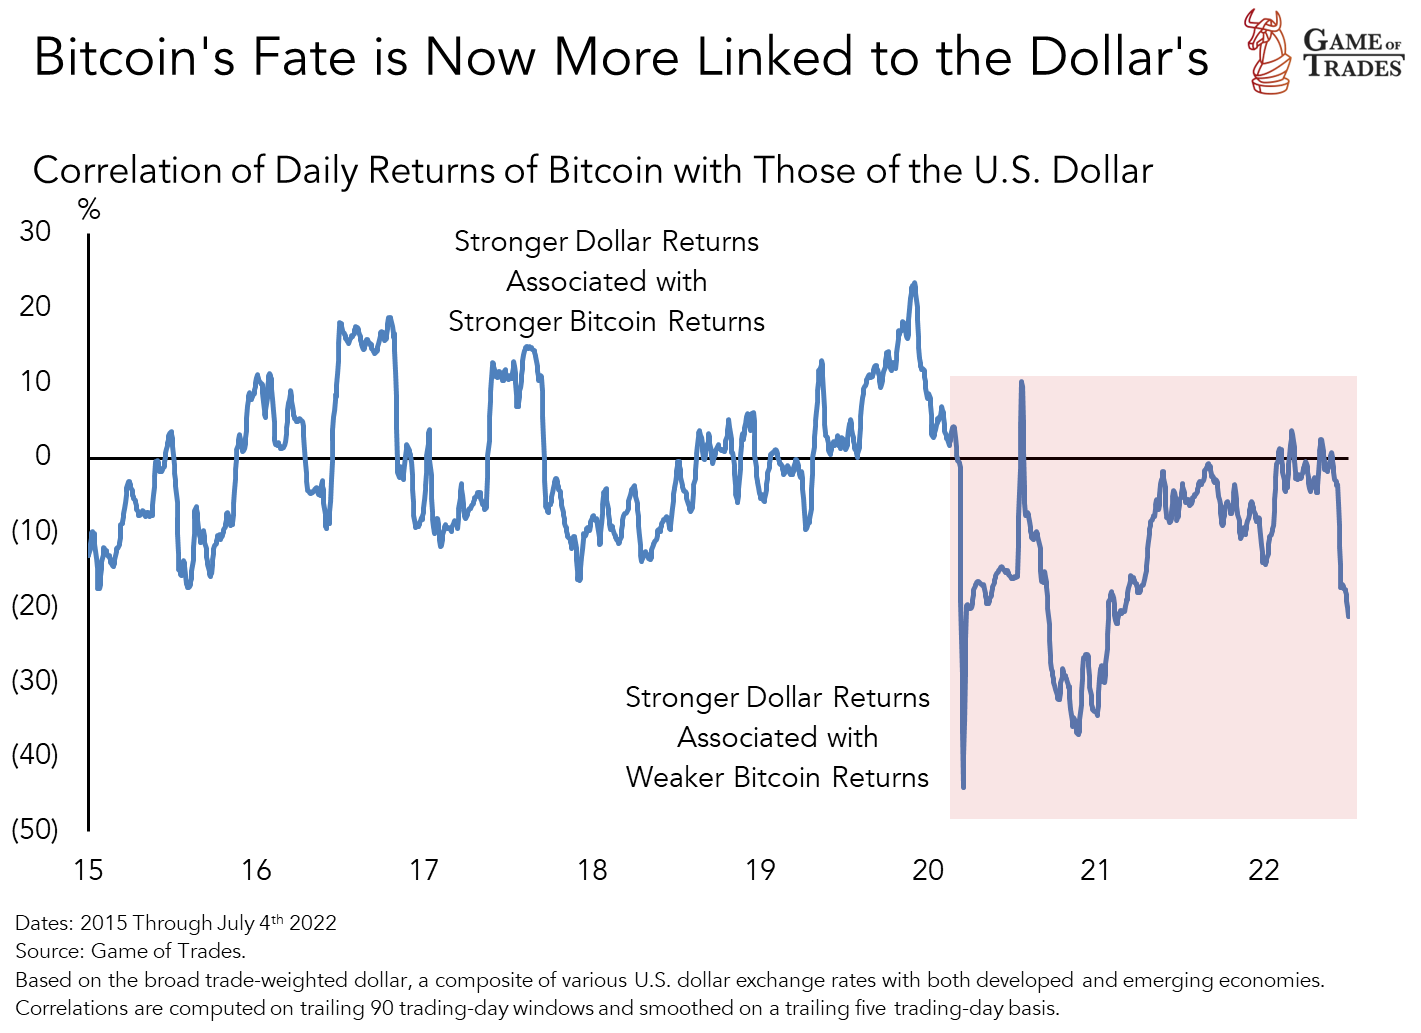
Bitcoin’s price action has historically been inversely correlated with the dollar. A weak dollar leads to Bitcoin price gains, while a strong dollar generally proves to be a headwind. If we break up the six-month returns for the trade-weighted dollar by quintile, we find the best returns for Bitcoin were seen when the dollar weakens the most. We also note that the most significant dollar appreciations tend to correspond with negative returns for Bitcoin.
Over the long term, there is an asymmetry when comparing the biggest dollar depreciation with the biggest appreciation, with a bias toward being bullish on Bitcoin. That is consistent with our view that liquidity and currency debasement are the predominant drivers of Bitcoin.
The negative correlation became more evident post-pandemic, with the dollar playing an even more prominent role in Bitcoin’s price action. The pandemic marked the beginning of a new era where the correlation between Bitcoin and the USD turned persistently negative (i.e., Bitcoin rises when the USD falls). Of course, it remains to be seen if that dynamic continues to play out.
The Driving Forces of the Dollar
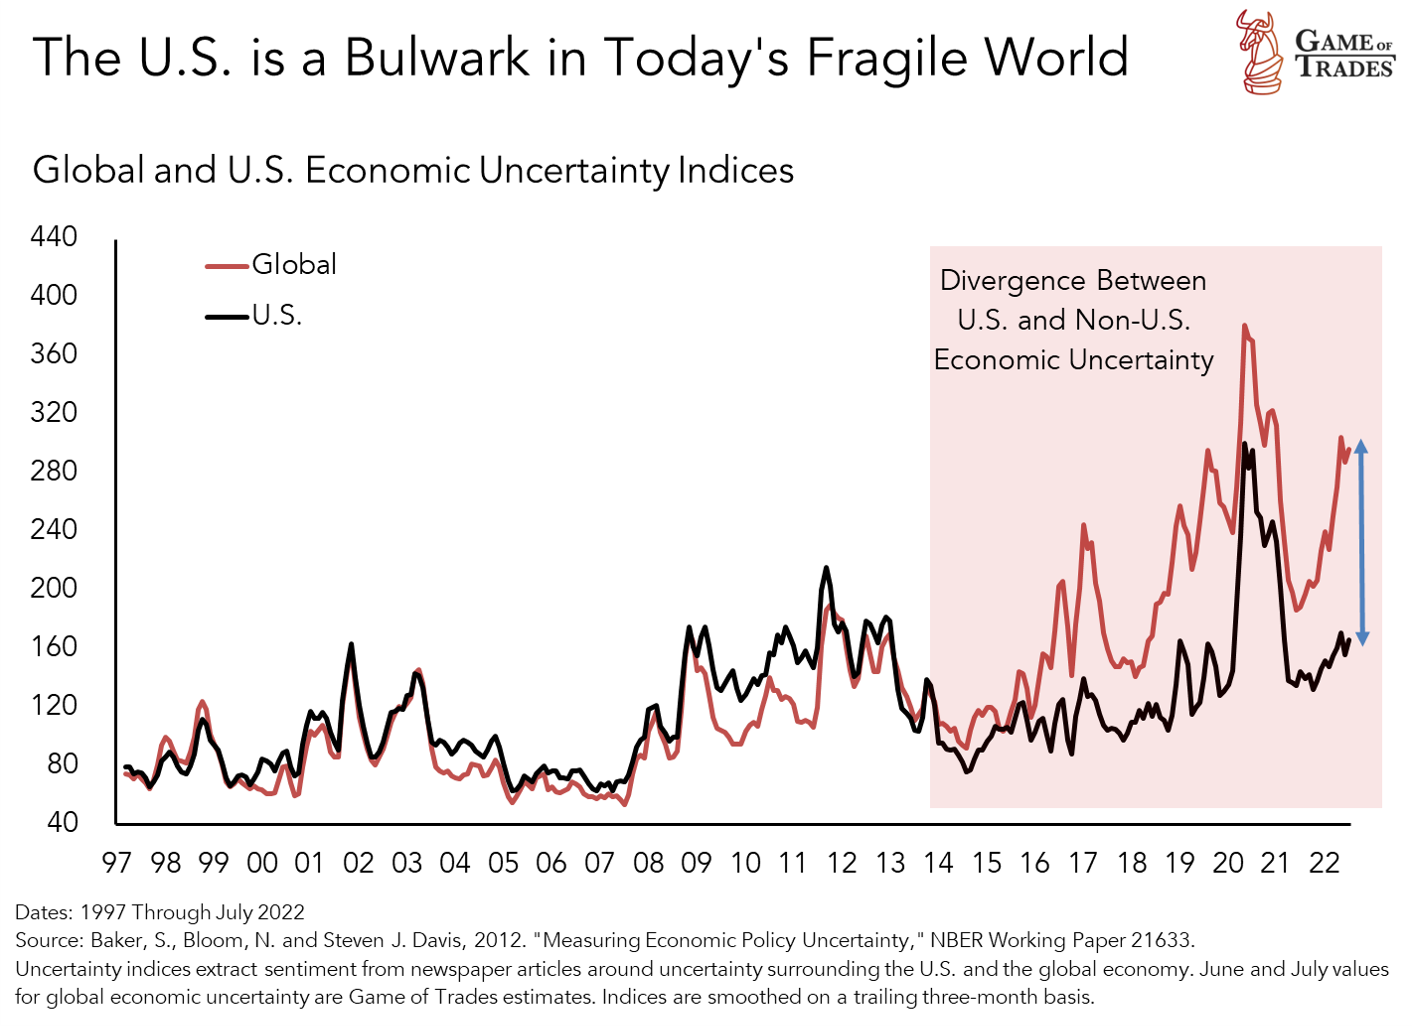
Two powerful forces have driven the recent appreciation of the dollar. One has been the dollar’s role as a haven in an environment of rising uncertainty in the global economy, which has accelerated post-pandemic. In the last year, the concerns have centered on Europe, the epicenter of the energy crunch. These developments outside the U.S. are unpredictable factors for the dollar and indirectly for Bitcoin. However, a de-escalation of the conflict in Ukraine could make E.C.B. rate hikes more credible, as uncertainty regarding the path of inflation and growth in Europe would recede.
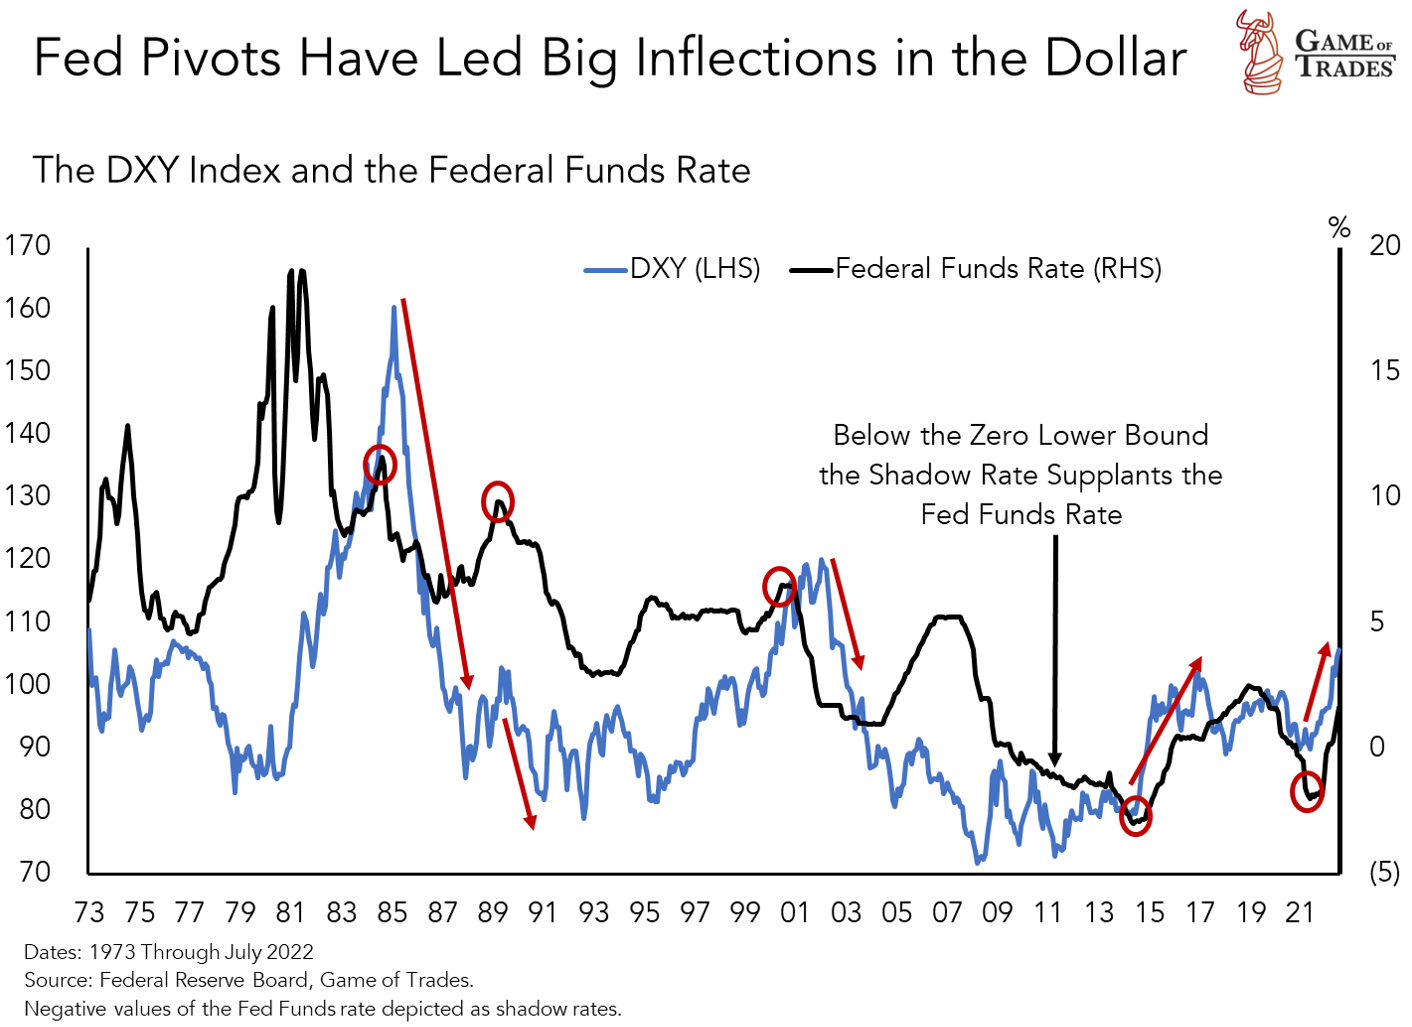
The second driver of dollar strength has been the tightening of monetary policy in the U.S., as that economy has fared much better than its global counterparts in the post-crisis years. Looser monetary policy in the U.S., due to either a weakening economy or peaking inflation, could also bear down on the dollar. The latter has been our base case; hence, we don’t see many runways for Fed aggressiveness to add to dollar strength incrementally. If the economy continues to slow and inflation readings fall, it will increase the odds of a Fed pivot, leading to weakness in the dollar and proving to be a significant tailwind for Bitcoin. The chart below depicts instances when changes in the Fed’s stance have led to or coincided with big inflection points in the DXY (i.e., the dollar index).
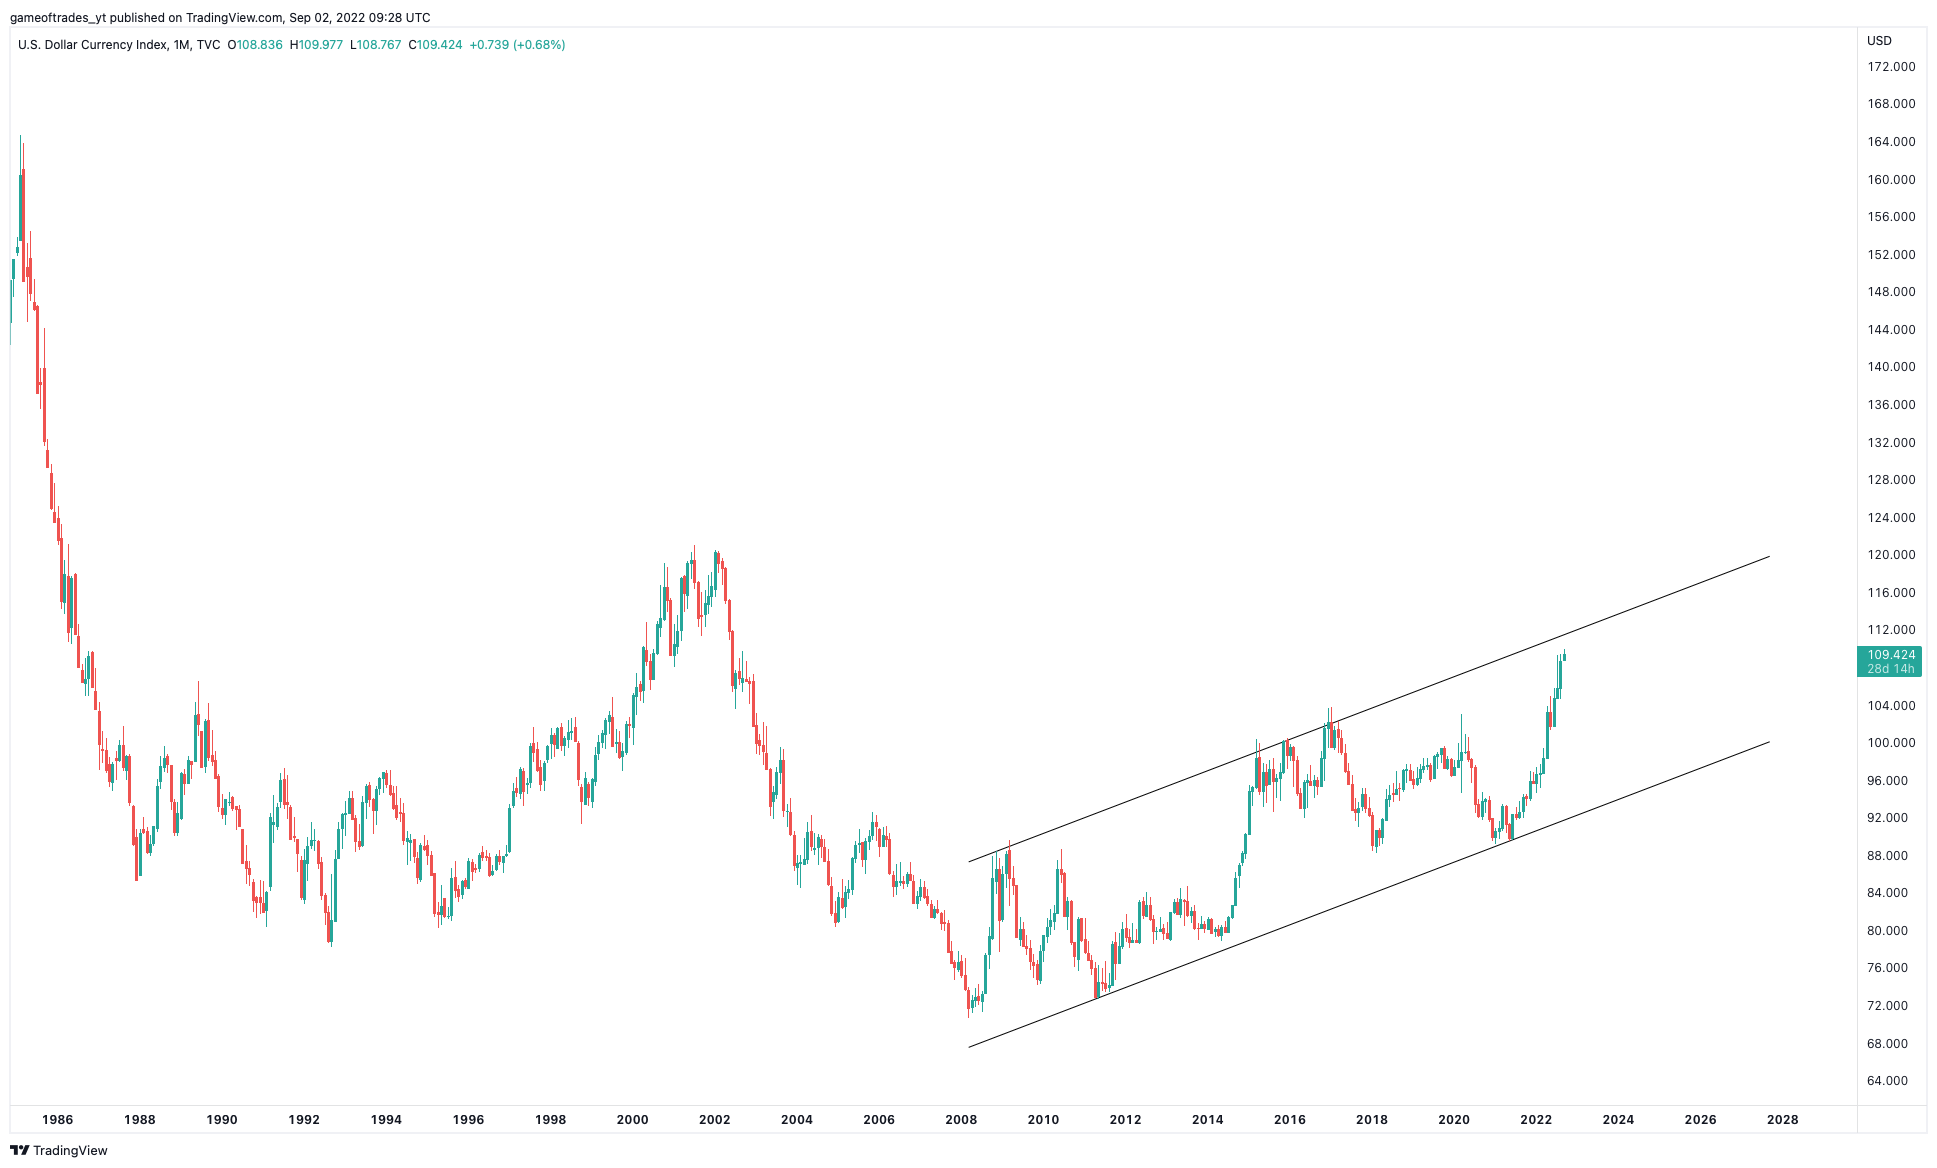
Our research suggests that many of the worries regarding the two current main driving forces of the dollar (global uncertainty and monetary policy) have been priced in the market. That’s enough for us to take on a negative bias on the dollar. That said, if we look at monthly price developments on a tradable dollar index like the DXY, the currency could have a little more room to run from a technical standpoint and continue to keep a lid on Bitcoin in the short-term.
Equities and the Dollar Don’t Entirely Account for Bitcoin’s Volatility
Given Bitcoin’s strong correlation with the dollar and equities, we built a model predicting Bitcoin’s volatility with these two factors. We found out they account for about 40% of Bitcoin’s volatility. The model did not capture a lot of Bitcoin volatility in 2017 and early 2021, so other factors were driving Bitcoin outside the moves in equities and the dollar. This can be attributed to speculative euphoria, idiosyncratic to Bitcoin, and high volatility assets, as we’ll briefly discuss below.
Easy financial conditions post-pandemic were a significant tailwind for Bitcoin. The first round of stimulus did not significantly impact risk assets as COVID kept the environment highly uncertain. However, the second round of stimulus did have a significant impact. It led to an environment that fostered a frenzy of retail speculation, leading to the meme stock mania and a parabolic rise in Bitcoin, which overshot our model accounting only for the dollar and equities.
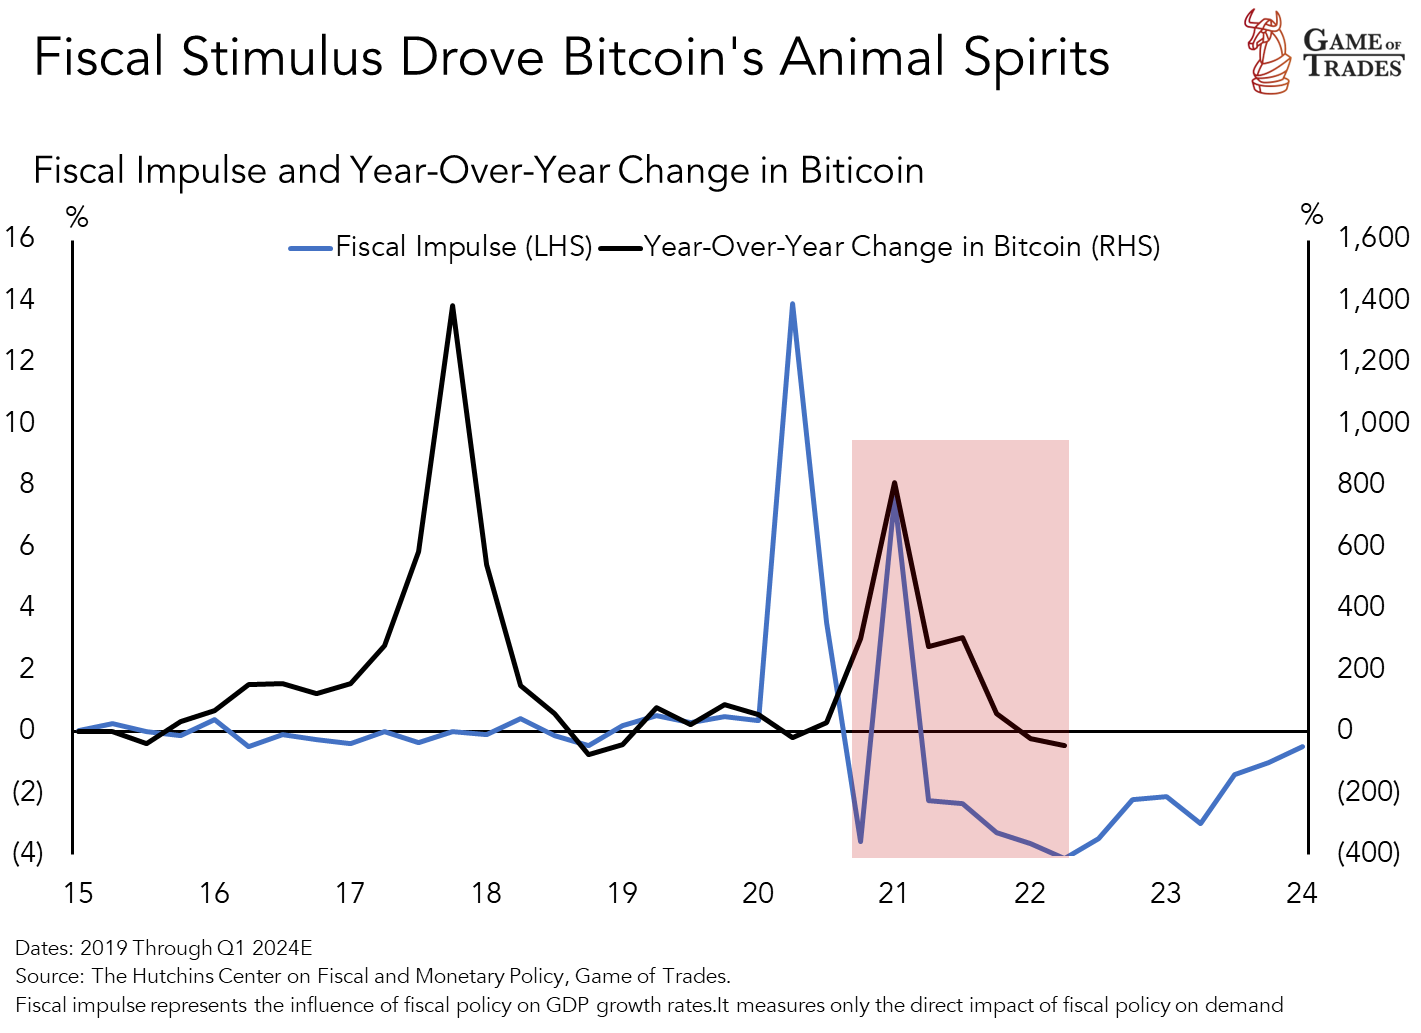
In 2017, I.C.O.s (initial coin offerings) and token sales became very popular. At the start of October 2017, I.C.O. coin sales worth $2.3 billion had been conducted during the year, more than ten times as much as in all of 2016. These altcoins were bought and traded in Bitcoin pairs on exchanges in 2017, while they are now traded in USD pairs. The billions of dollars raised for hundreds of these projects pushed the demand for Bitcoin amidst that immense speculative frenzy.
In summary, we believe idiosyncratic events exacerbate the interest in Bitcoin, which has a genesis in a weaker dollar, low volatility, and rising stocks. Investors in Bitcoin stand to gain a significant edge if they understand how it’s connected to the broader macroeconomic narratives.
Bitcoin’s risk-reward is attractive
With a good understanding of Bitcoin’s macro driving forces (i.e., equities and the dollar), the natural question now turns to where Bitcoin is headed. We leveraged the predictive model above to understand how Bitcoin will be valued in bullish and bearish scenarios.
In the bullish scenario, the S&P 500 reaches our target of $5,200 within 6-12 months, DXY reverses to its technical support of 102, and we obtain a target of $66,347 for Bitcoin.
In the bearish scenario, the S&P 500 retests the lows at $3,650, DXY reaches its monthly channel resistance at 112, and we obtain a target of $13,600 for Bitcoin.
Our research indicates that the risk/reward for equities looking out 6-12 months is favorable. We expect major macro tailwinds like disinflation and falling bond yields to help lift the S&P 500 higher, and Bitcoin will benefit from it. The current price offers investors seeking a higher beta an excellent opportunity for accumulation.
Technical Analysis
The bearish divergences and the volume setup highlighted in the last article played out for a nice short-term correction off the recent highs. On the weekly time frame, Bitcoin crossed below the 200-week moving average, which historically corresponded to significant bottoms; the price briefly dipped below the MA in 2015 and 2020. Momentum on the weekly time frame is still bearish, but the MACD confirmed a bullish cross indicating that downside momentum might be reversing. The weekly close has to hold the range support and the June low at $20k to confirm the return of strength.
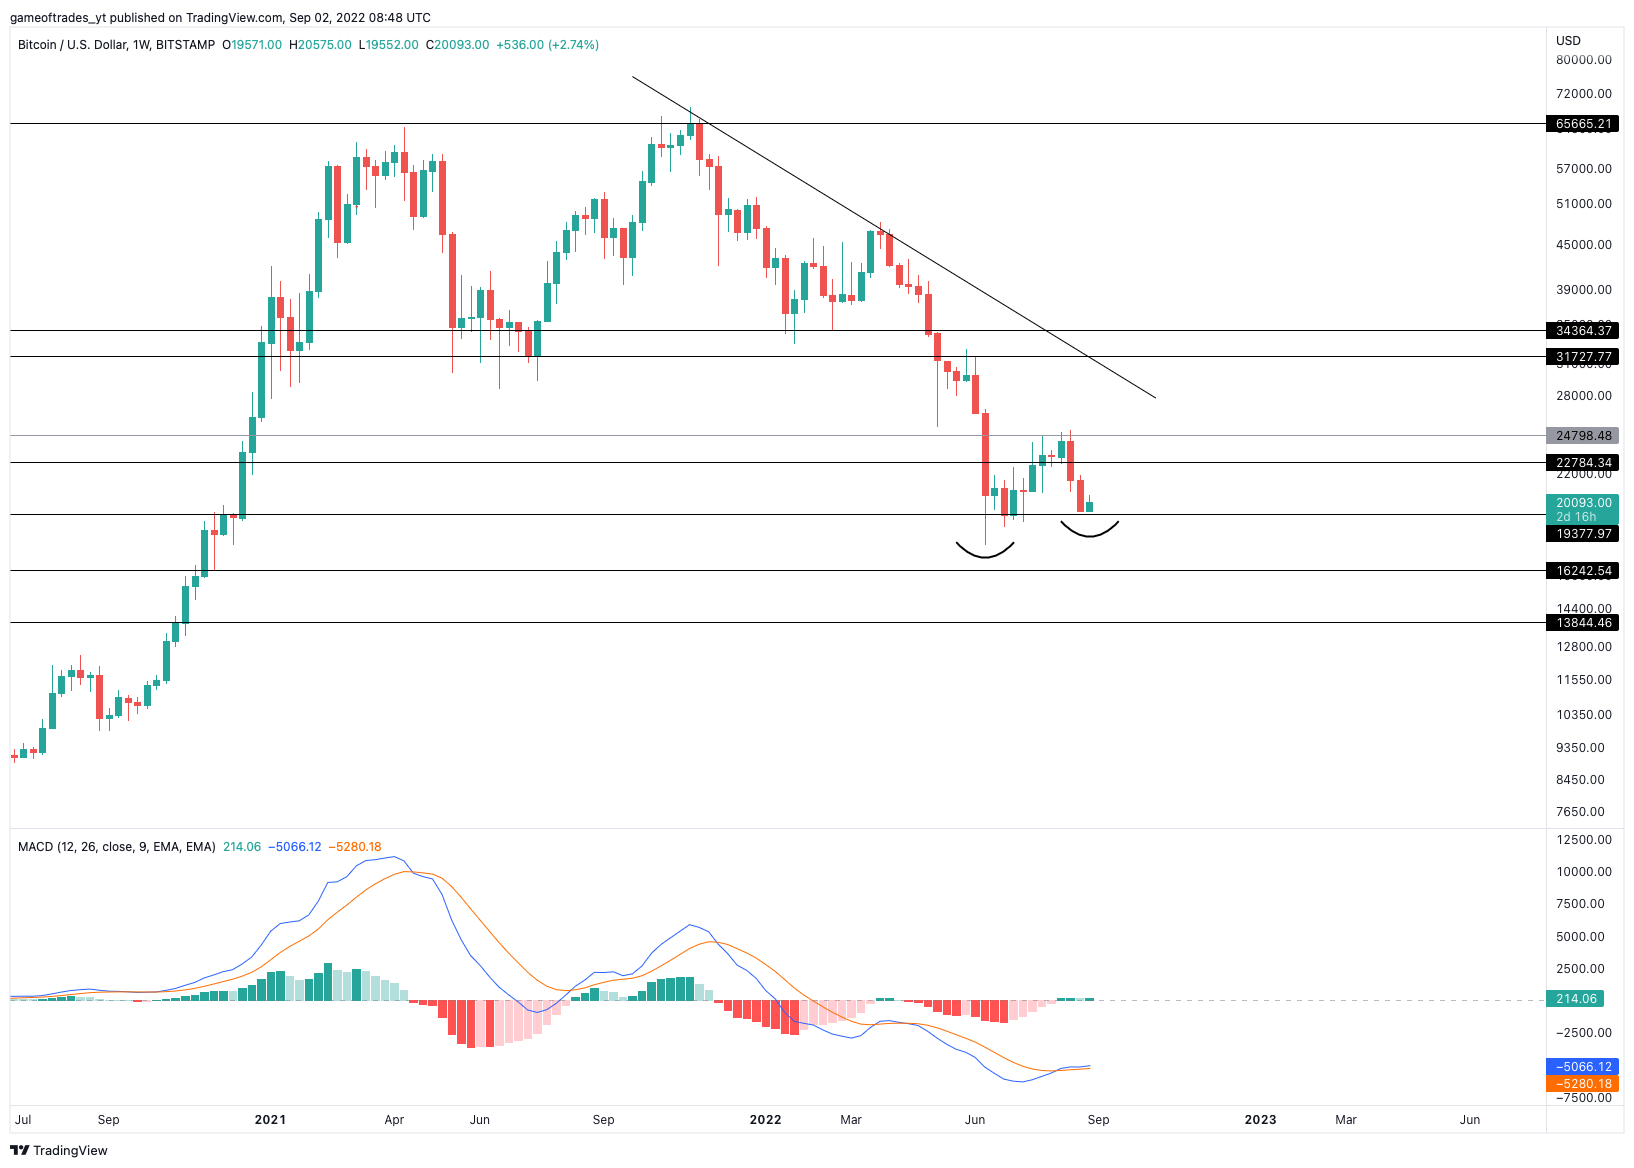
After breaking down from its parallel channel, Bitcoin continues to trade in a range between support ($20k) and resistance ($23k). Meaningful signals will be generated from either a breakout or breakdown of that range, as Bitcoin will likely move in the direction of the break. A more significant, meaningful technical reversion would only occur at $31k. The MACD crossed back below the zero line as the price tests the $20k support level again. A breakdown of this key support level could bring the monthly support at $14k back into play. However, Bitcoin historically finds its low with the equity market; in other words, there is no reason to expect Bitcoin to find a new low if equities don’t.
How about an update on the S&P, given its precarious resting point just above the last line of support before the bottom falls out? Are there any new data points that could help us prepare for what is likely coming next?
If you have a Trading Room membership, you can view our post there. If not, the quick version is — The $3,900 level and yesterday’s low are holding for now. SP500 found some buyers into the close, which is constructive.
Tuesday September 13th is the August Inflation number. If its below 8%, I think stocks should rally with the thought that inflation has “peaked”. If inflation comes in above 8%, investors will likely stay scared and we could re-test the June bottom (S&P at around 3,650).
Nice analysis, though I’m leaning towards the bearish case myself with BTC dominance indicating more bear market times ahead & there is a monthly bear flag that could lead to another breakdown in price.
Thanks for your thoughts Mok.
Strengthening dollar could be a driver for bear market, especially in recent times. Bull markets however are triggered by BTC halvings – they cause supply shock in perspective of several months after they occur. 3.png chart looks like a good correlation, but IMO it is more of a coincidence
Yes the rising dollar is a key factor.
You were right about the short term bearish technicals in the last article, much appreciated
Thanks!
I am of the opinion that inflation peaked in June. CPI Tends To Overstate Inflation Relative To PCED. August\\\’s PCED will be released on September 30 and is likely to show a lower rate of inflation. Please read more fully on why at Yardendi Research. What I, as an investor, would like to comment on is that certain categories were little affected on the latest CPI numbers. EV one of them from looking at stock action the last few months. These are meant to hold and not trade on CPI reports. So far so good for me. Thanks to @GOT for keeping us abreast as I am on board with a cautionary note of extreme volitiliy and being in quality stocks at a discount.
As we see DXY get ready to cross the prior channel I wonder if GOT has looked into the Dollar Milkshake Theory. My concern for people that trade based on trends for the last 80 years or so data is that we have an event that is a 100 year flood in a time where debt is at a record level around the world. From a technical chart the DXY looks headed to 124 right now. When you understand the Dollar Milkshake Theory and you watch inflation making the situation much worse for other countries you have to consider that BTC and stocks could have a much much lower level as the DXY rises. People will seek safety in the 2 year bond and there won\’t be enough dollars for all the currencies that are failing. Normally our system would just fail along the lines of the video from Ray Dalio\’s Changing world order. The problem with Ray\’s analysis is it leaves out one important invention that we created during WWII in the USA, the Atomic Bomb. This makes it hard for the upcoming power to take over the USA or the West Militarily. Without that they can also fail while trying to build an army big enough, because the size no longer matters. Only if China, Russia, Saudi Arabia and India throw in on a new currency and get European countries to join in one by one as the Euro fails can they have a chance to displace the USD.