Despite the current financial landscape marked by high inflation and stringent monetary tightening, US unemployment hovers at a historic low of 3.7%—a figure reminiscent of the 1960s.
The big question to consider is: when will the unemployment rate begin to trend higher?
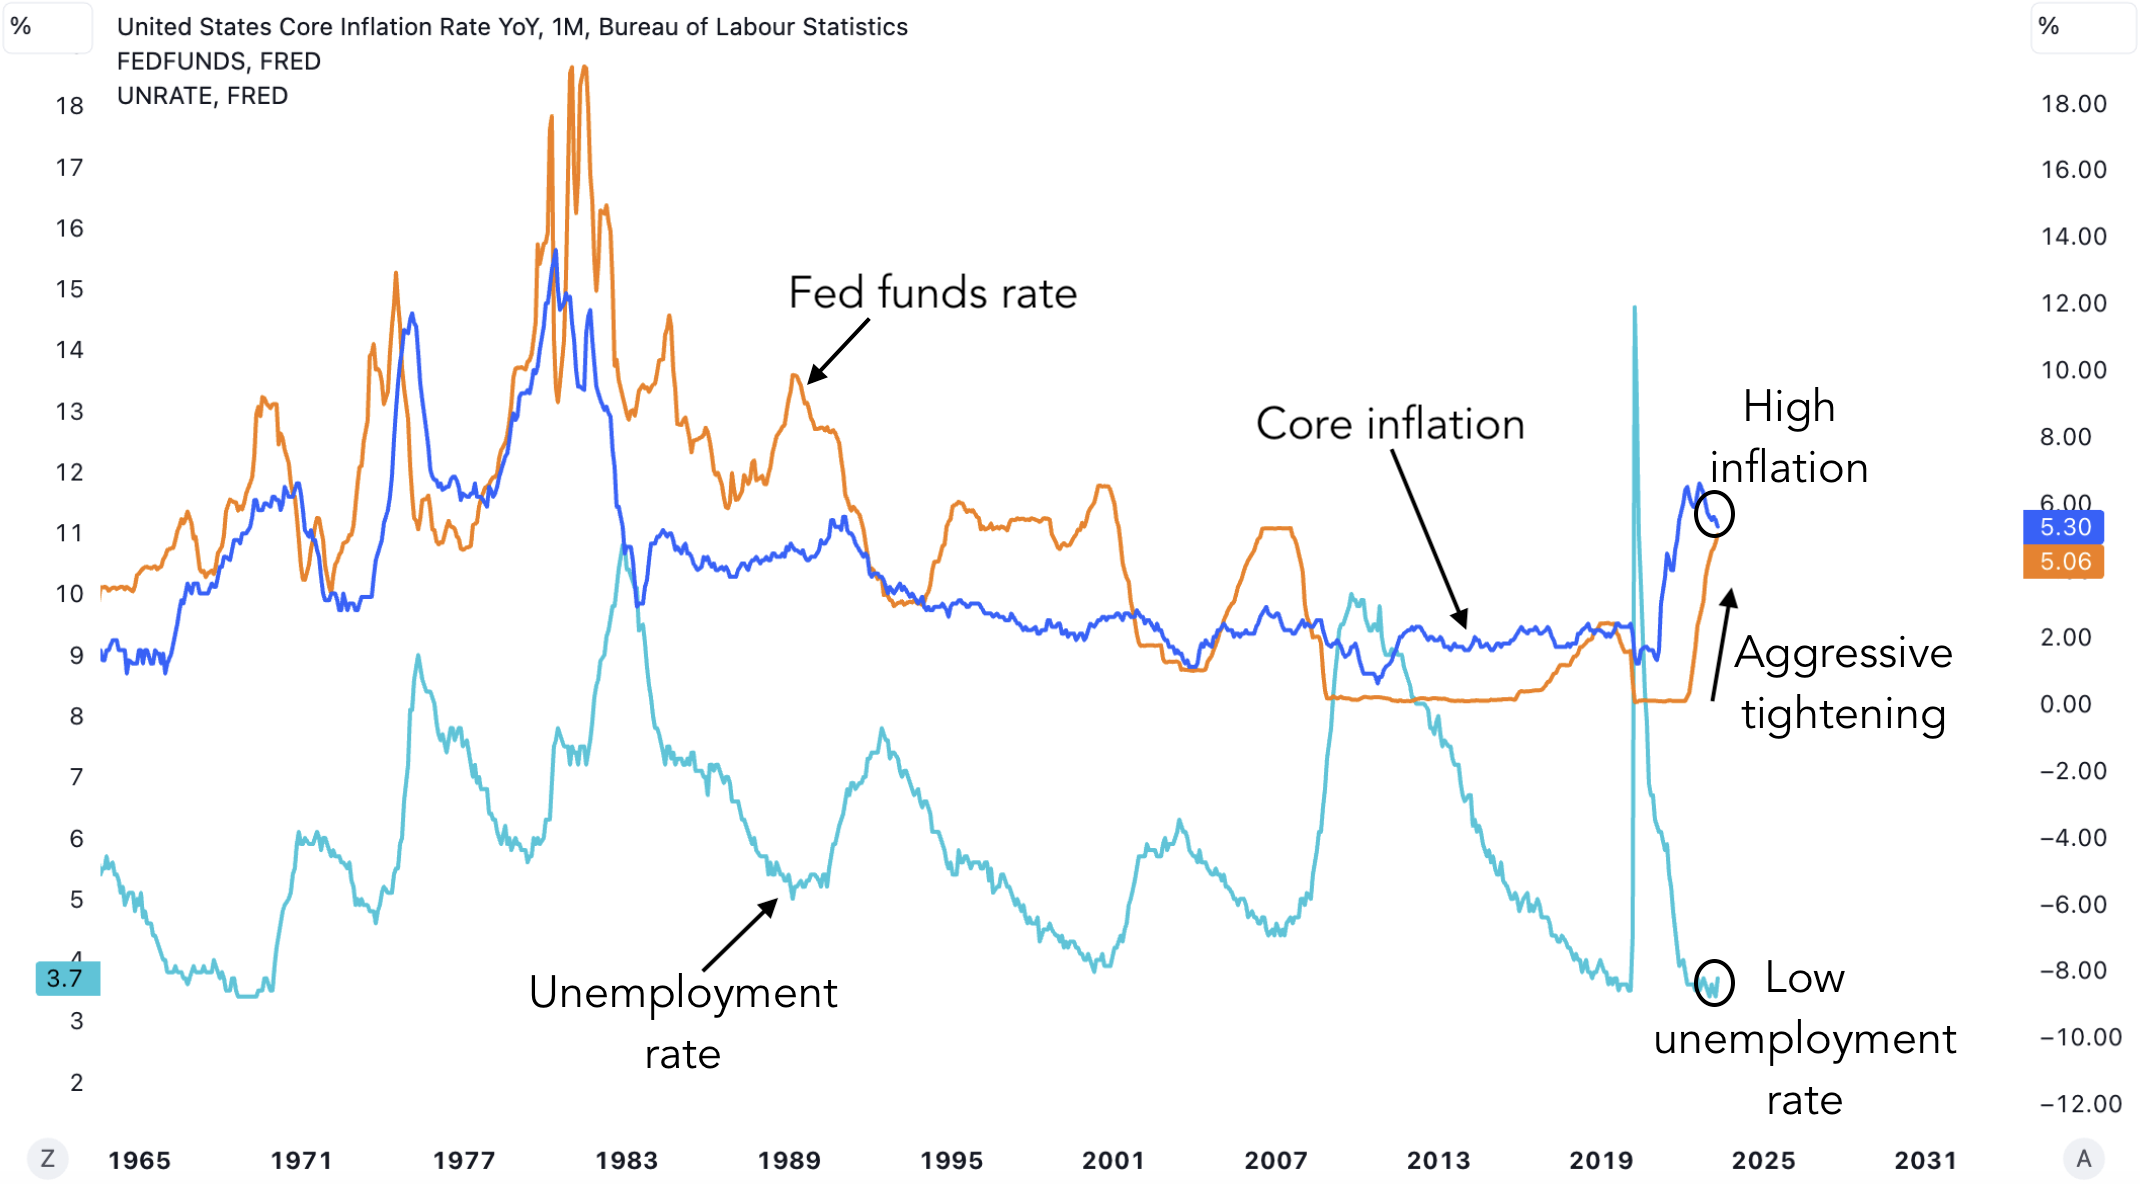
Federal Reserve’s Monetary Policy and its Impact on the Labor Market
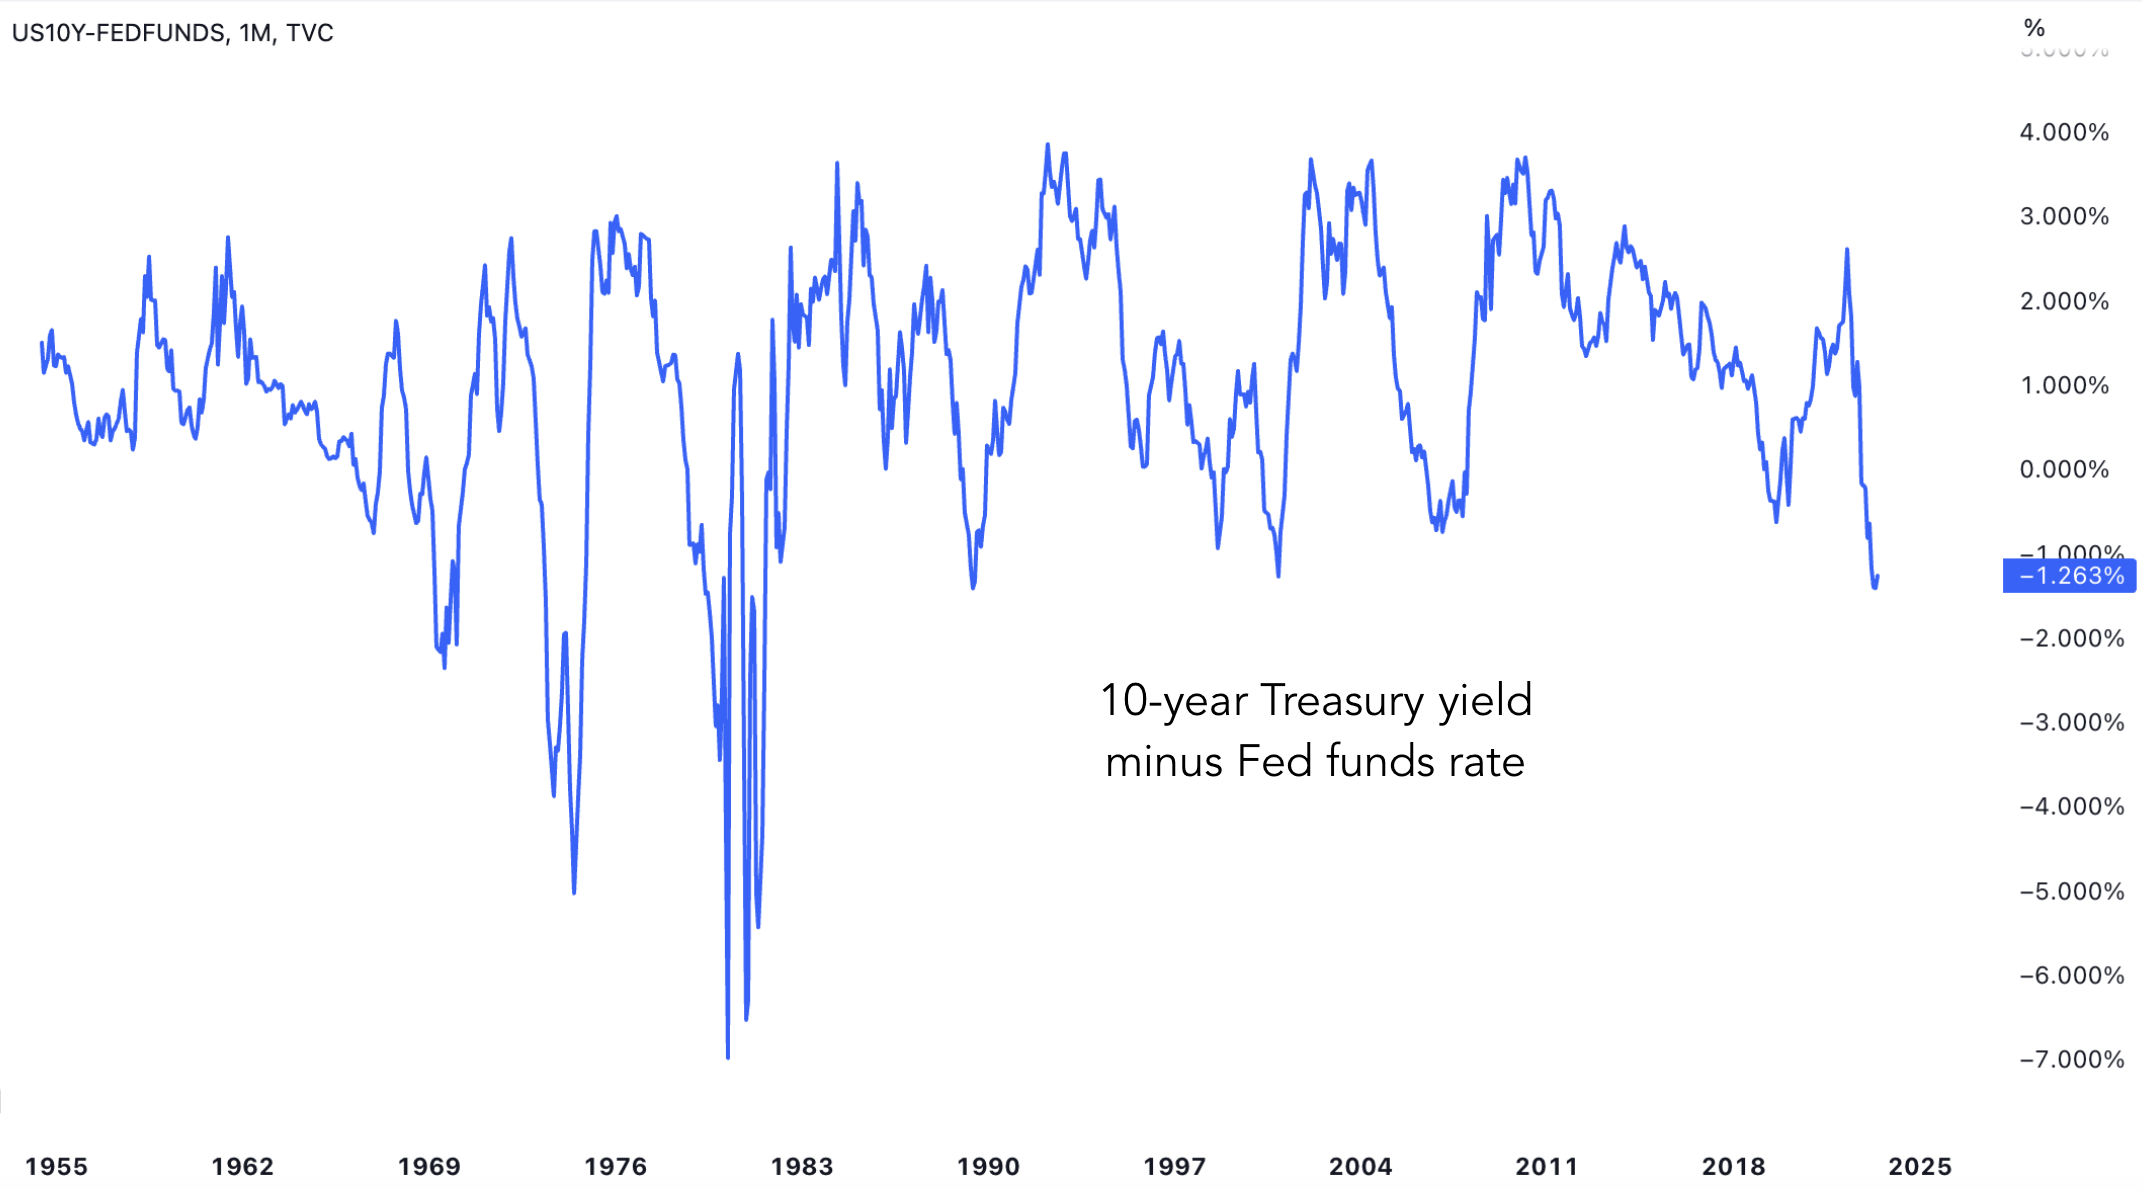
The Federal Reserve’s (the Fed) monetary policy is a key determinant in the trajectory of the labor market. The Fed’s decisions to raise or lower short-term interest rates, or the Federal Funds rate, can influence economic fluctuations, inciting periods of prosperity or downturns. A key indicator of monetary policy, and thus of future unemployment trends, is the yield curve—the difference between the 10-year Treasury yield and the Fed funds rate.
Currently, the yield curve is the most inverted it has been since the 1980s. This inversion indicates that short-term rates are high compared to long-term rates, leading to tight lending conditions.
Credit Crunch: Unemployment’s Imminent Rise in 2023
Banks are the engine of domestic credit growth—they provide loans to people and businesses. However, when the yield curve inverts, banks face higher short-term borrowing costs than their long-term lending returns. Consequently, lending decreases, triggering a credit crunch in the economy.
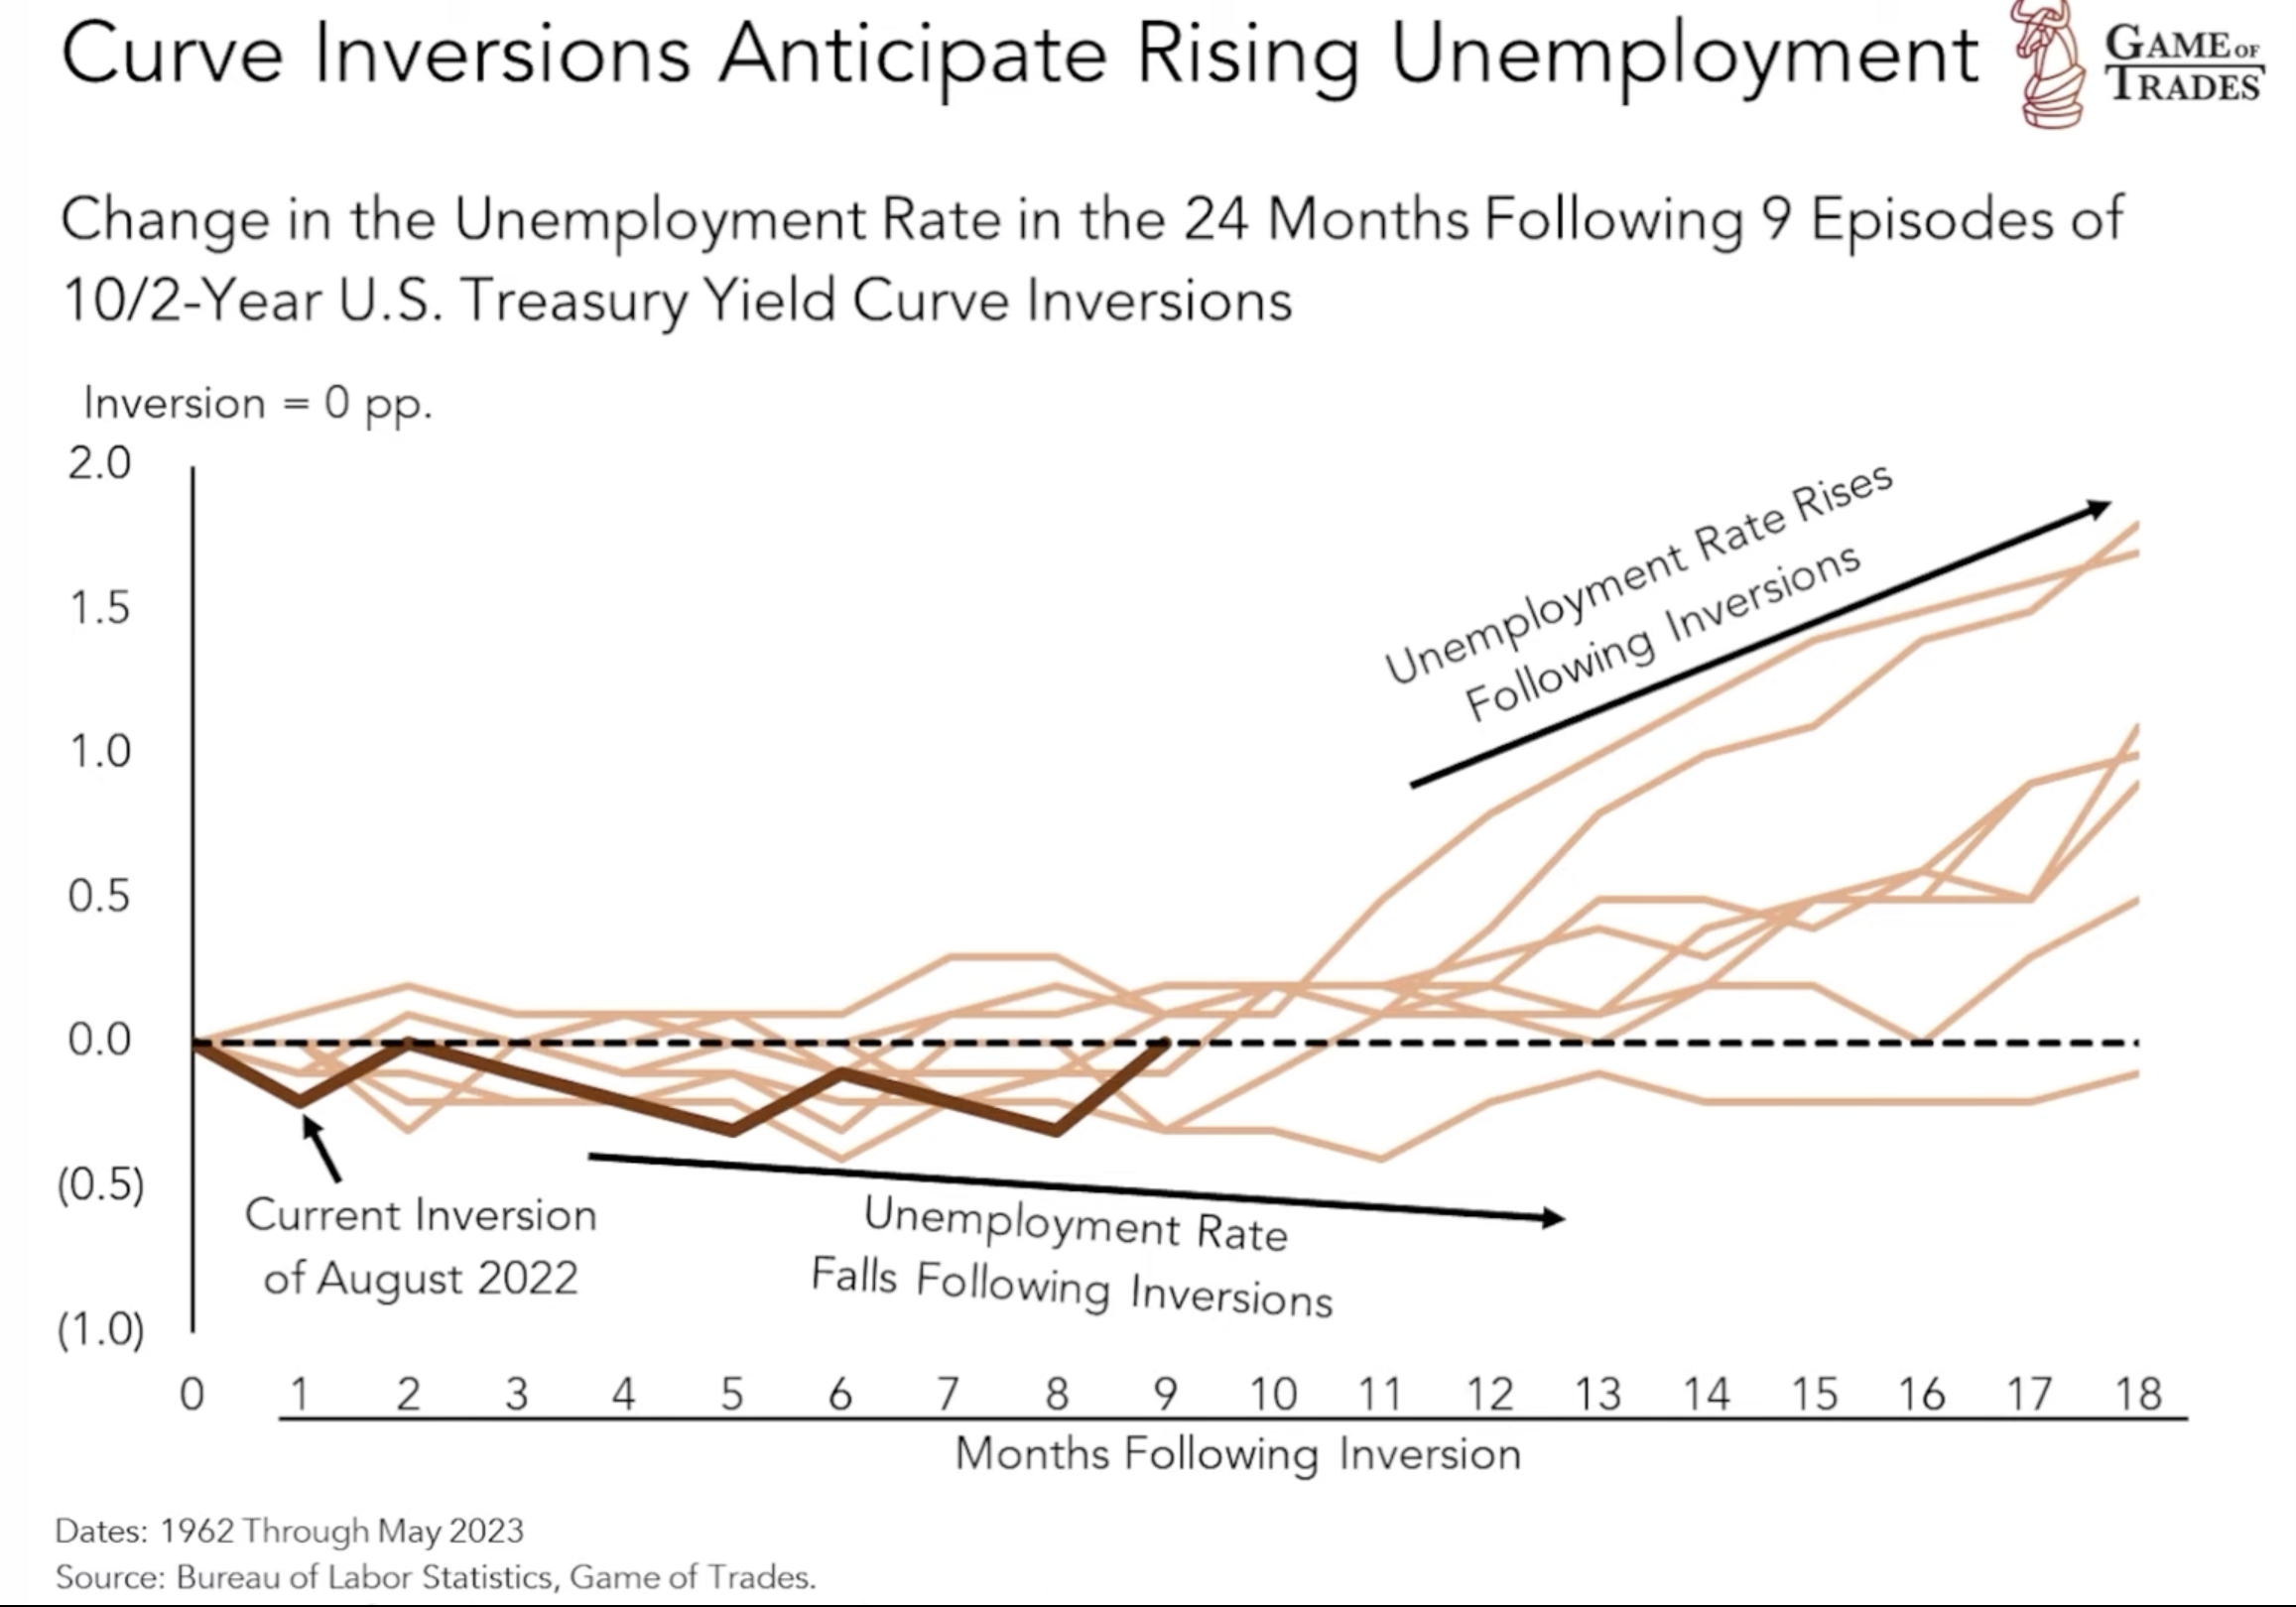
Even though 2023 has witnessed tight monetary policy, unemployment remains at a historical low—for now. However, based on current indicators, we believe the unemployment rates will begin to rise in the second half of 2023. Historical data reinforces this prediction: since 1962, unemployment has typically increased approximately 12 months post-inversion, with the rate of change intensifying between 12-18 months. Given that the yield curve inverted in August 2022, we forecast a rise in unemployment beginning September 2023.
Labor Market’s Early Warning Signs
The US labor market is already demonstrating signs of vulnerability, with jobless claims following trends seen in past recession periods, such as those in 2001 and 2007. Historical trends suggest that since 1969, jobless claims have generally risen for up to 24 months post-inversion—aligning with our current trajectory.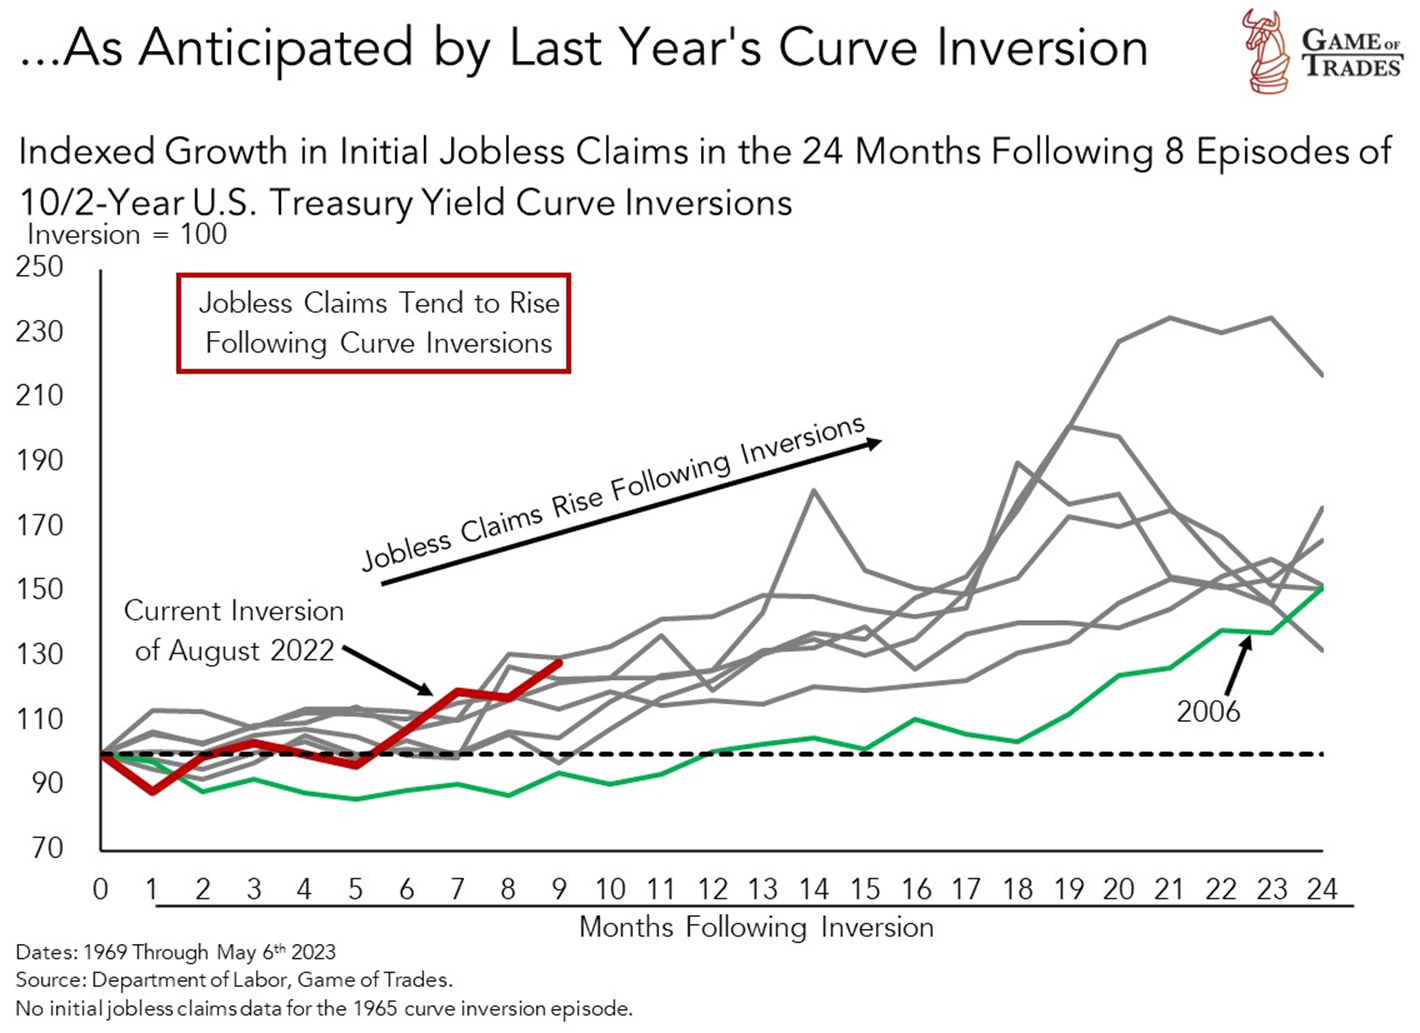
Severity of US Unemployment: How Bad Can It Get?
The next important question to answer is: how severe will the labor market weakness be? The severity of the impending labor market downturn hinges on the speed of the Fed’s monetary policy easing. A tight policy aligns with an inverted curve, while a relaxed policy corresponds to a steep curve.
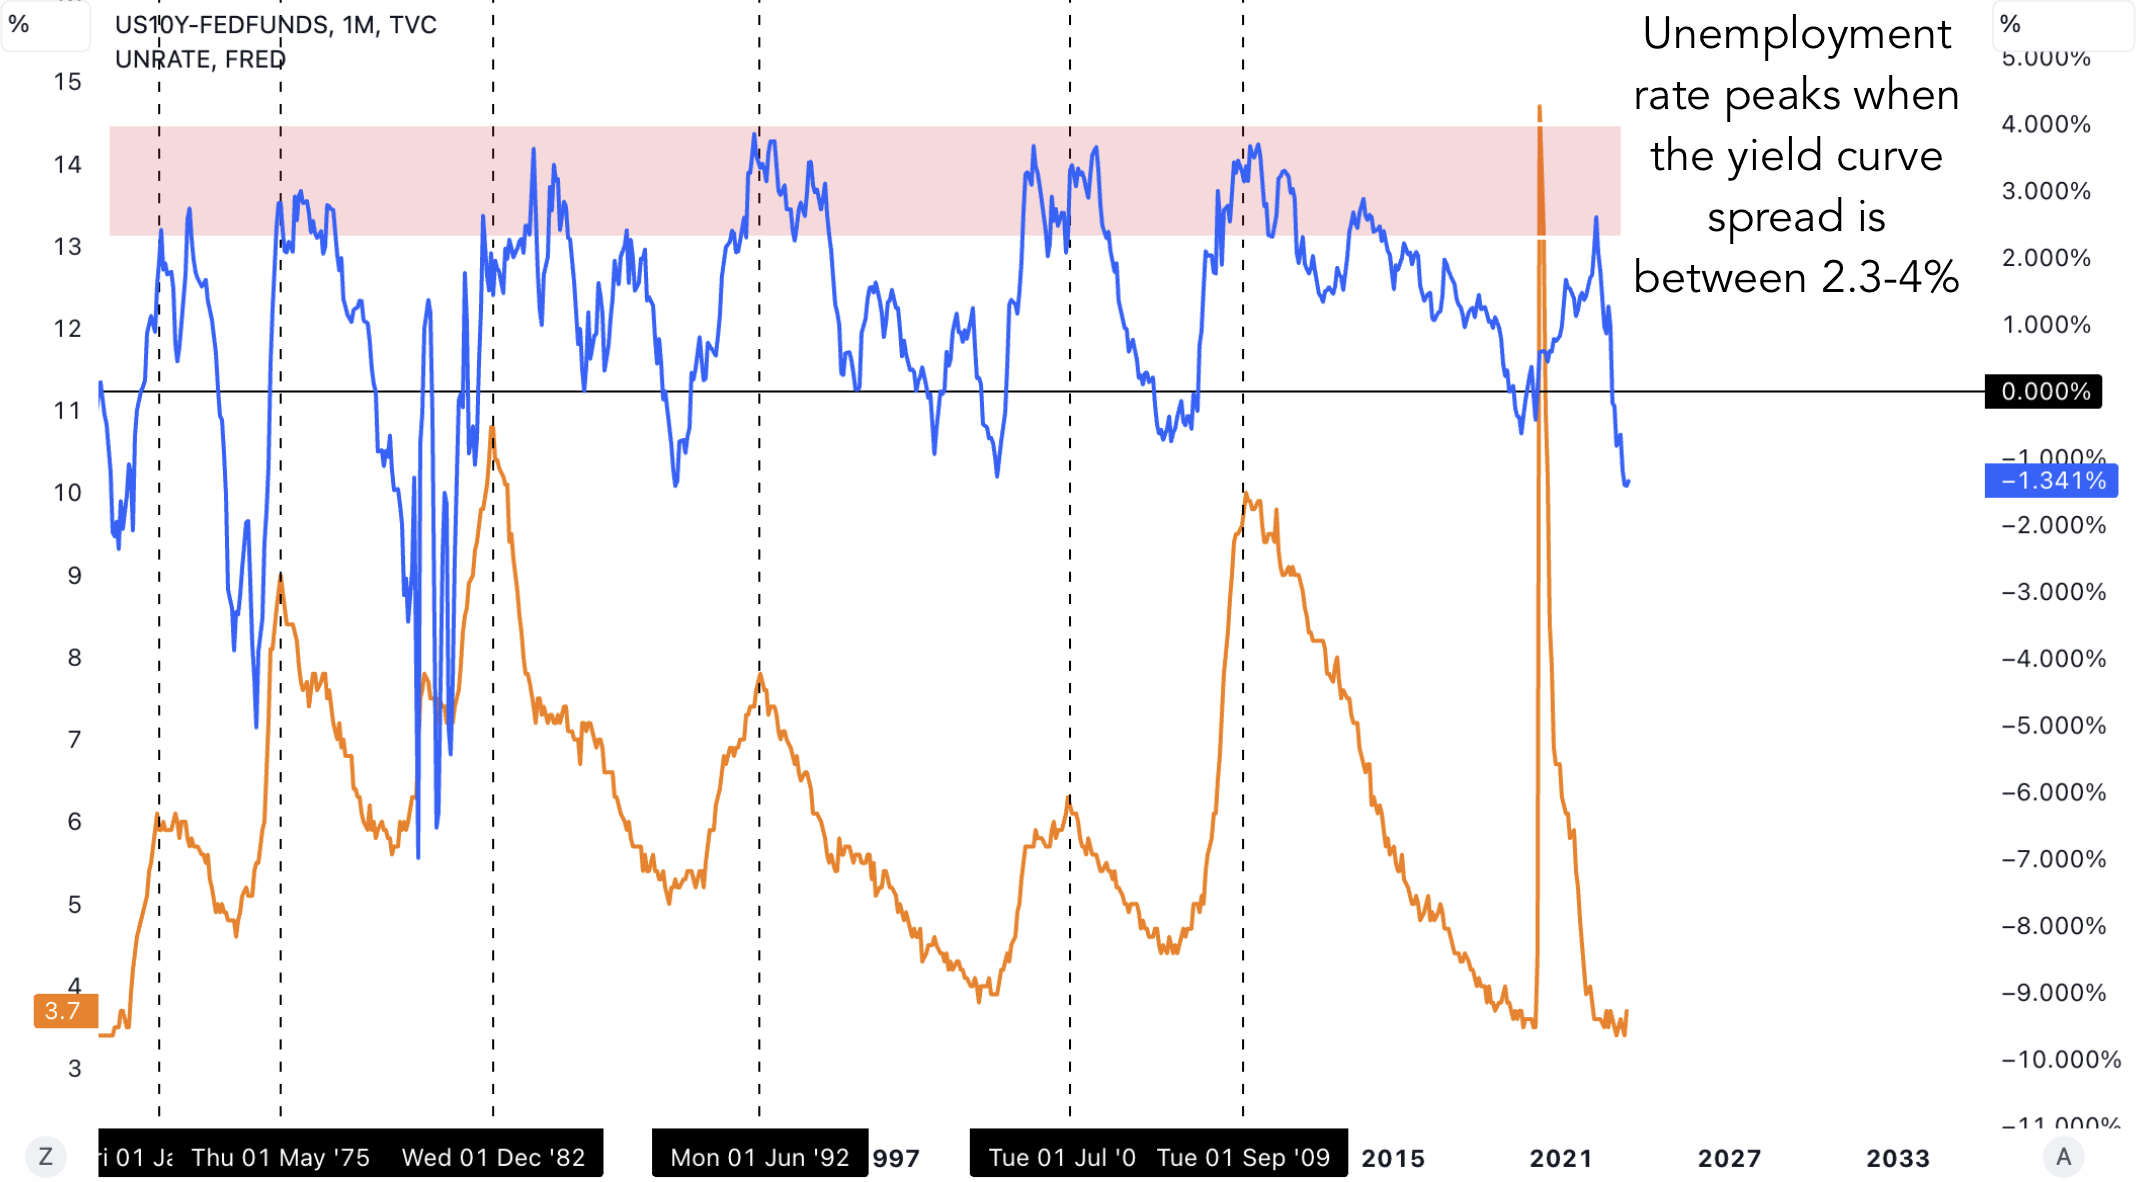
Historically, since the 1970s, peaks in unemployment have occurred when the yield curve was between 2.30 – 4.0%. The time it takes to reach this point will depend on the Fed’s responsiveness to a looming recession and the persistence of inflation.
Deeper yield curve inversions signal more significant economic deterioration, as they correlate with higher jobless claims. Based on the current inversion depth, we project initial jobless claims to surge to approximately 400k within the next three quarters.
Reflecting on Past Recessions: A Look at Jobless Claims
Predicted to be around 400k, the forthcoming initial jobless claims figures align with those seen during past recession periods, such as those in 1990, 2001, and 2008.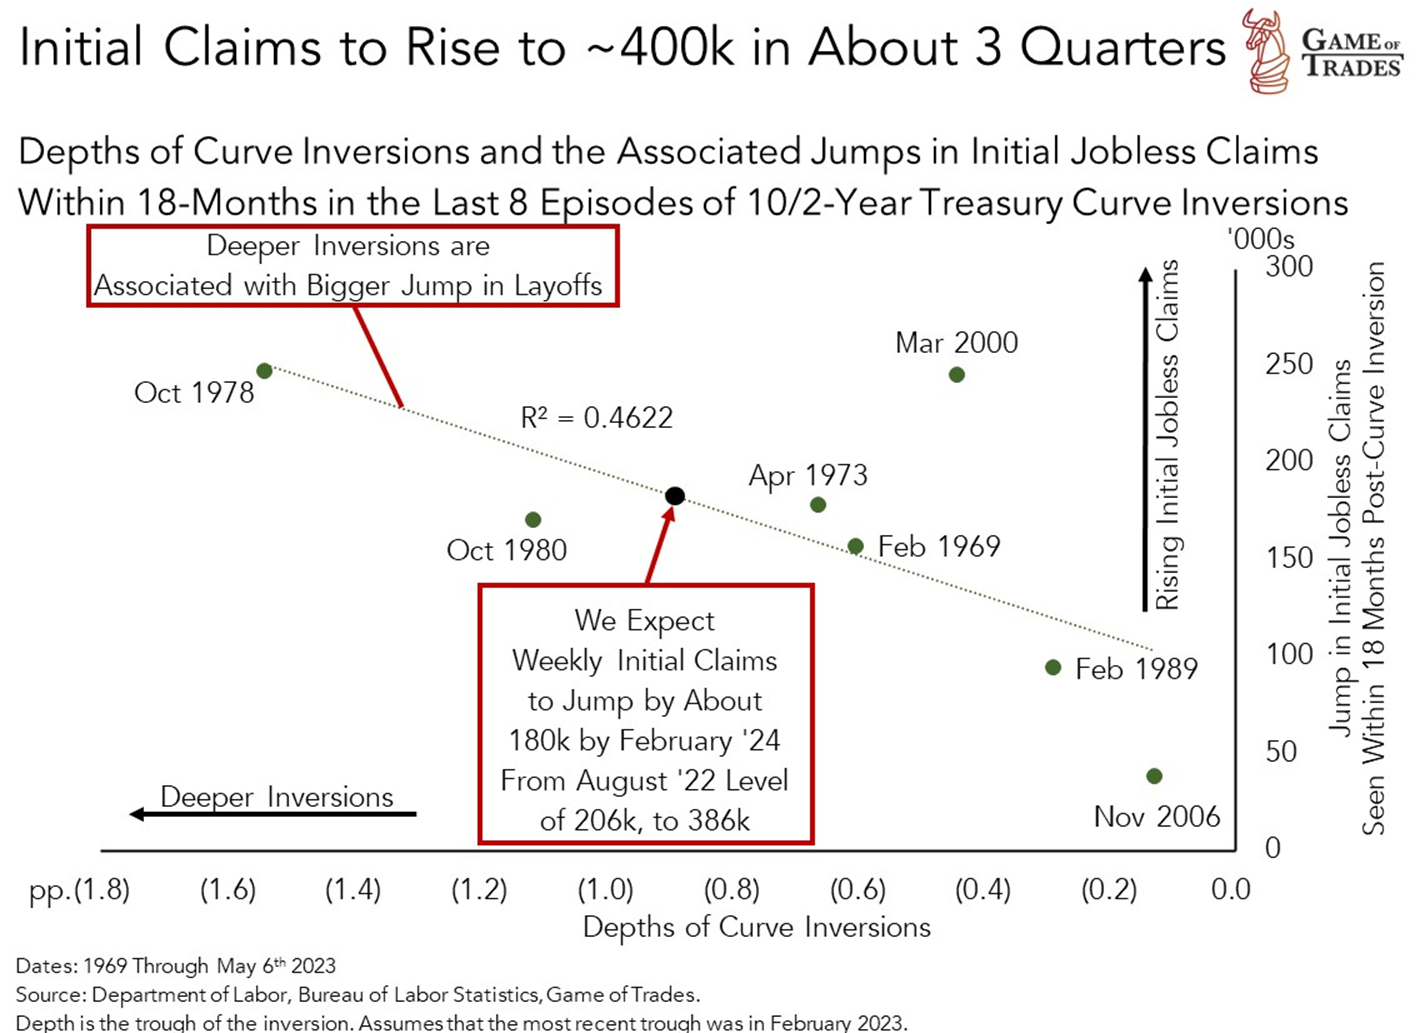
To sum up, current financial indicators suggest that US unemployment is poised for a substantial increase by September 2023. Keeping a close eye on these trends will be crucial in the coming months for anyone interested in understanding and effectively navigating the ever-evolving macroeconomic landscape. Click here to get free trial for 7 days! Subscribe to our YouTube channel and Follow us on Twitter for more updates!


