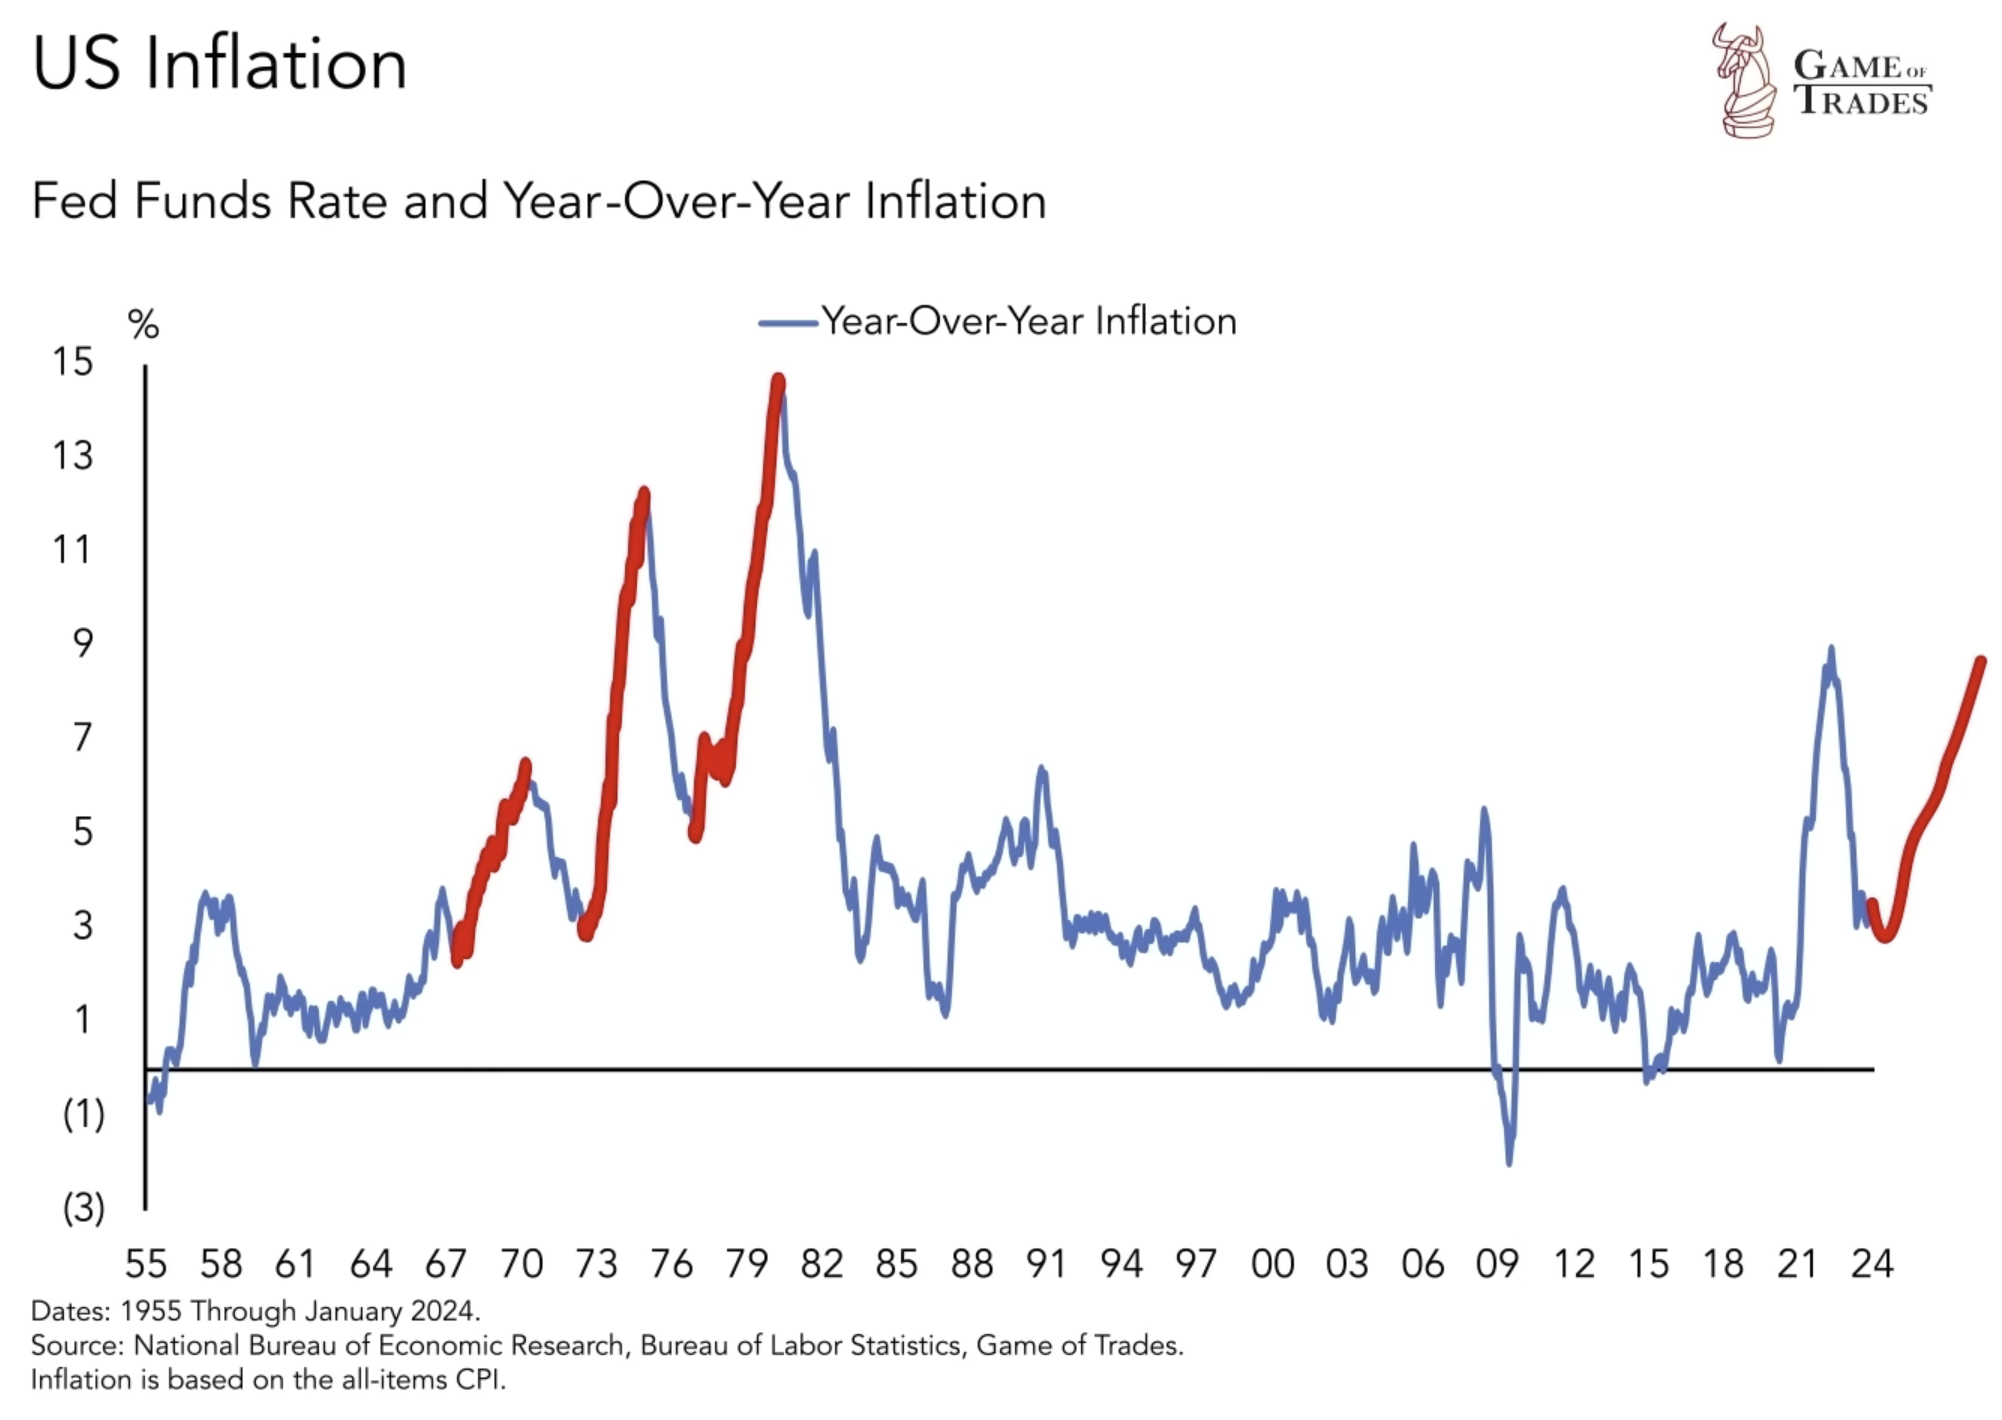
Over the past five years, the US economy has undergone significant changes, with a 20% drop in USD purchasing power, soaring home prices, and a notable inflation wave reminiscent of the 1970s. While inflation has recently eased, it tends to resurface in waves, posing a potential threat to the economy if another surge occurs. In this article, we will explore the drivers of inflation, the impact of pandemic-related factors on household savings, the role of business costs as an indicator, and potential implications for wages and job markets.
Inflation Drivers: Supply Shortages and Excess Demand
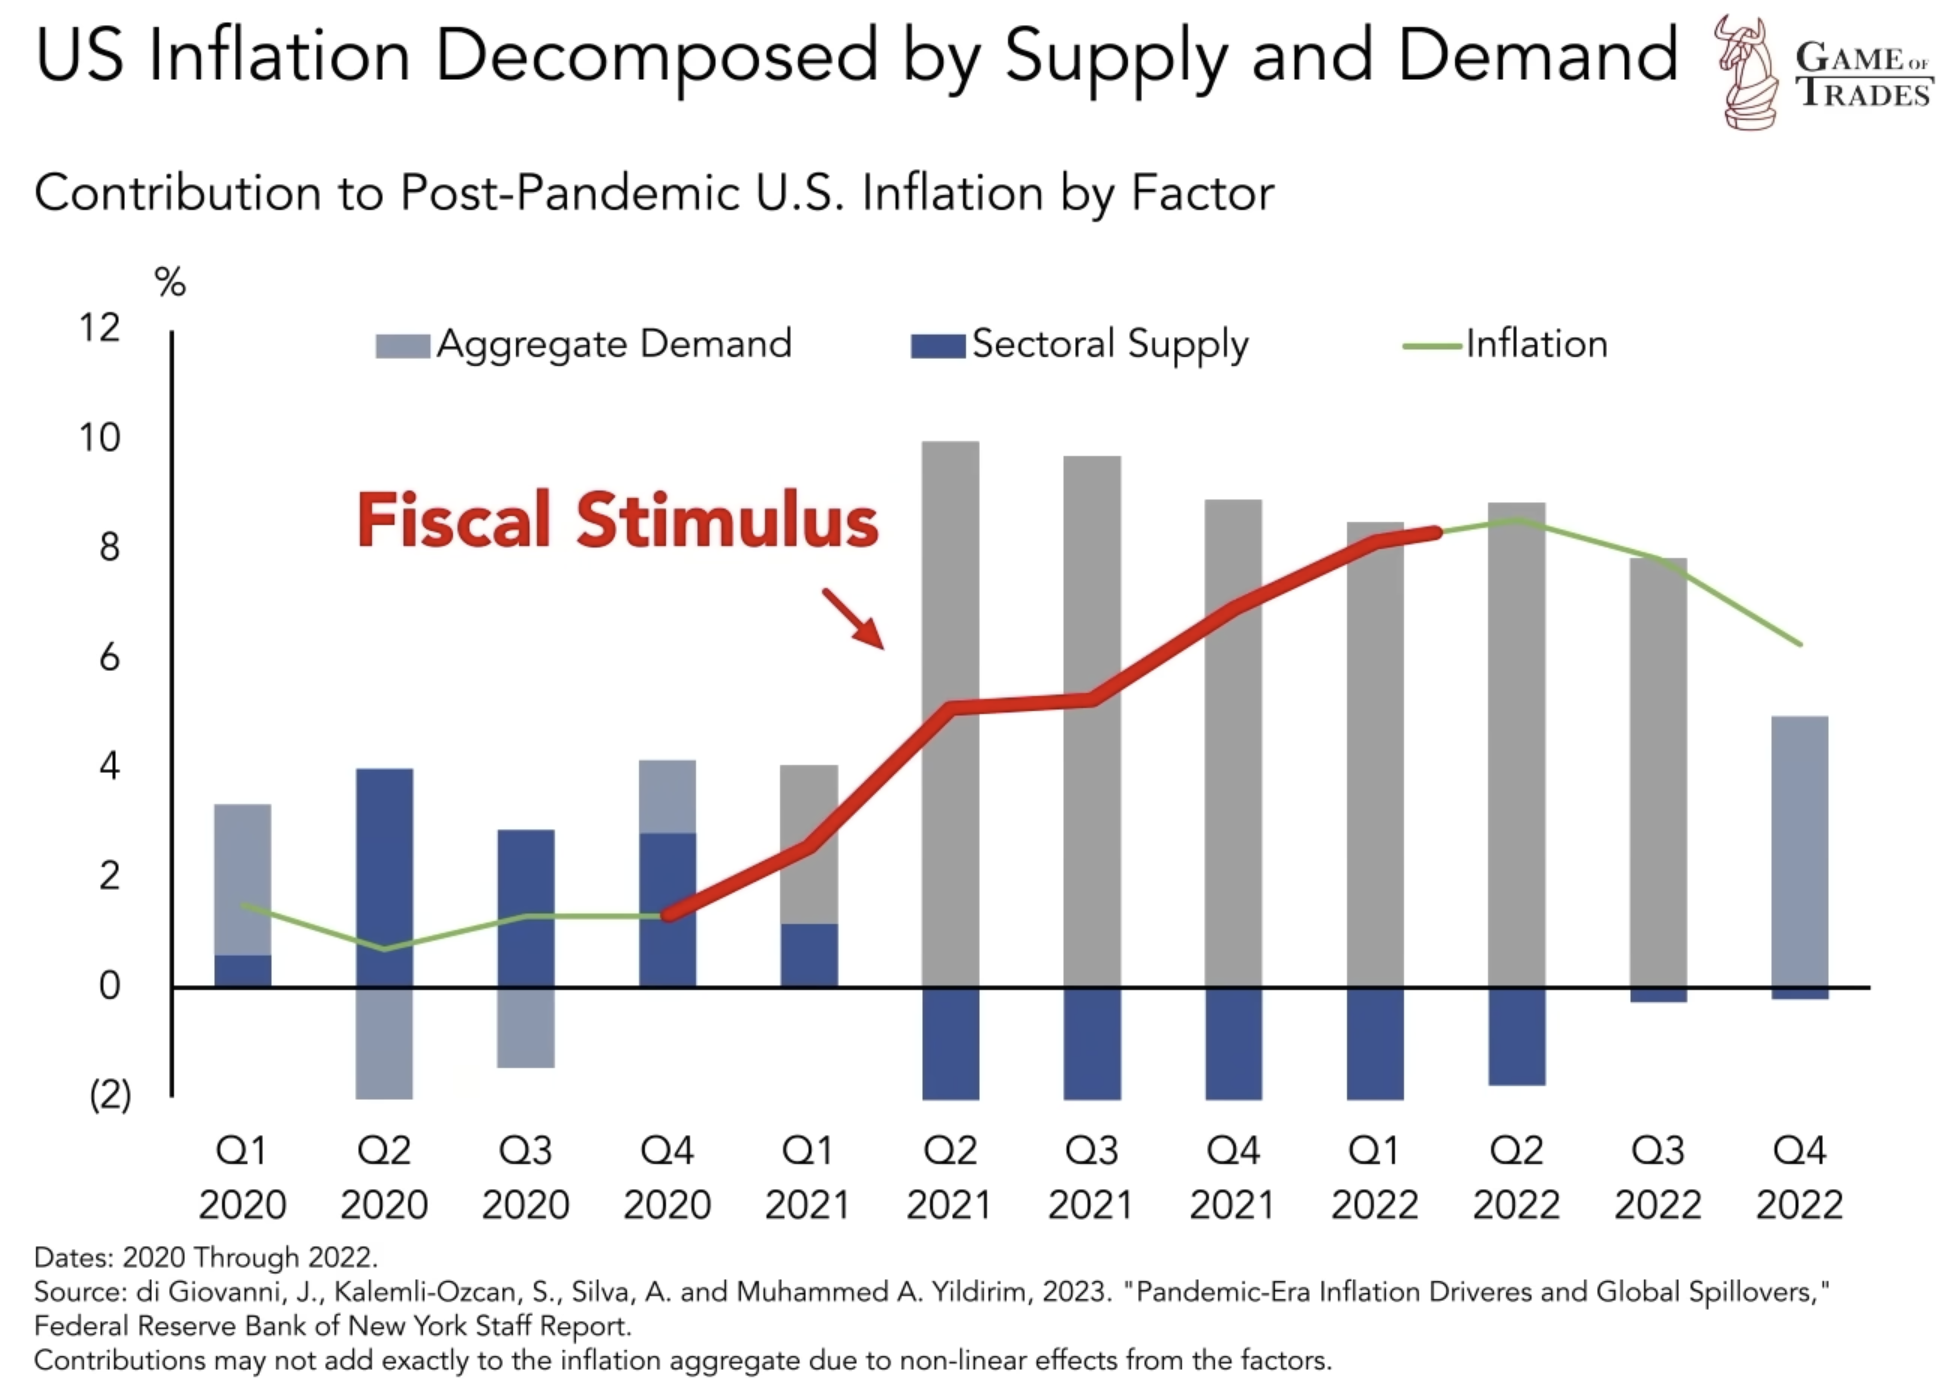
Inflation can arise from two primary factors: supply shortages and excess demand. The lockdowns imposed in 2020 due to the pandemic resulted in supply-driven inflation, as disrupted global supply chains caused shortages of essential goods. Conversely, the economic stimulus measures implemented in 2021-2022 fueled demand-driven inflation, as substantial household savings accumulated during the pandemic drove increased consumer spending.
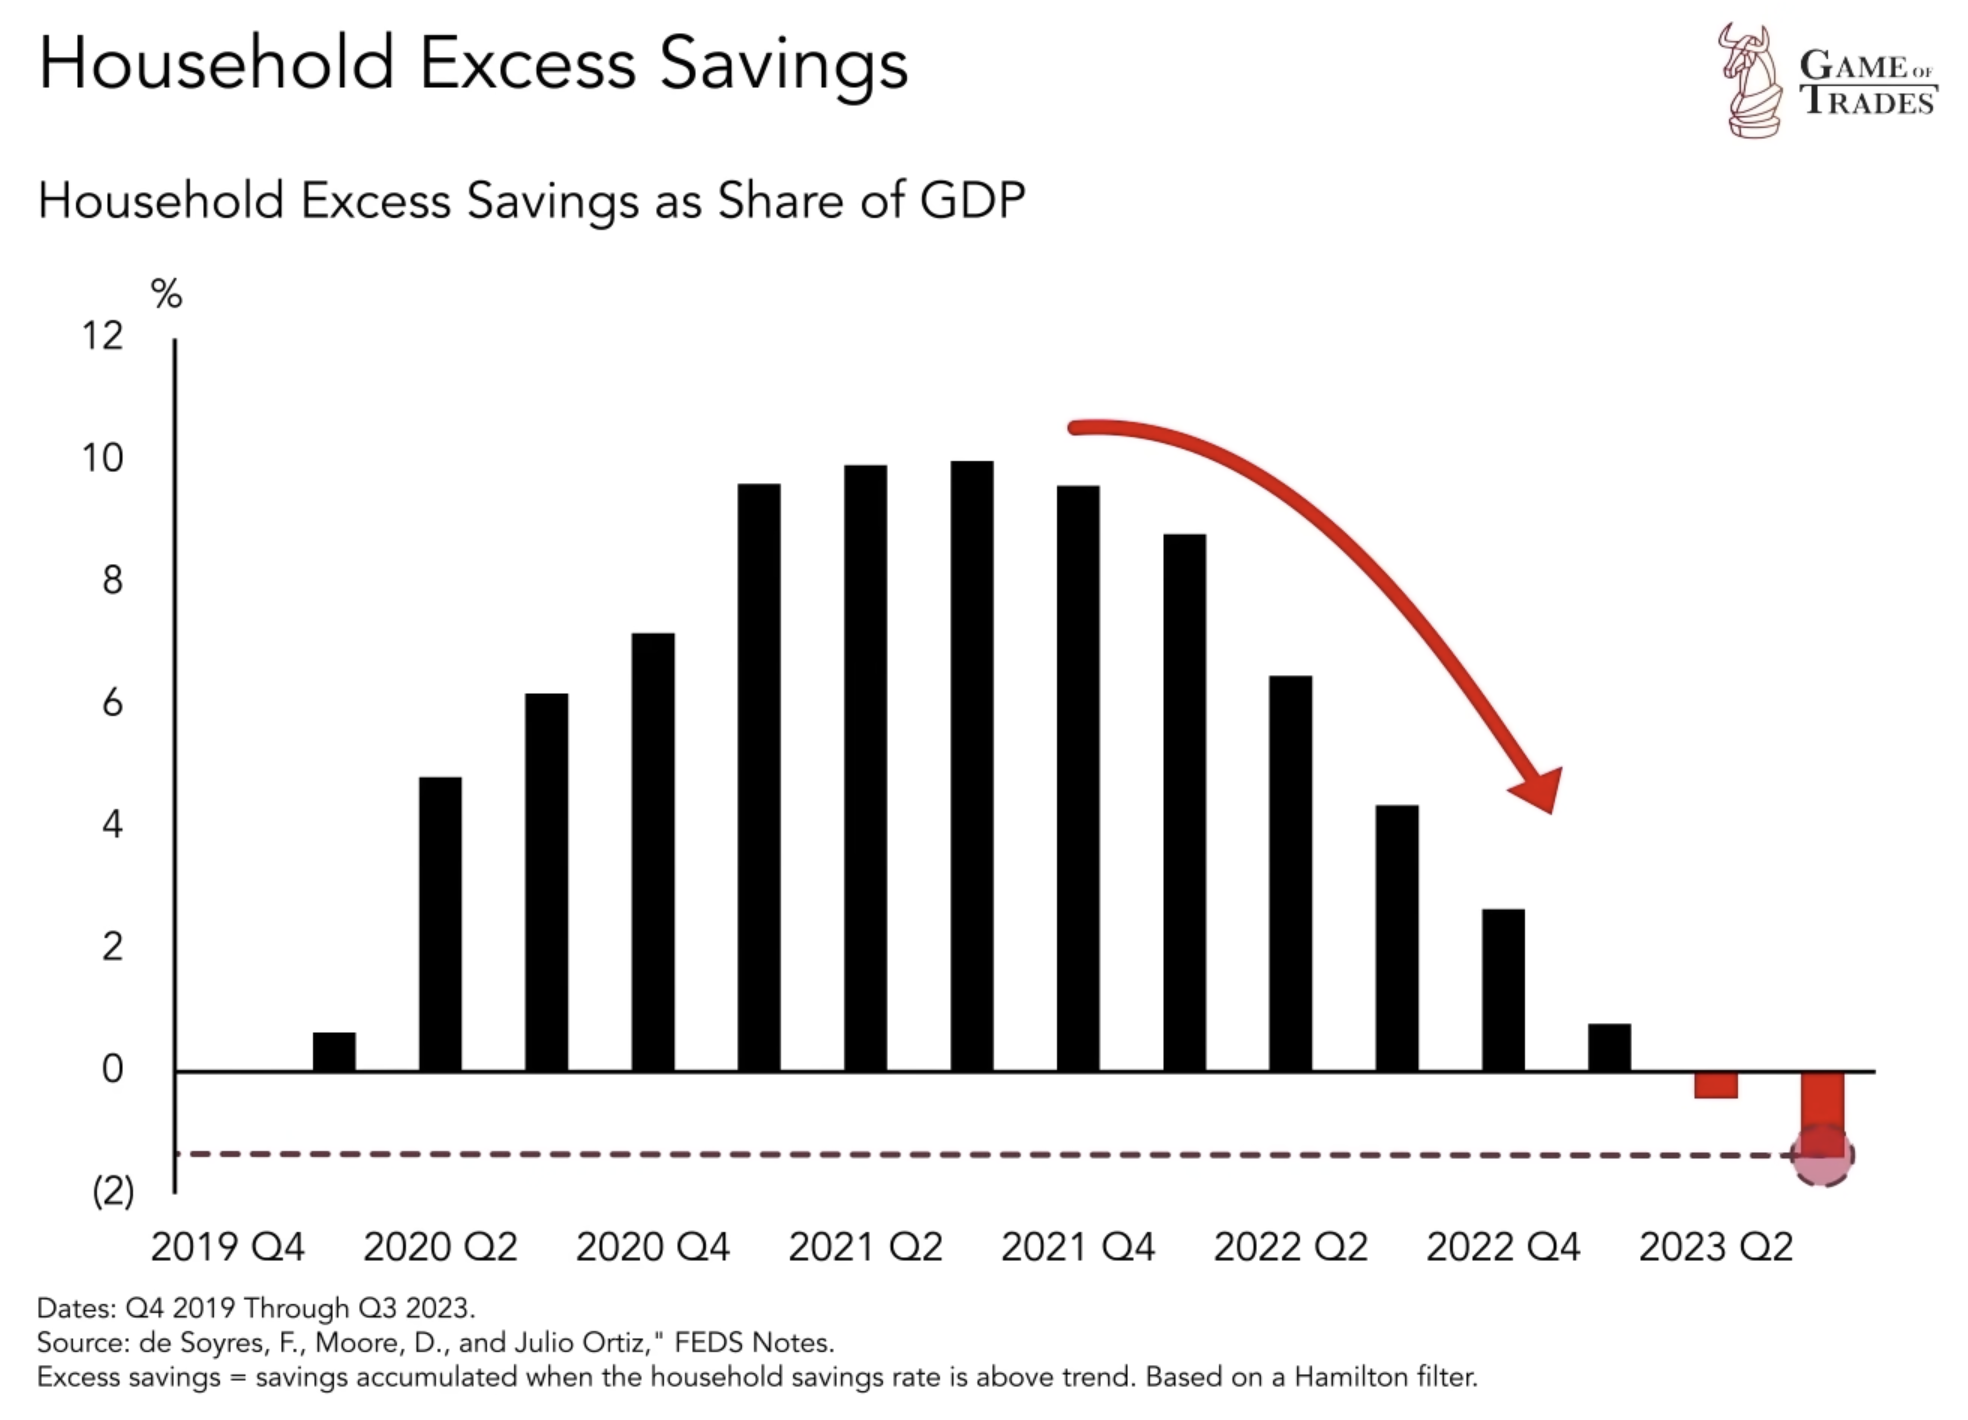
Depleted Household Savings and the Inflation Outlook
The pandemic-related lockdowns and stimulus efforts led to significant accumulation of household savings in 2020, with excess savings reaching approximately 10% of GDP by mid-2021. However, these savings have now been fully depleted, leaving individuals with fewer savings than even four years ago. This suggests a continued decline in inflationary pressures as consumers have less disposable income to fuel demand-driven inflation. Nevertheless, it is essential to examine key indicators that may provide a different perspective on the inflation outlook.
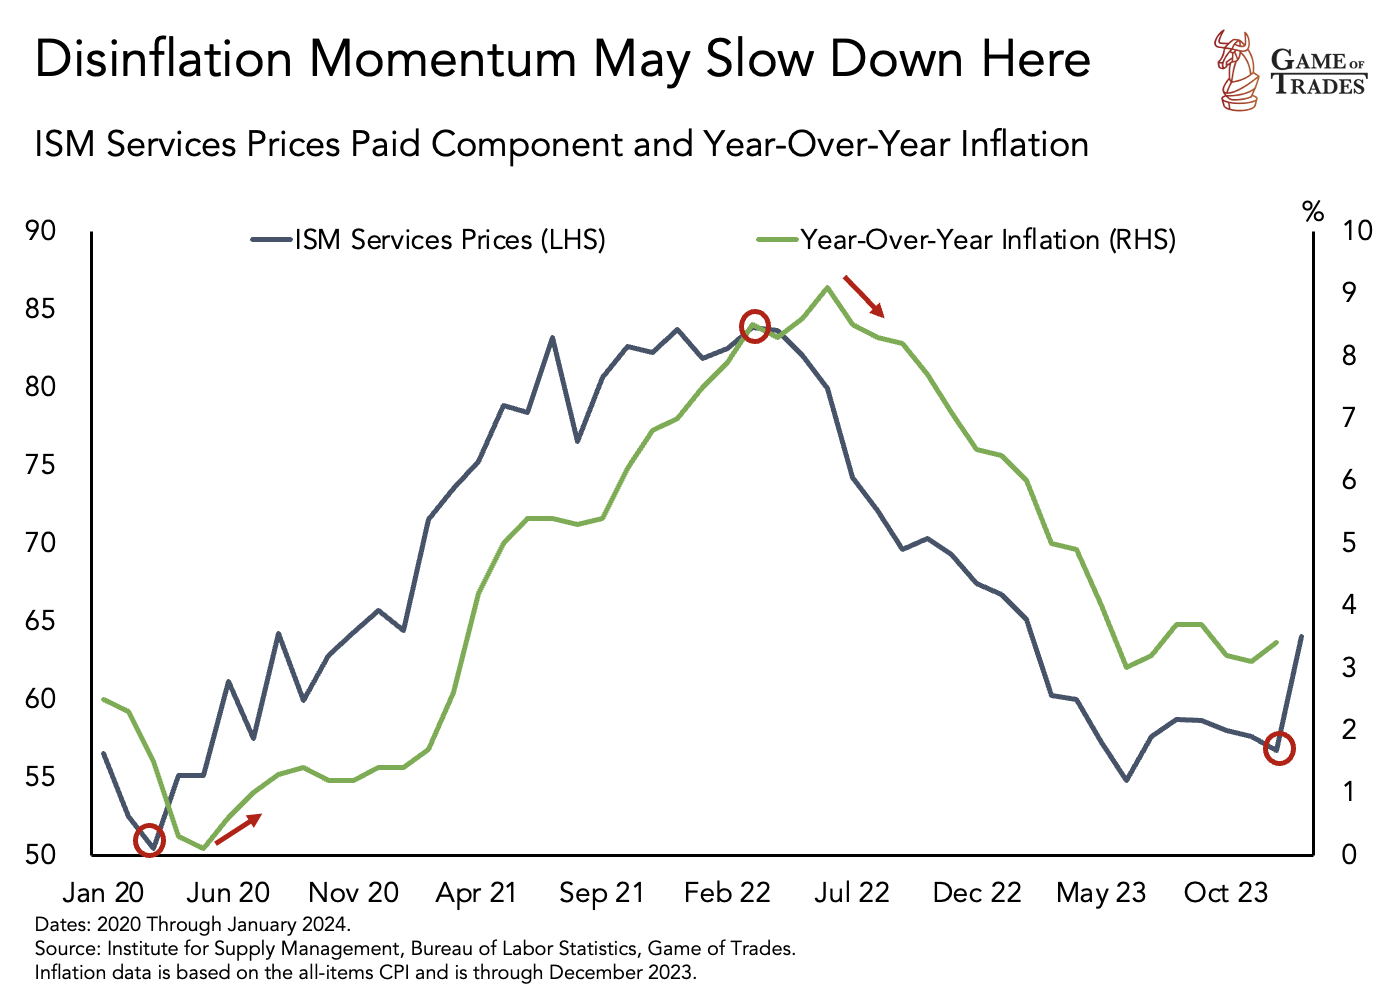
The Blue Line: A Robust Indicator of Inflation
A key indicator to consider is the blue line, which represents fluctuating business costs. This line serves as a robust leading indicator for inflationary trends. Its ascent in 2021 accurately preceded the surge in inflation, and it also forecasted the subsequent decline in 2022. Currently, the blue line hints at an incoming inflation uptick, indicating rising business costs, which often lead to price hikes that fuel inflation.
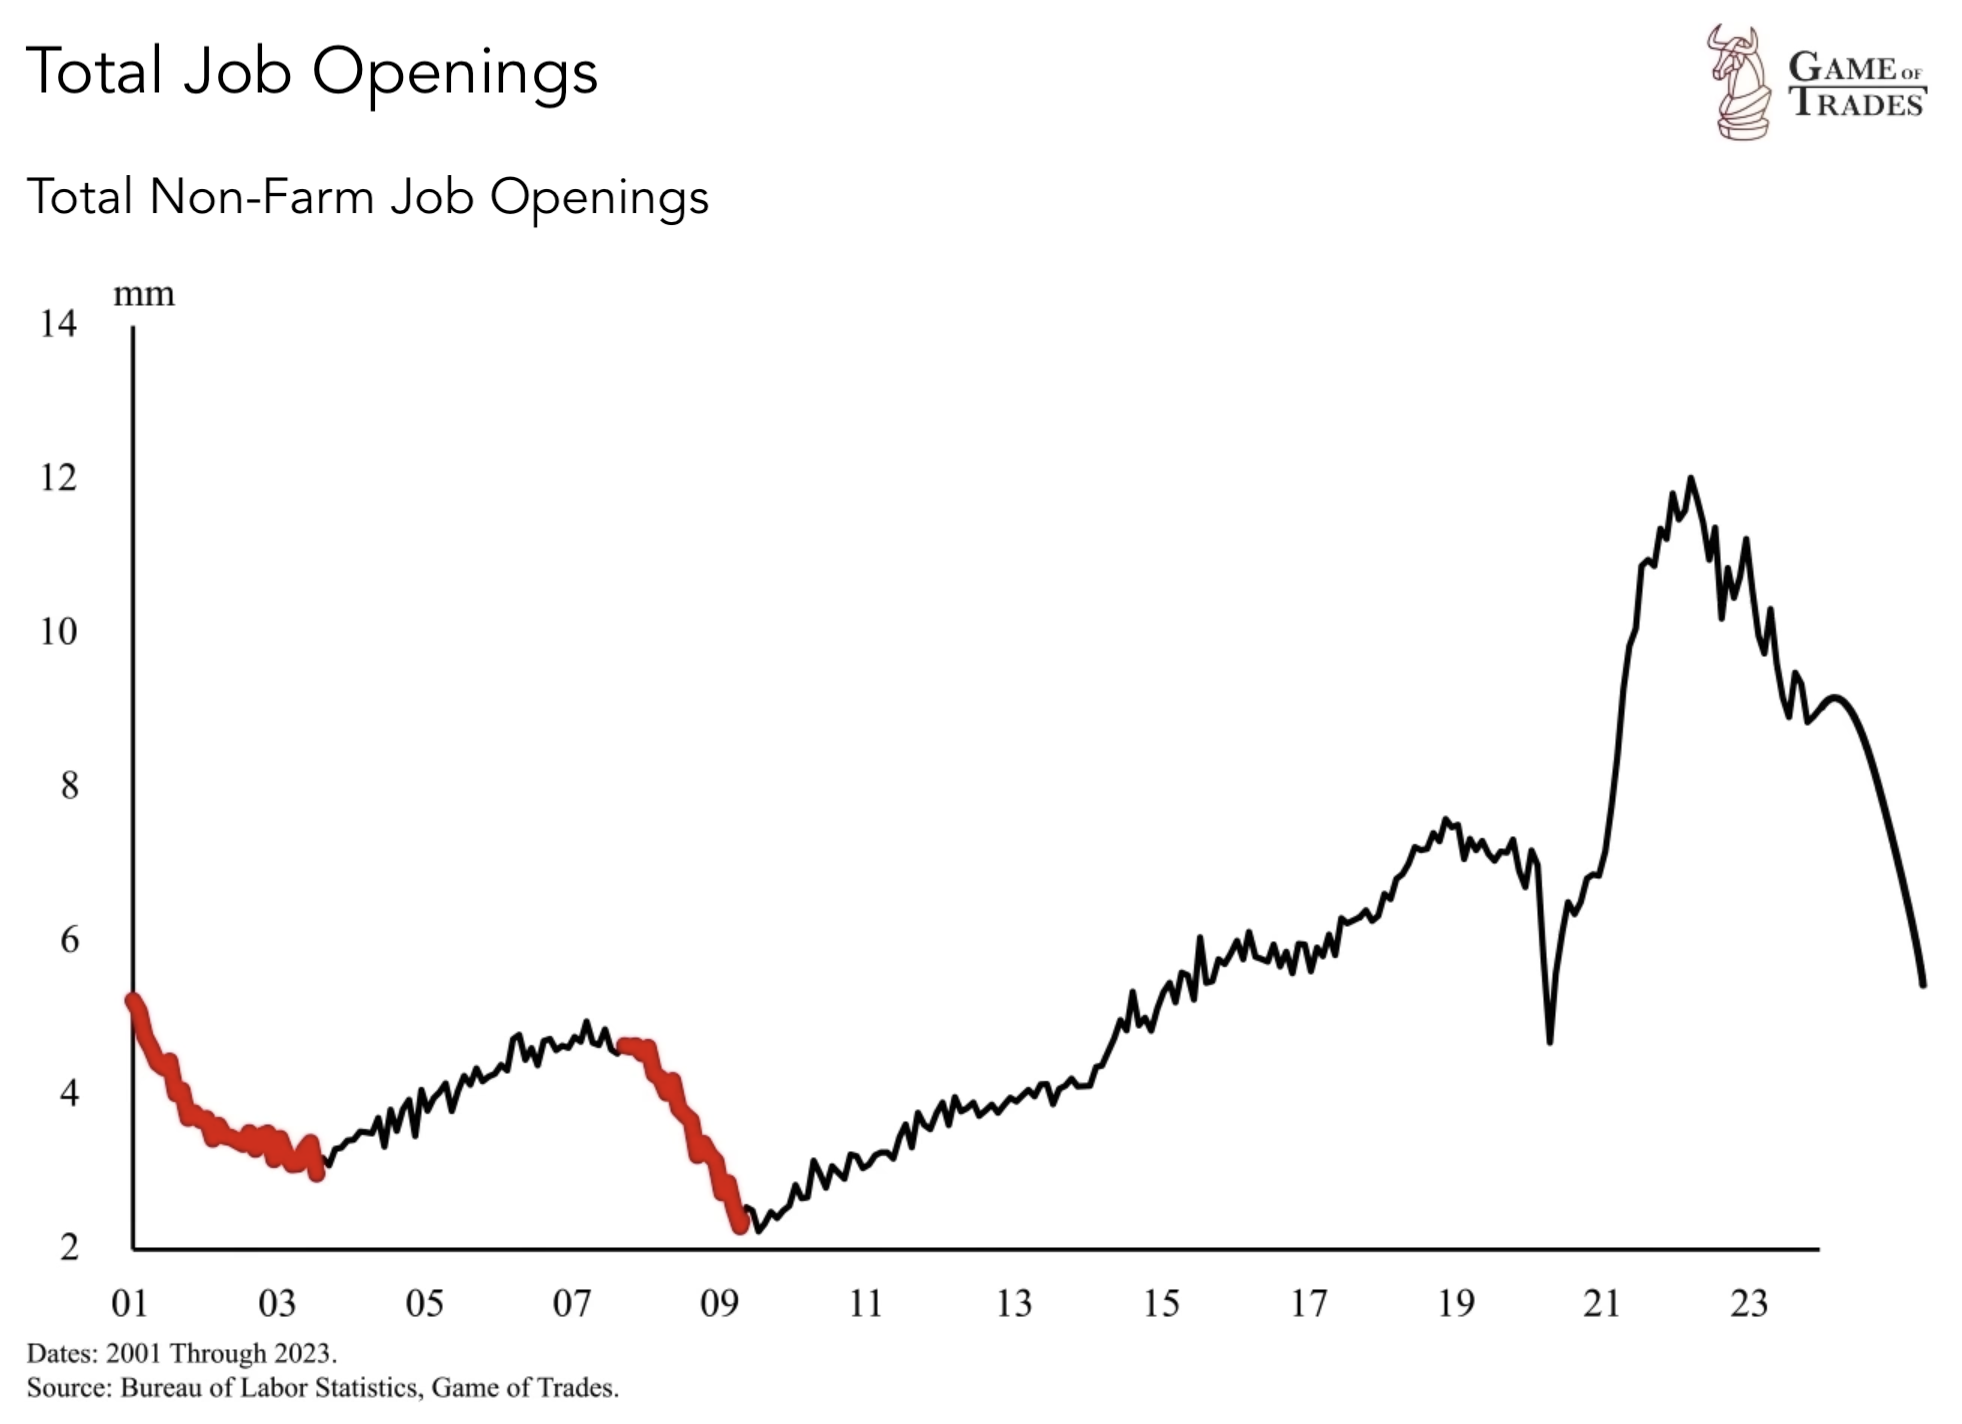
Rising Wages and the Job Market
Worker compensation hikes have surged, reaching levels rarely seen since 1998. This acceleration in wages puts upward pressure on inflation. Businesses, faced with a high number of job openings (currently at 9 million), are hesitant to reduce worker compensation, as workers have significant bargaining power due to the scarcity of available talent. This dynamic suggests sustained inflationary pressures, in contrast to previous periods such as 2008 or 2000 when job openings sharply declined during recessions, thereby dampening inflation. However, if a recession akin to 2008 or 2000 occurs today, job openings should continue declining sharply, which should help keep inflation under control.
The Impact of Interest Rates on Inflation
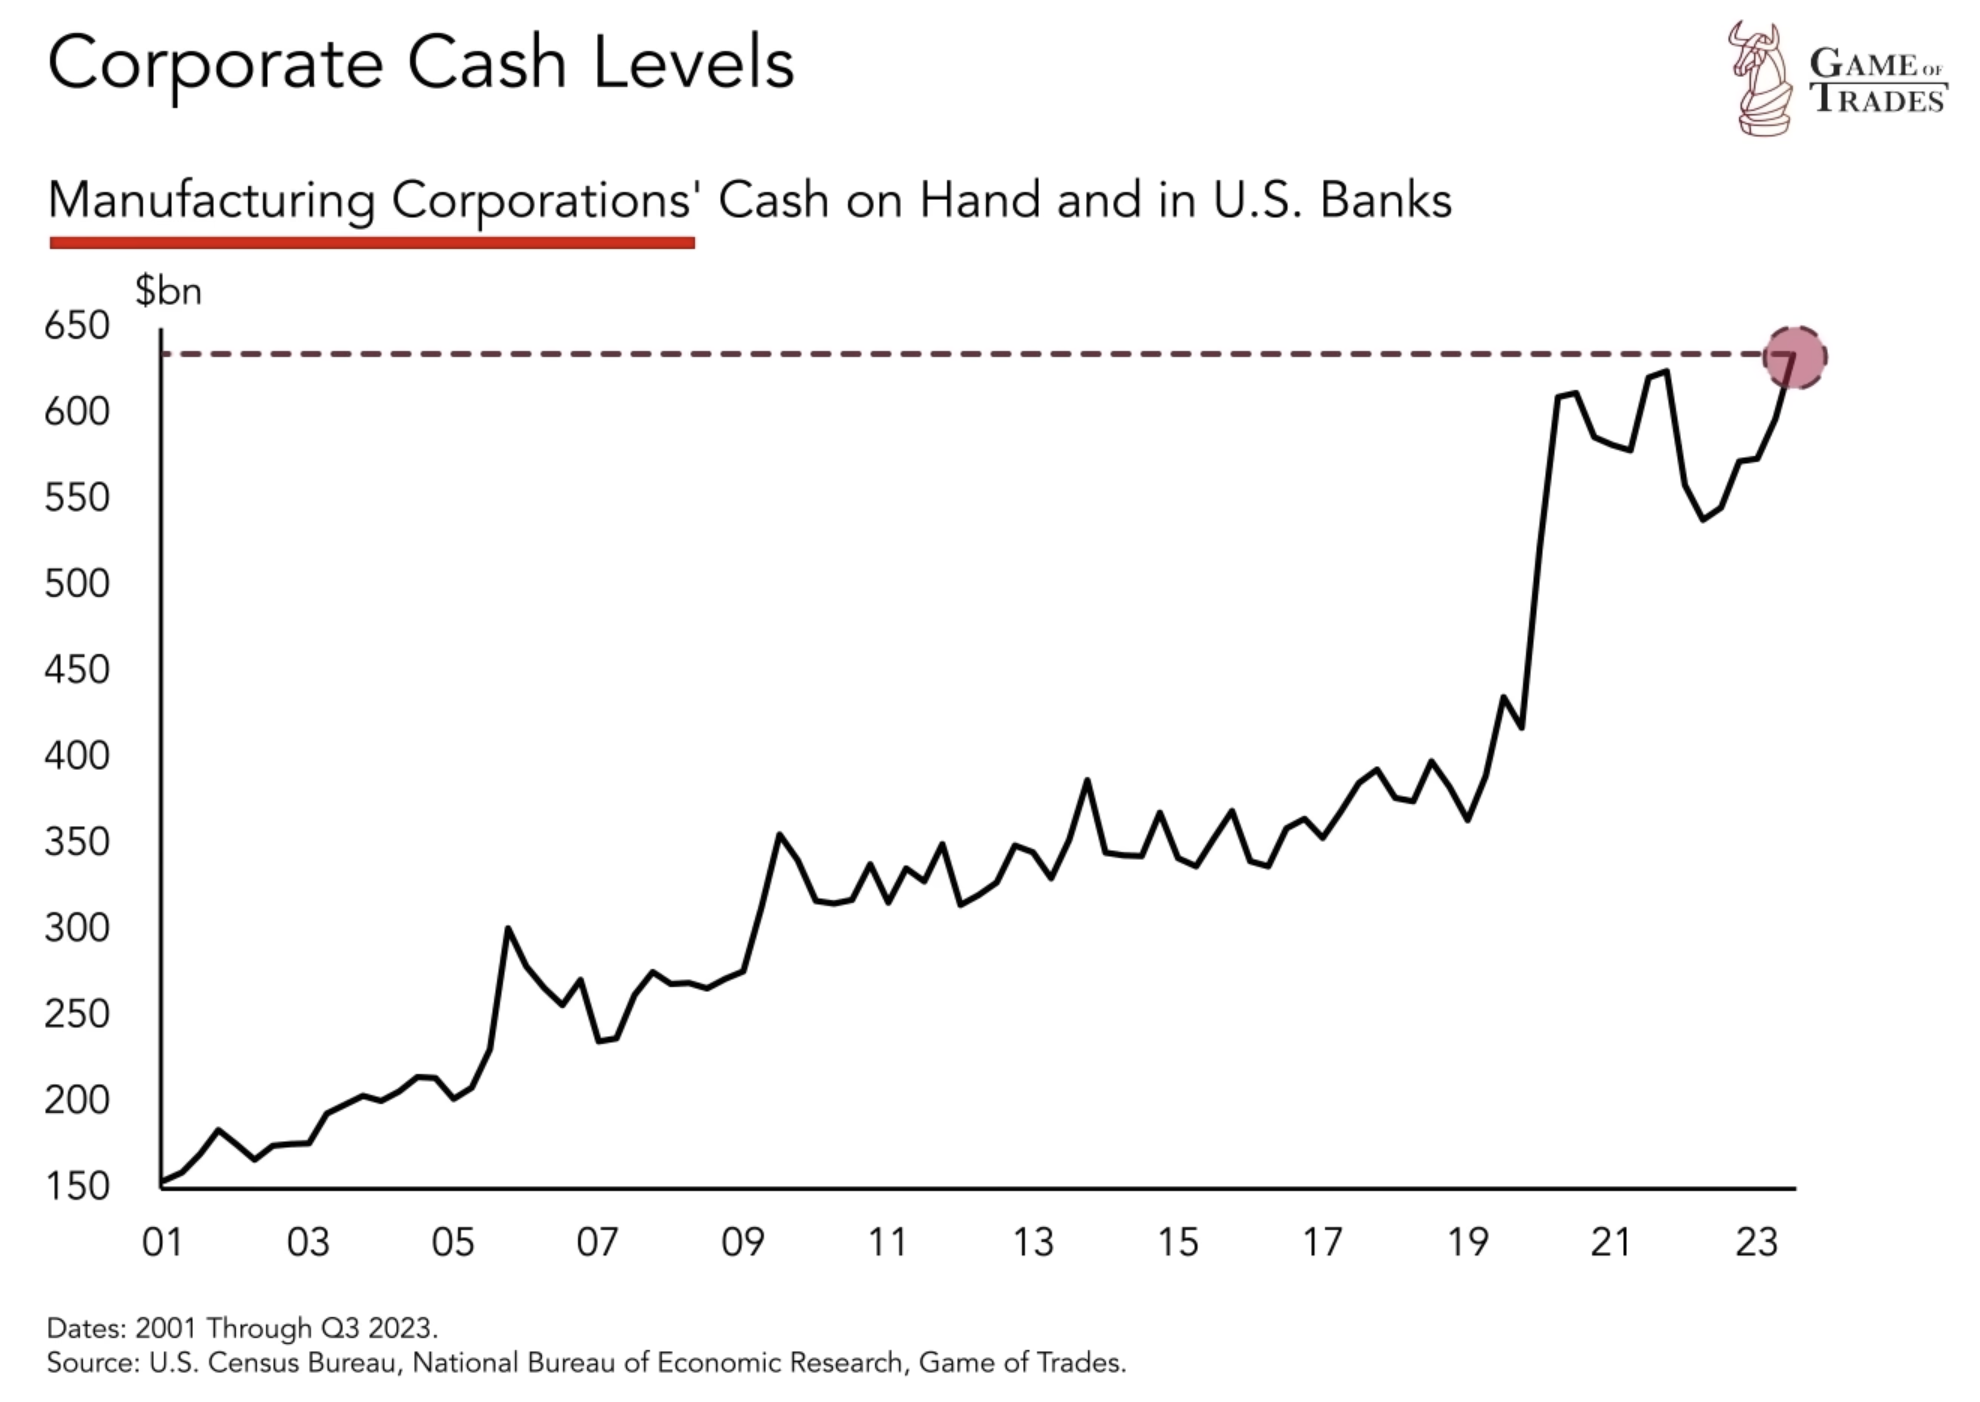
The Fed’s interest rate hikes in March 2022 coincided with a cooling job market, as higher borrowing costs slowed down spending, in contrast to the trend observed in 2021. However, the Fed must exercise caution when considering interest rate cuts. If businesses resume hiring, it could lead to an increase in inflation. US corporations currently hold over $600 billion in cash from pandemic stimulus, which, if used for hiring, could trigger a wage-price spiral. A wage-price spiral occurs when workers seek higher wages thus raising business costs, prompting price hikes for goods/services. This ups cost of living, sparking more wage demands, thus fueling an inflationary cycle.
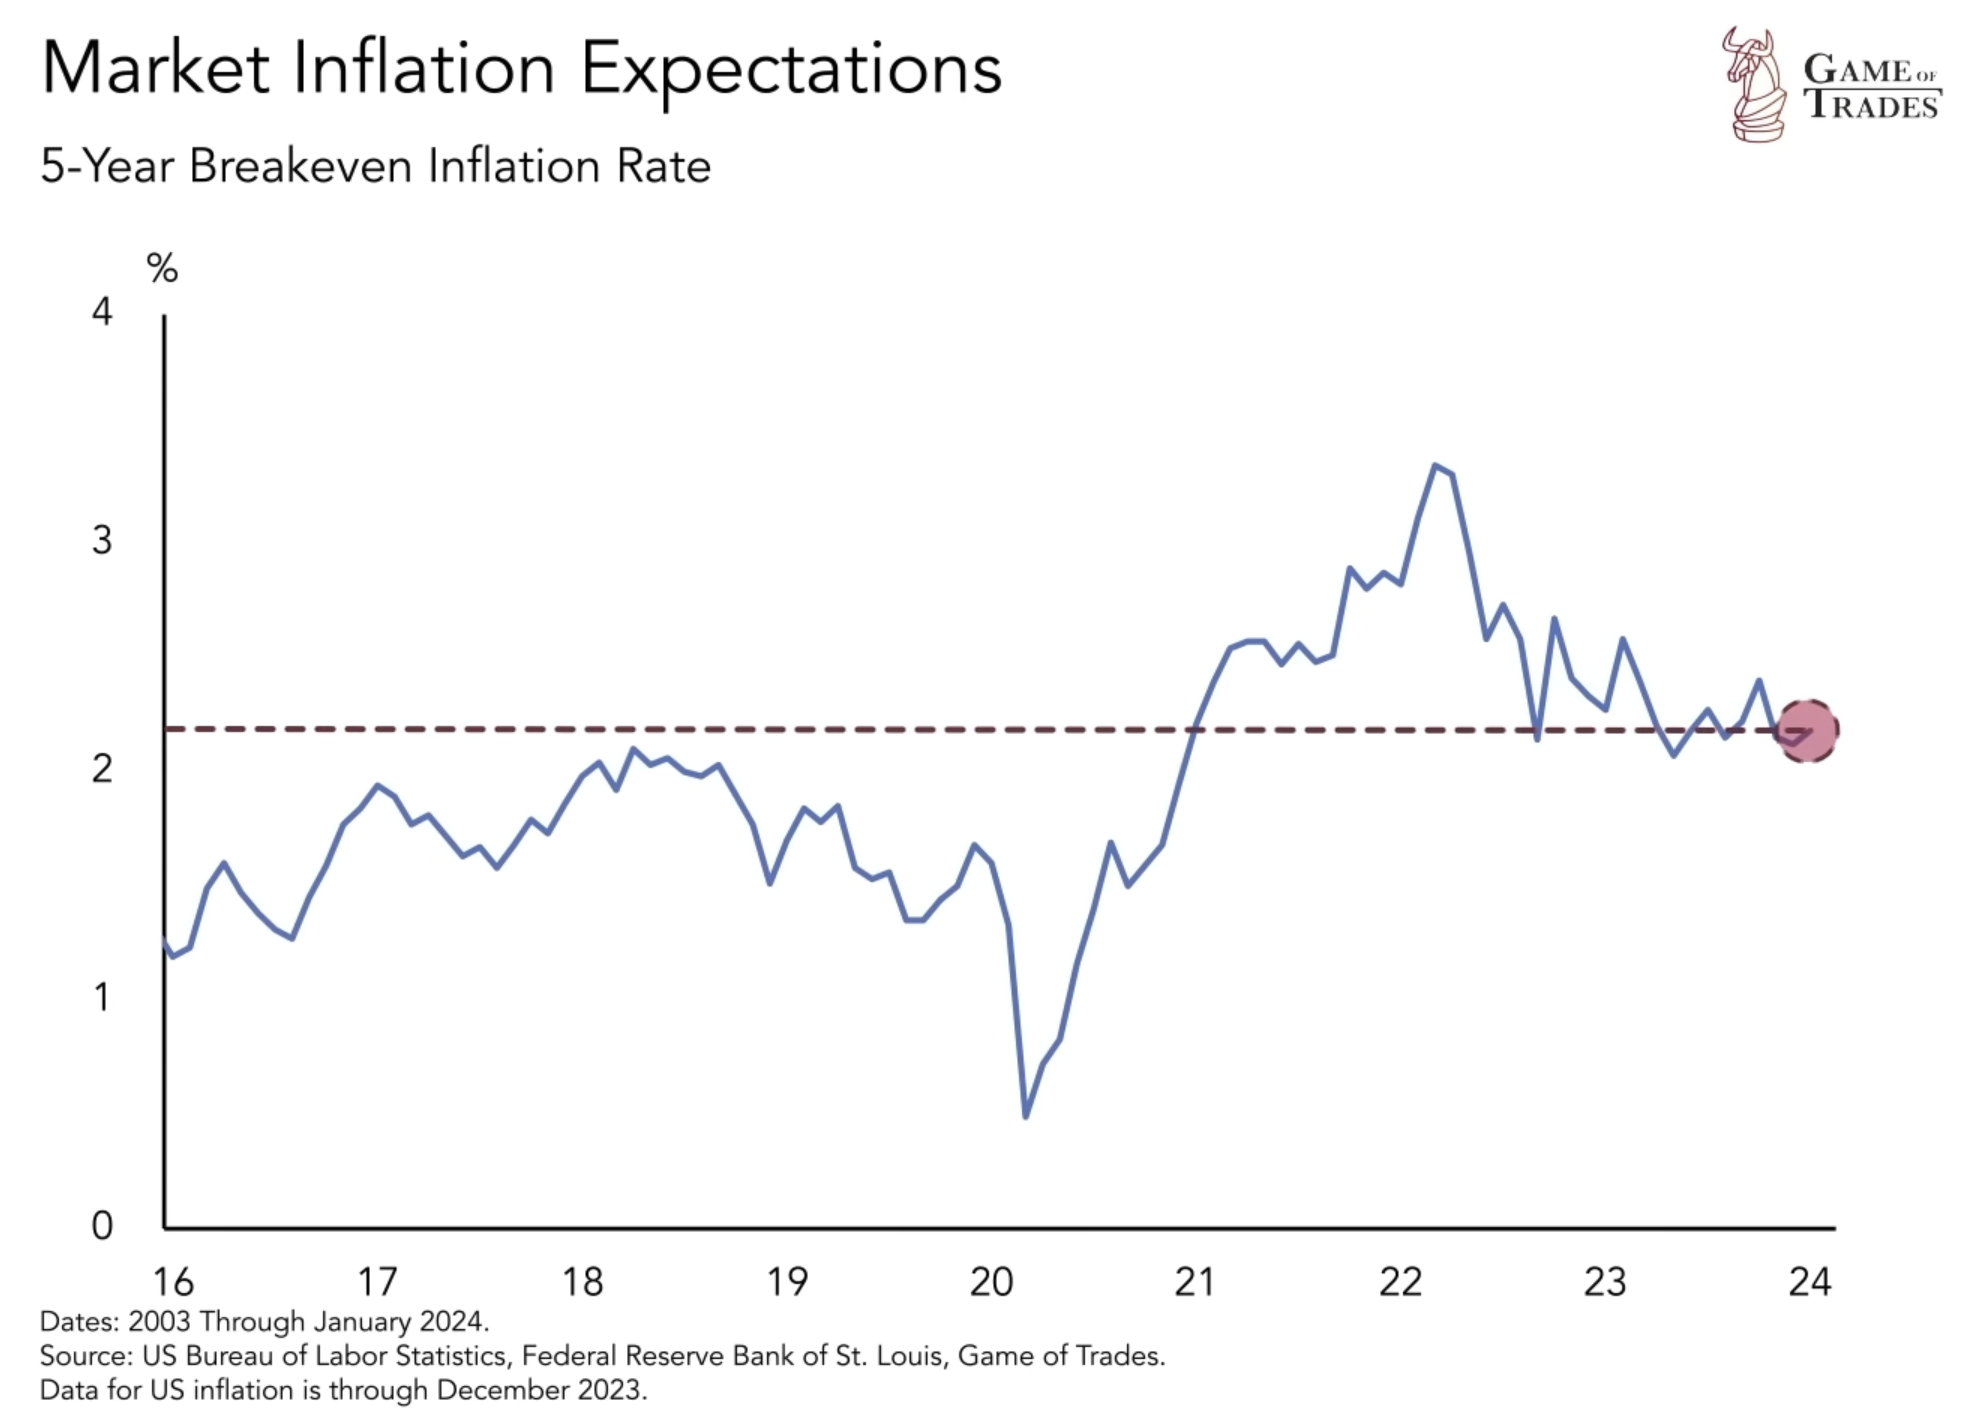
Despite concerns, 5-year break-even inflation rates (measure of expected inflation) remain steady around 2%, indicating that financial markets foresee stable future inflation. Moreover, it is noteworthy that people’s savings relative to income are at historically low levels, currently negative, a phenomenon that has only occurred twice since 1947—in 2020 and during the 2008 financial crisis. On the other hand, if oil prices, which are largely driven by economic activity, begins showing upside momentum in the near future, it could signal a speeding up of inflationary pressures once again.
Conclusion
As individual investors navigate these inflation waves, understanding the interplay between various economic factors and closely monitoring indicators can help inform investment decisions and manage risks effectively. The drivers of inflation, including supply shortages and excess demand, have played a significant role in recent years. The impact of pandemic-related factors on household savings has also been substantial, with savings now fully depleted, potentially leading to a continued decline in inflationary pressures. However, key indicators, such as fluctuating business costs, suggest an incoming inflation uptick. Rising wages and a robust job market further contribute to inflationary pressures. The Fed’s management of interest rates also plays a crucial role in shaping inflation trends. While the 5-year breakeven rate remains around 2%, it is important to closely watch oil since the latter is largely driven by economic activity. Click here to get free trial for 7 days! Subscribe to our YouTube channel and Follow us on Twitter for more updates!
Read more: The Role of Recessions in Shifting Market Leadership: Insights from Nifty 50 & Dot-Com Bubble


