Over the last few months, we’ve seen fear amongst market participants increase precipitously and actually stay elevated for extended periods of time. One way to illustrate this is by looking at the 50-day moving average of the put-call ratio which reached 1.07 as highlighted on the chart below. The put/call ratio is a measure of fear and greed in the market.
You’ll quickly notice on the chart below that in the last instances where the 50-day ma of the put-call ratio hit 1.07, the market was nearing a significant low. This is not a market-timing indicator, however, it does speak to the fact that the current fear in the market is similar to what is typically seen near local bottoms during a bull market.
Put Call by gameoftrades_yt on TradingView.com
We can see how these readings play out during a bear market by looking at the 2006-09 period. These readings also often corresponded to local bottoms during the vicious bull market of 08, one of the readings occurred in March 2008 before the infamous “bull trap”. Of course, this is a limited data set to draw any real conclusion from but does give some additional context to the current setup on the equity markets.
2008 Put call by gameoftrades_yt on TradingView.com
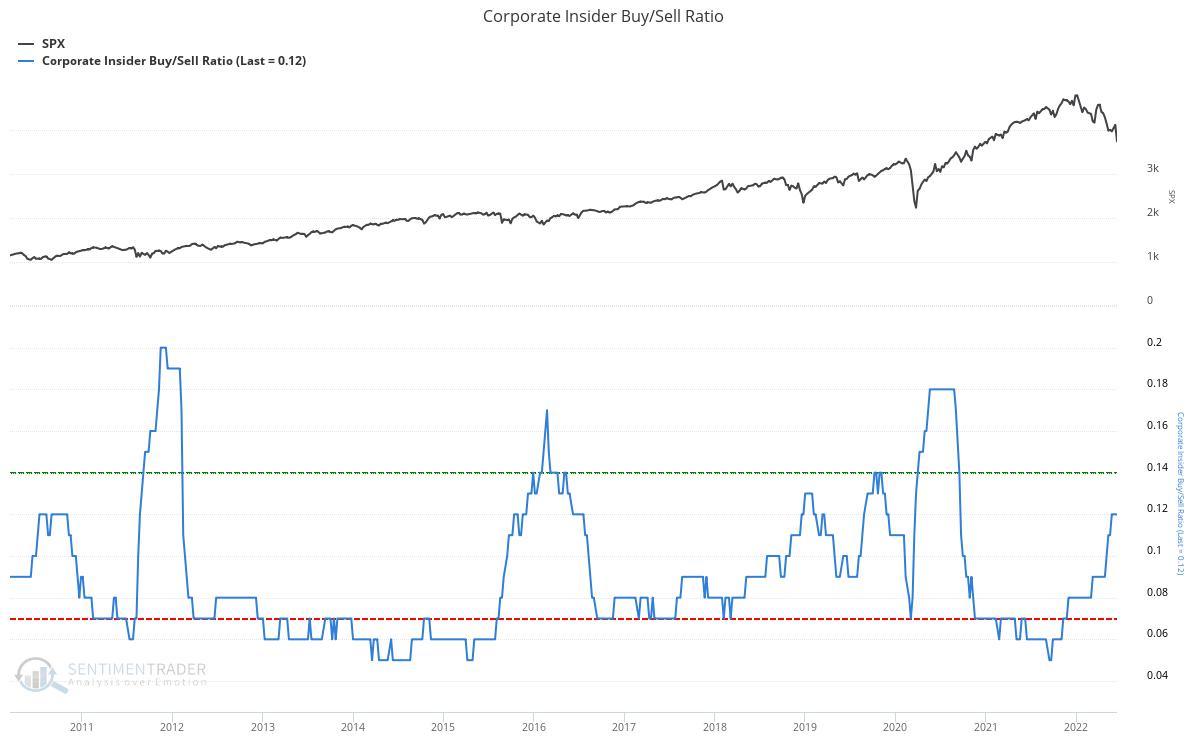
Another interesting development we’ve seen over the last few months has been a rising corporate insider buy/sell ratio. Corporate insiders must disclose when they trade their company’s stock. They are closely watched by the investment community as they often have a good view on the health of their company and whether or not the stock’s price is overextended. Spikes in the corporate insider buy/sell ratio often correspond to local market bottoms. We’ve not yet seen the ratio spike to quite the same levels as we saw in 2011, 2016 and 2020 but is currently at levels where we’ve previously seen significant lows occur.
Once again, while this data is interesting and insightful, the entire data set is based on recent bull-market price history which could lead to a bias.
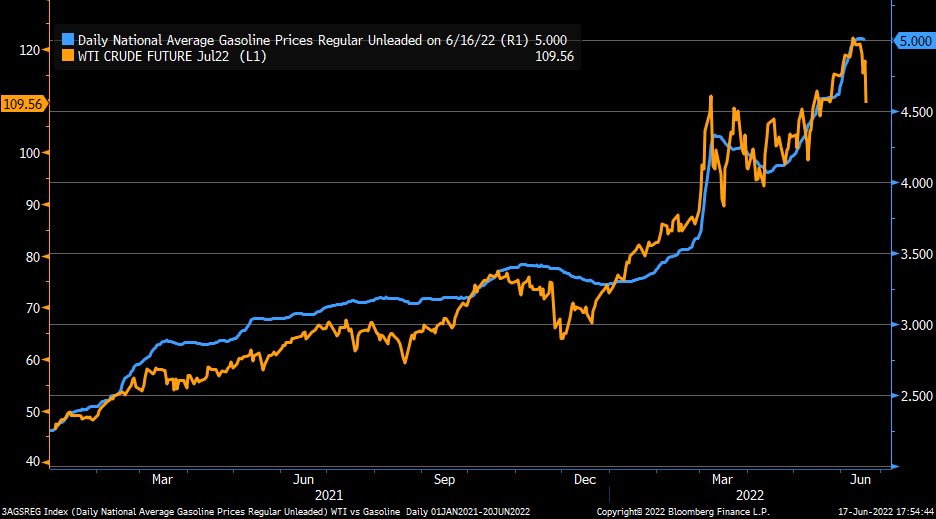
Oil broke down very aggressively last week which could signal the beginning of a larger move down in the commodity. Weekly momentum is beginning to flip into bearish territory which could materialize into large downside if we see oil prices follow through on the recent breakdown, we are watching this chart carefully.
The bullish setup on the stock market remains very much anticipatory, seeing follow-through on this move would increase the odds of seeing disinflation materialize and the bullish case play out. Market participants are well aware of this, oil needs to give up the ghost in order for the primary driving forces pulling down the market to dissipate (inflation and rising bond yields).
Oil by gameoftrades_yt on TradingView.com
The chart below shows there is a lag time between crude oil futures and what consumers pay for gas.
On a more fundamental basis, I would like to see some estimates of S&P 500 2022 and 2023 earnings. And also an estimated market PE on those earnings. Even a range of earnings similar to this video, with a better case, an even case, and a lower case. I am guessing the estimates would produce similar S&P results to this video, although personally I see the high end number 4800 a little lower unless the PE expands upward from current levels. The real question for me is if we have a recession, what will happen to earnings relative to 2021 numbers = 208.53. Will earnings still grow if we have a recession, be about the same, or drop significantly relative to 2021? A review of earnings results in other recessions would be helpful. I think the primary drivers of that answer include inflation, potential housing price declines, potential unemployment increases, and potential corporate profit margin declines if inflation stays higher and the economy /consumer weakens — meaning corporations can\’t fully pass on higher costs.
Fantastic comment. Worried about earning hit due to consumer tightening their belts too, with mortgage rate surge and everything.
I am amazed by the strong correlation of M-PMI and 1 year SP500 returns. A question though, I expected to see some divergence of the normalized SP500 annual return from M-PMI in 2021 given PE expansion then. That not the case, I guess? And how does M-PMI look in relation to annual earnings growth on the SP500? Expected that would be the stronger correlation given PE expansion and contraction of the SP500.
Very interesting correlation without a doubt! Your comment on PE expansion is correct but this is not very visible on the chart. In around June 2020, the market was flat on a year-on-year basis (was on the 0 line in the middle) while PMI was indicating that the stock market should be down around 25% back then. This is partly what took many off guard back then (another big divergence between PMI and stock performance).
For your second question, yes PMIs and SP500 earnings are highly correlated.
Got it. Those two offset each other. Thank you
The supply chain is rapidly opening up which could be the catalyst for the rest of your forecast.
Great article
Thank you for a good video. Can you please do the same type of update for Crypto highlighting different scenarios after these disasterous moves down.
Any opinion on why the 10yr yield has dropped so significantly after a 3-day spike in the yield that sent the SP500 into a bear market? Some people, including me, believe it is the FED stepping in once again to prop up the bond market to prevent the inevitable stock market crash. If we are right about the actions of the FED their action would exacerbate the current inflationary environment that the market selloff is responding to, presumably causing a further selloff. Has GOT considered this affecting the market further to the downside?
https://youtu.be/ERDdrdHTCzk Useful video with Art Berman that seems to support the thesis on oil. Lots on how Ukraine has changed the outlook. Interested to know whether Emerging Markets could be in a long term bear market. Crucial long term investment, but could be 10 years of stagnation.