Quick Tactical SP500 Overview After 2 Consecutive >1% Red Days:
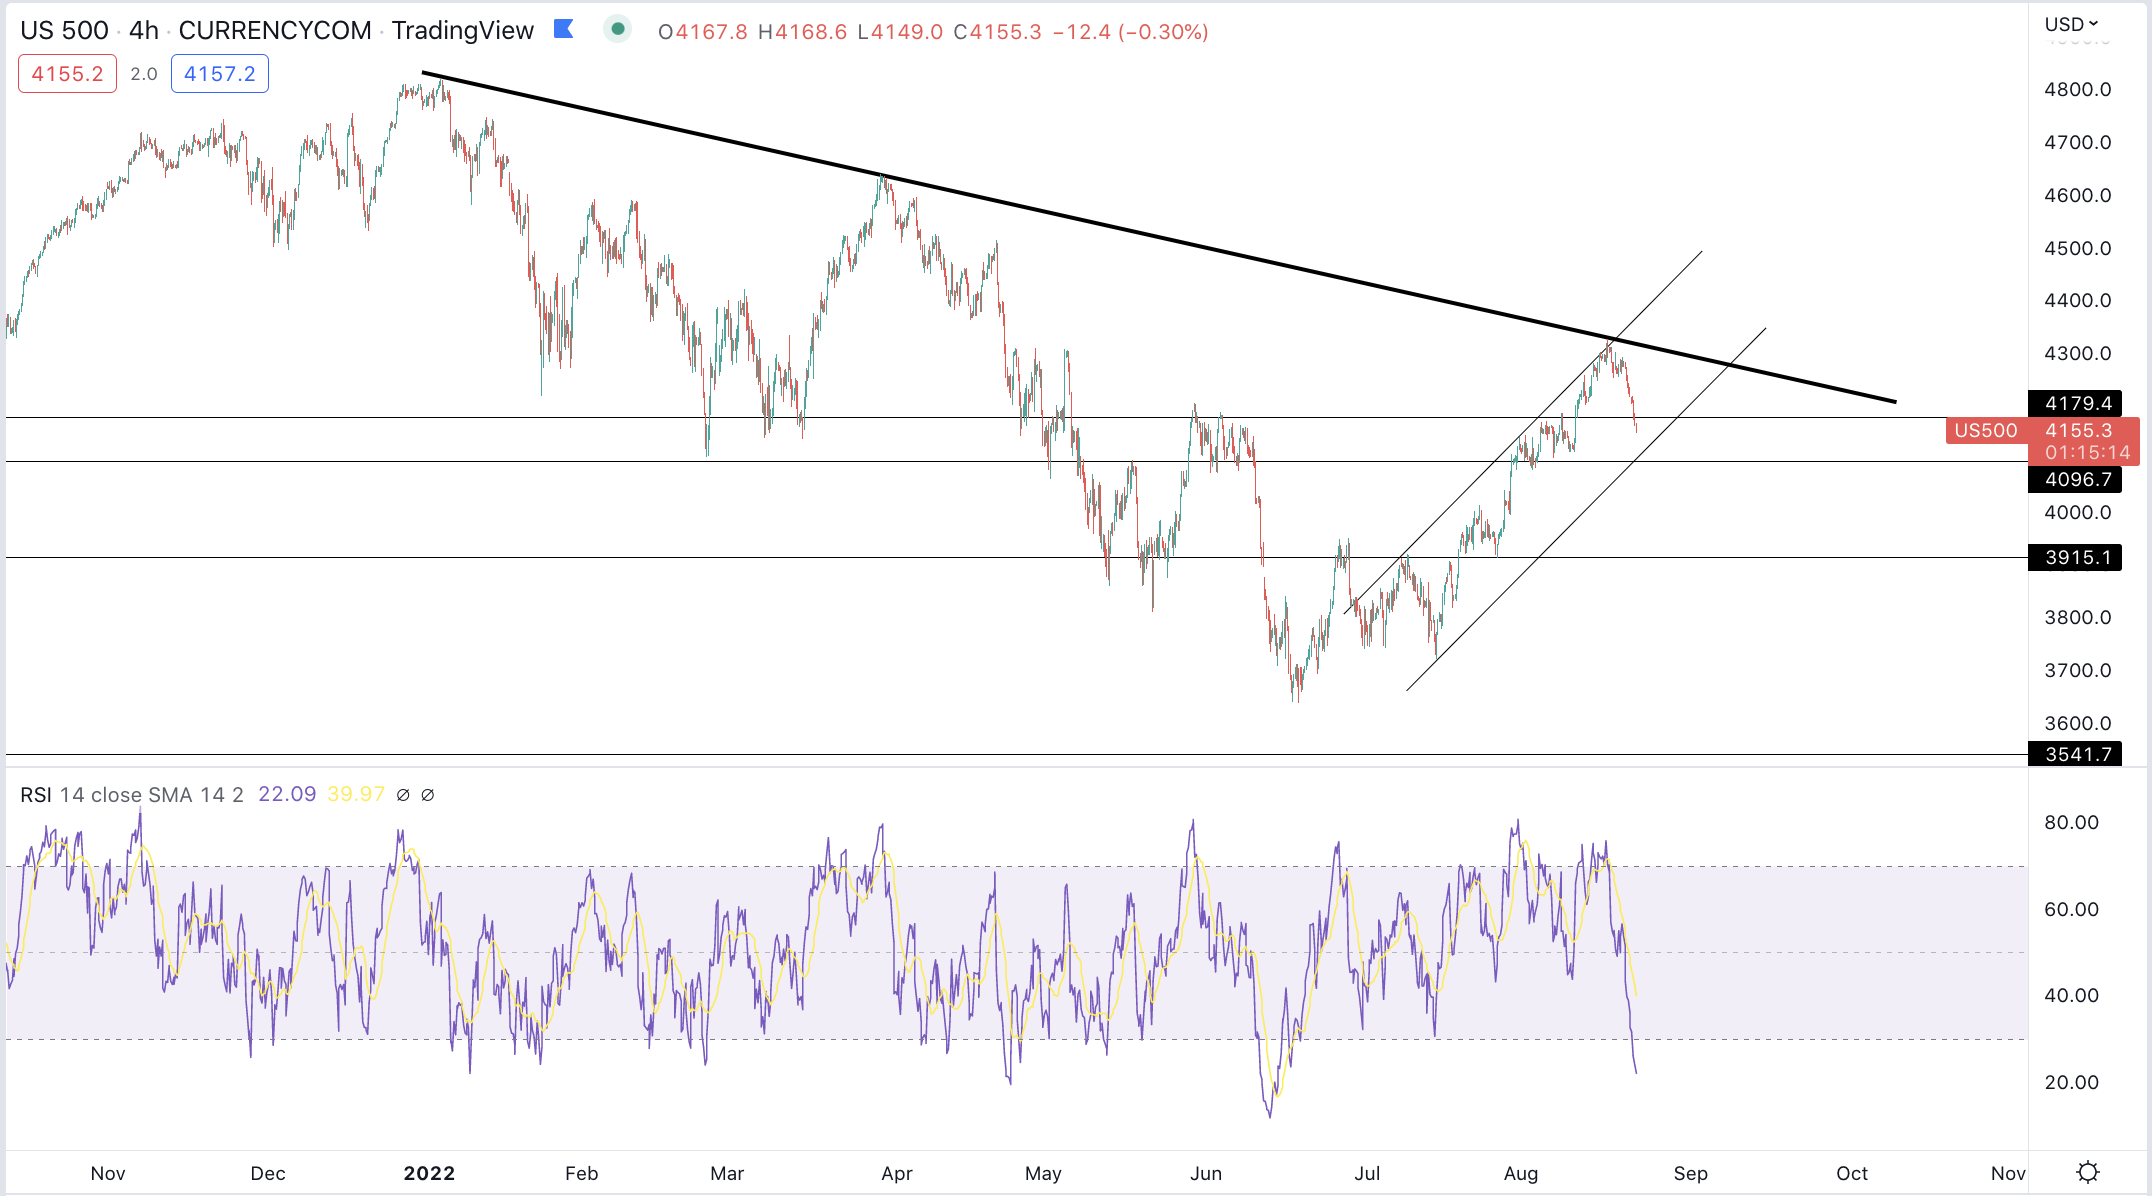
After rejecting off some key levels of resistance, the SP500 has been trending down quite violently. The index hit our first support level at 4170 points and is heading towards our second big level of support at 4085 points.
The SP500 is very oversold on the short-term time frame (4h chart) which may suggest it finds support around the bottom of the price channel highlighted on the chart below. During uptrends, the market tends to mark a significant bottom at such oversold RSI readings.
Failure to hold the 4100 support level would indicate that dip-buyers are not stepping in when the market is oversold. It would break short-term technical structures (such as the bullish price channel highlighted below) and increase the odds of seeing a deeper pullback to 3900 points or potentially back to retest the June low. All the key internal, sentiment and technical developments highlighted in the latest SP500 tactical update still apply today.
We’ll be covering all of this in further detail in tomorrow’s premium video.
Here is today’s Youtube video:
Hi @GOT would you comment on DXY and its impact on the current pullbacks?
An add-on question regarding DXY – why has DBC (commodities index) been moving with DXY when prior to March they were inversely correlated?
DXY started to move up as global uncertainties increased recently. The European economic situation is showing a slowdown in business activity. European inflation woes do not seem to be letting up as last week England reported that CPI rose to 10.1% annually, higher than the consensus forecast of 9.8% and up from 9.4% in June. The Bank of England expects inflation to top out at 13.3% in October. German producer prices (PPI) increased 37.2% on the year, including a 5.3% month-on-month increase. China’s central bank trimmed some key lending rates on Monday in an attempt to support a slowing economy and a problematic housing sector. With increasing uncertainties, the Euro/USD dropped, the USD/Chinese Yuan increased and the DXY appreciated. An increasing US Dollar is a headwind for stocks.
DBC is increasing based on China’s stimulus and interest rate cut. The rate cut plan is geared to help the property sector. A boost to real estate is a boost for commodities.
GOT why didn’t you mention the divergence between the MACD and SP500 price action on the weekly chart? Don’t you think that is somewhat of a significant thing to discuss?
Not sure we see a MACD divergence on the weekly chart. What are you referring to? Generally speaking, we don\’t see that much value in divergences on the weekly chart because they could take a long time to trigger. For example, in January 2014 there started a MACD divergence on the S&P 500 weekly chart. It took a year and a half for the correction to come. For a more custom-tailored response, you could pose questions in the trading room.
Min 1:45
We don’t see a divergence. Could you elaborate on what you are seeing?
Fantastic analysis GOT! Quick question: how did you arrive to the SPX 5200 target? I was just looking over the charts this week (Sept 2)and looking at the SPX weekly chart, I see an inverse head and shoulders pattern forming on the weekly. Based on this pattern, I also arrived at the same target of $5200 🙂 I’m not sure how accurate H&S patterns are and how often they play out, but as long as the June lows hold, I think we may see this inverse H&S pattern play out so we’ll see. Many thanks for your great insights! I love combining your insights with my own independent analysis and it’s nice to see similar targets.