We have four new setups this week, while WMT turned active over the last week.
New Setups
- SCHW
- DIS
- SMH
- EMXC
Asset Classes
Equities
- Charles Schwab Corp (SCHW): New Setup
- Walt Disney Co. (DIS): New Setup
- Walmart Inc. (WMT): Pending→Active (Turned active September 29)
Equity ETFs
- VanEck Semiconductor ETF (SMH): New Setup
- iShares MSCI Emerging Markets ex-China ETF (EMXC): New Setup
Commodities
- Copper Future (HG1): Pending
Equities
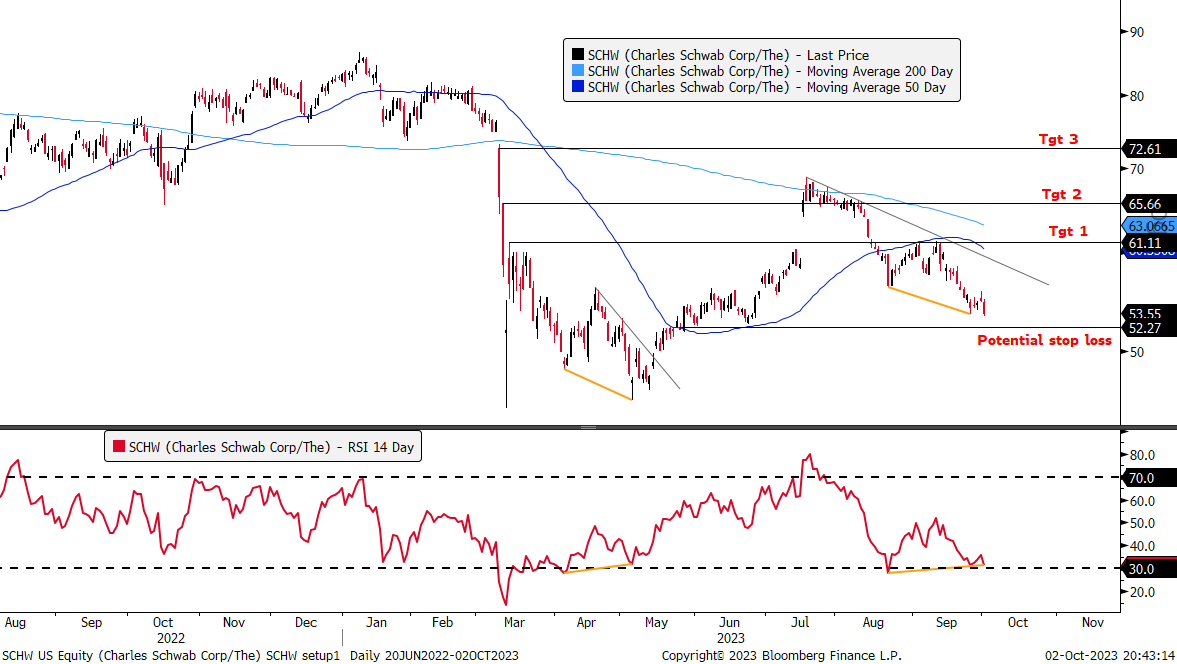
New Setup: Long Charles Schwab Corp (SCHW)
-Bullish divergence setup as price made lower low and RSI higher low in October compared to August levels.
-A break above the downtrend line starting in mid-July would active the long trade.
-Target 1 aligns with the 50-DMA, while target 2 aligns with horizontal support. Target 3 would see price move back towards pre-banking crisis levels.
-Price had recovered to the 200-DMA after the significant drawdown from the banking crisis, but failed there.
-A potential stop loss is placed slightly below current levels.
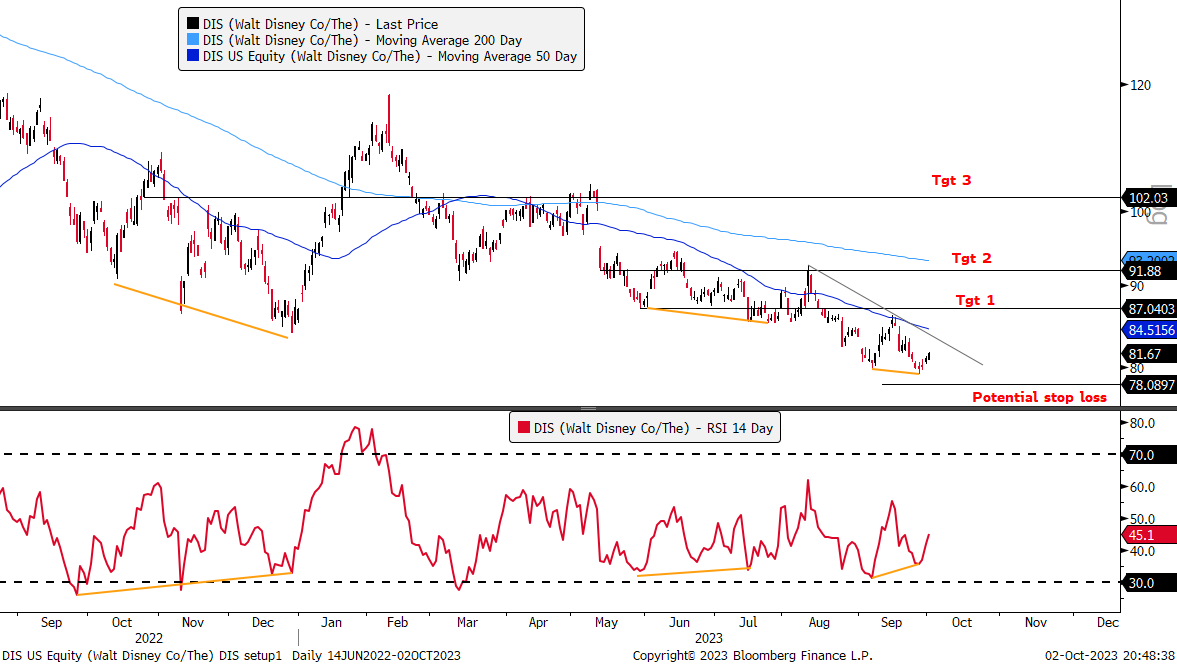
New Setup: Long Walt Disney Co. (DIS)
-Bullish divergence setup with price making lower low and RSI higher low at the end of September compared to beginning of September levels.
-A breakout above the trendline from August and the 50-DMA would provide an objective buy signal.
-Target 1 aligns with horizontal resistance while target 2 would see price rise back towards the 200-DMA. Target 3 is a lower probability target it would need to see price have a significant reversal higher.
-A potential stop loss is placed slightly below current levels.
Equity ETFs
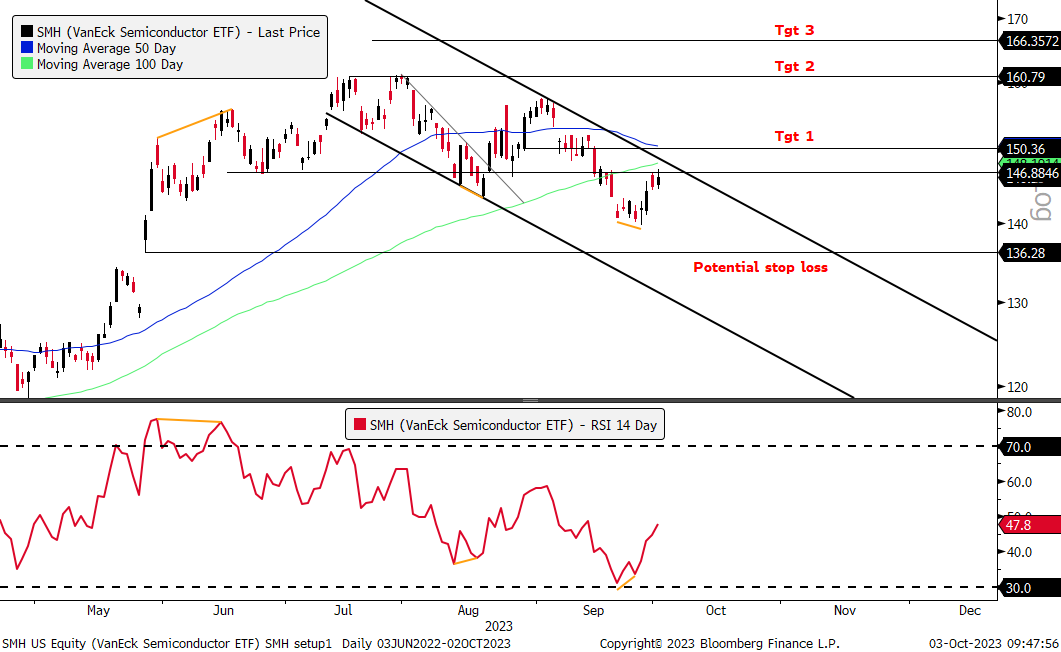
New Setup: Long: VanEck Semiconductor ETF (SMH)
-Bullish divergence setup as price made lower low and RSI higher low at end of September compared to beginning of September.
-A break of the $147 horizontal resistance and the upward price channel trendline would activate the long trade.
-The divergence is very short in duration so target 1 is close to the breakout level, aligned with the 50-DMA. Target 2 is at the YTD high while target 3 is at the 23.6% Fibonacci level should price break to new highs.
-Macro Catalyst: Semiconductors have been YTD leaders before the recent correction in August and September. If interest rates settle down or potentially move lower, they could re-assert themselves as leaders for a year-end rally.
-A potential stop loss is placed at the top of the unfilled gap from June.
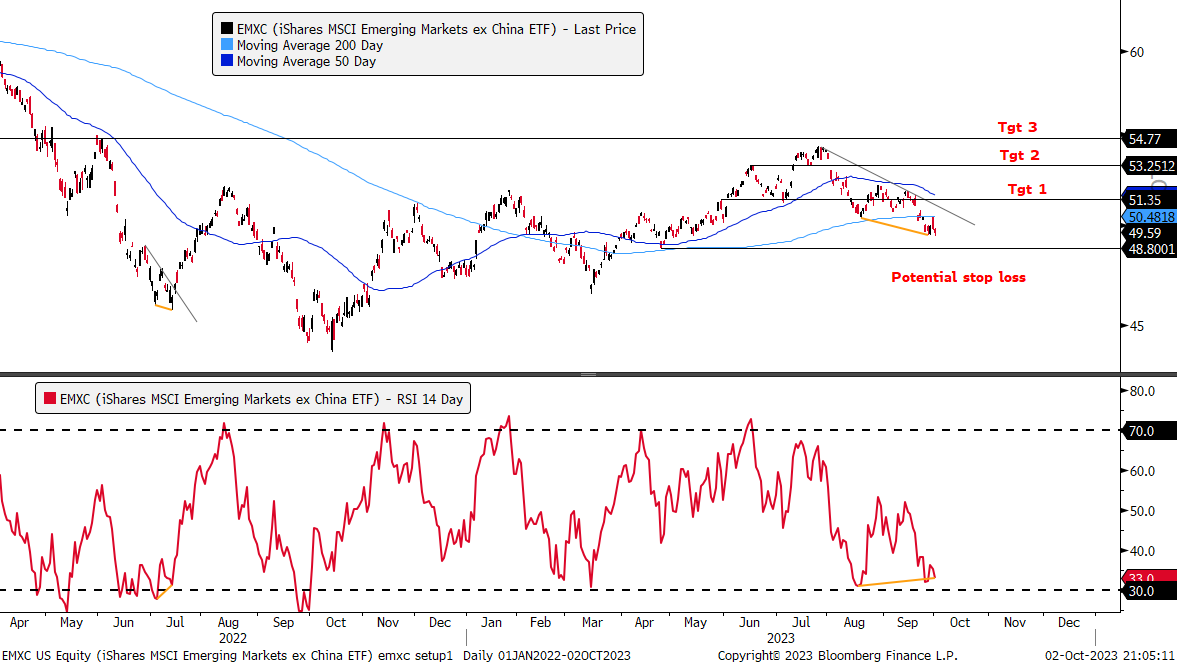
New Setup: Long iShares MSCI Emerging Markets ex-China ETF (EMXC)
-Bullish divergence setup with price making low and RSI made higher low in September compared to August levels.
-A breakout of the trendline that starts in July would activate the buy signal.
-All targets align with horizontal resistance levels, including target 1 which would meet the 50-DMA.
-Macro Catalyst: A reversal in the US Dollar could see emerging market stocks push higher. Stimulus from China could also help EM stocks ex-China given a strong goods trade relationship.
-A potential stop loss is placed slightly below current levels at horizontal support.
Commodities
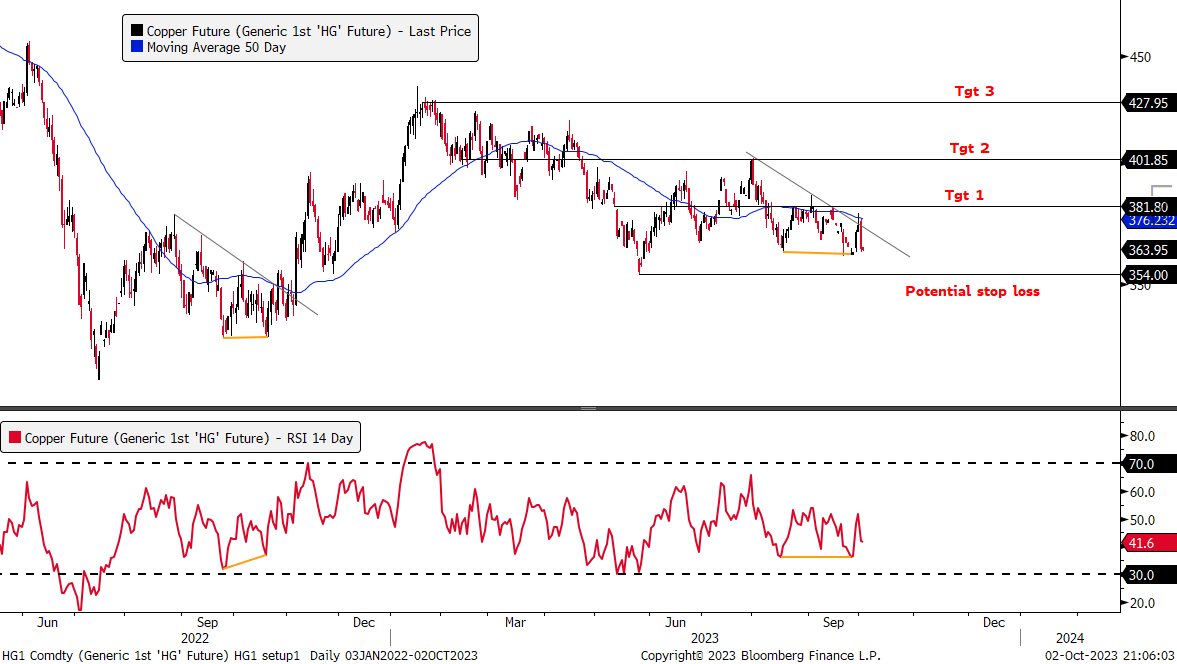
Long Copper Future (HG1)
-Bullish divergence setup with price making lower low and RSI higher low in September compared to middle of August levels.
-A break above the short-term trendline extending from beginning of August would prompt the buy signal.
-Price slightly broke out above the trendline, but that was on an intraday basis, keeping the trade from turning active.
-Target 1 and 2 aligns with key horizontal resistance levels while target 3 would meet the 2023 highs.
-Macro Catalyst: With the US Dollar Index up for 10 straight weeks, a reversal lower there could help commodities near term. Continued stimulus measures in China could also help propel copper.
-A potential stop loss is placed slightly below the YTD lows.
I have a feeling that updates to Trader Watchlist lag week or two
SMH already played out.. that was the divergence play on 9/27 and with the 10yr yield going up as it is SCHW is probably a short, not a buy.
It would be much better if you could include a more detailed chart with some dates other than the month. Many times I struggle to replicate your chart even though i have the same time frame, to the point that I just give up trying to figure it out. SMH is a great example of that, where I can not confirm the divergence you are suggesting. Are you being this vague for a reason?
Chart is the daily. 50 & 100 EMA. RSI is 14day…
Trading view charts it ok.