If you missed it, we provided an introductory video that summarizes the Trader Membership and its strategy.
We further went into depth surrounding our view on the potential stop loss levels in this report, and ways we think about entry prices in this report.
New Setups
- Merck & Co. Inc. (MRK)
- iShares Russell 2000 (IWM)
- Real Estate Sector SPDR Fund (XLRE)
Asset Classes
- Merck & Co. Inc. (MRK): New Setup
- Paypal Holdings Inc (PYPL): Pending → Active (turned active July 31)
- Walt Disney Co. (DIS): Pending
- Nvidia Corp (NVDA): Pending
- Walmart Inc. (WMT): Pending
- Salesforce Inc. (CRM): Pending
- Apple Inc. (AAPL): Pending
- iShares Russell 2000 (IWM): New Setup
- Real Estate Sector SPDR Fund (XLRE): New Setup
- iShares MSCI China ETF (MCHI): Pending → Active (turned active July 25)
- SPDR S&P 500 ETF Trust (SPY): Pending
- Bitcoin: Pending
Equities
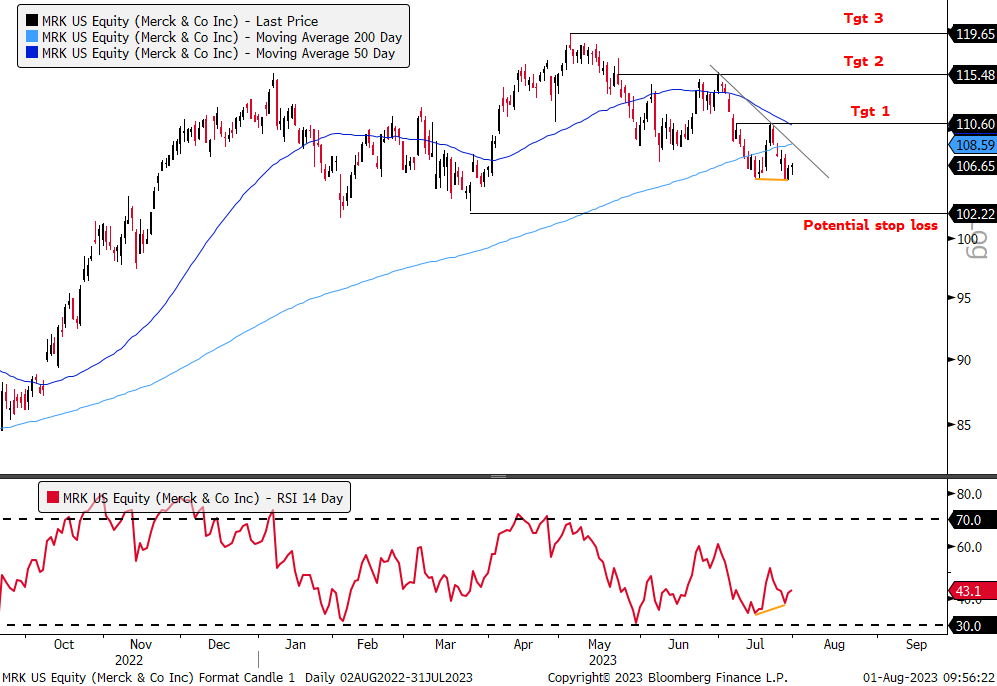
New Setup: Long: Merck & Co. Inc. (MRK)
-Bullish divergence setup with price making lower low and RSI making higher low at the end of July compared to mid-July levels.
-A break above the short-term downward trendline that starts in early July would provide a clear buy signal. A trendline break would also coincide with a move above the 200-DMA.
-Target 1 aligns with the 50-DMA, while target 2 is at the local top at the end of June and target 3 the year to date high.
-MRK has traded sideways for much of this year, so a rotation back into more defensive Health Care names could help see a sustained reversal higher.
-Potential stop loss is placed close to the year to date lows.
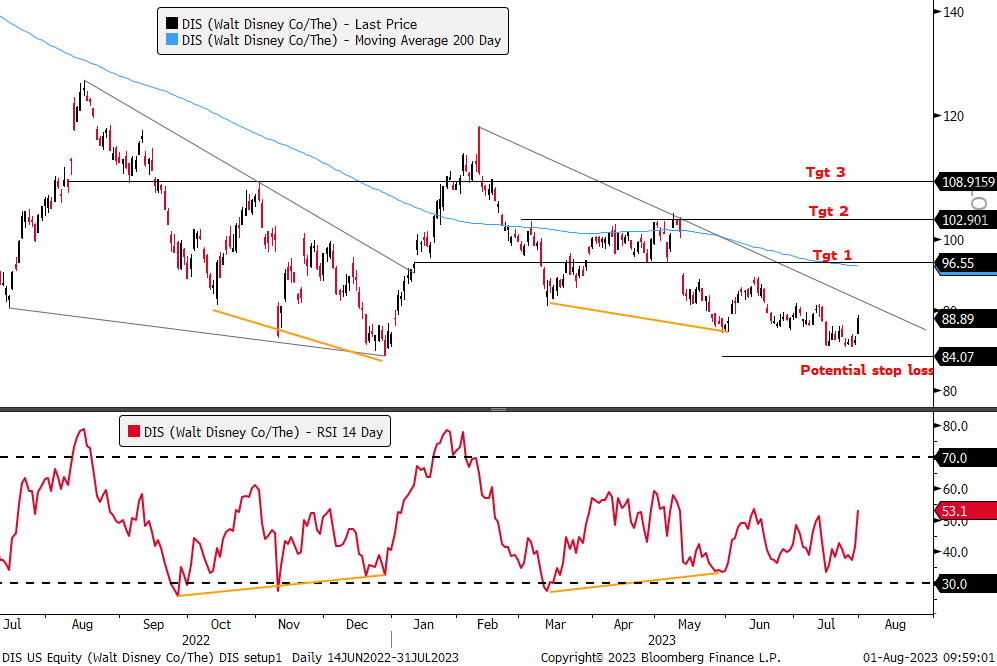
Long: Walt Disney Co. (DIS)
-Bullish divergence setup with price making lower low in May and RSI higher low compared to March level.
-A break above the downward trendline starting in February would provide an objective buy signal, activating a long trade on a close above it.
-The 200-DMA aligns with our first target, while targets 2 and 3 are consistent with key horizontal resistance levels.
-DIS has been a clear laggard in the Communication Services sector with no sustainable rally in 2023 despite the sector gaining over 30% this year, so there is a potential “catch-up” trade if there is a rotation to laggards within the sector.
-The potential stop loss is placed slightly below the YTD low to ensure traders aren’t stopped out of the trade too early if price were to test that level.
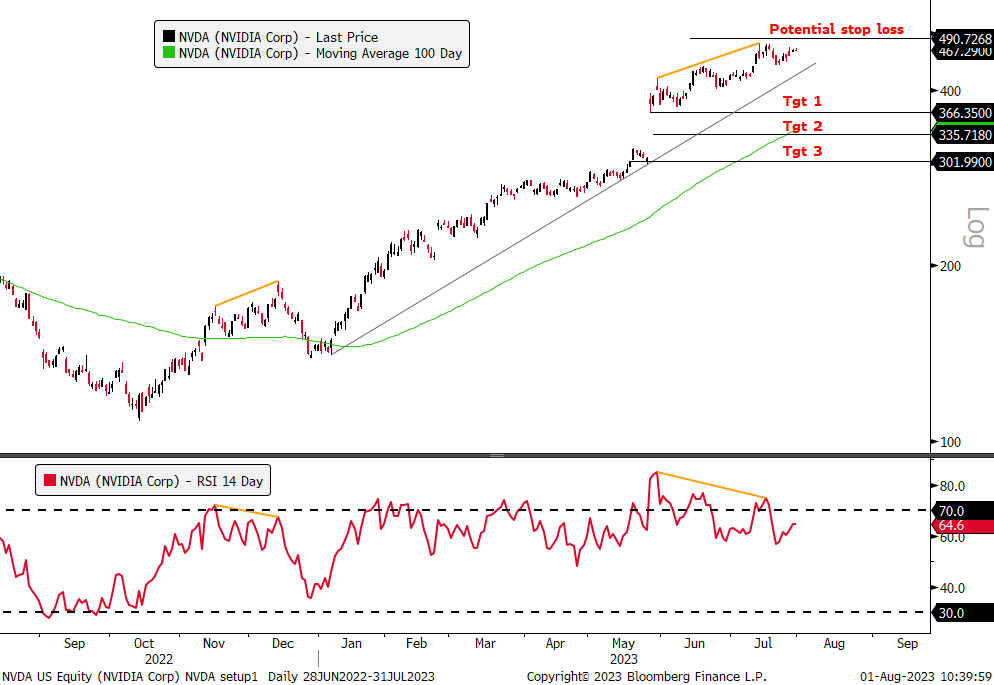
Short: Nvidia Corp (NVDA)
-Bearish momentum divergence with price making higher high in July and RSI making lower high compared to early June levels.
-A break of the primary upwards trendline dating back to January would provide an objective sell signal, activating the short trade on a close below it.
-The 100-DMA is currently in the middle of our target zone and currently at target 2.
-NVDA is the leader of AI craze, so placing stop loss only slightly above all-time highs will allow traders to get out of the trade quicker should AI optimism refuel.
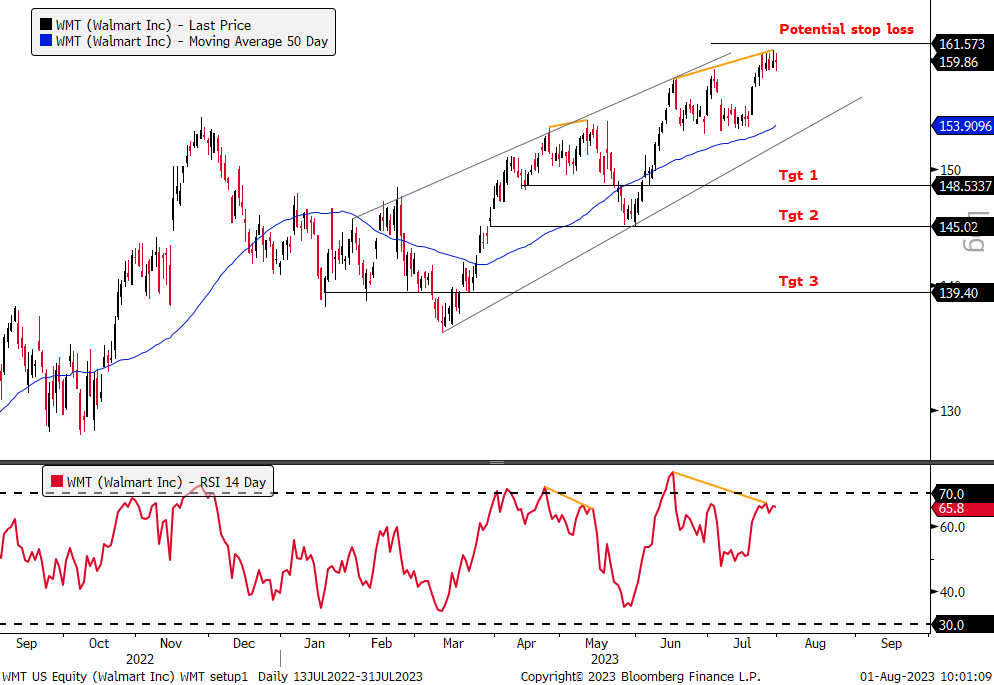
Short: Walmart Inc (WMT)
-Bearish divergence as price made higher high in late July and RSI lower high compared to mid-June levels.
-A close below the upward trendline from March would prompt the short trade.
-Divergence is only a few weeks old, consistent with tighter target levels. Targets align with key horizontal support levels, while target 3 would need to see a sustained reversal lower in prices in order for it to be met.
-Since March, WMT price action has been positive, but a break of trendline could change the recent bullish structure.
-Potential stop loss slightly above YTD highs, to allow for some leeway for retest before closing position.
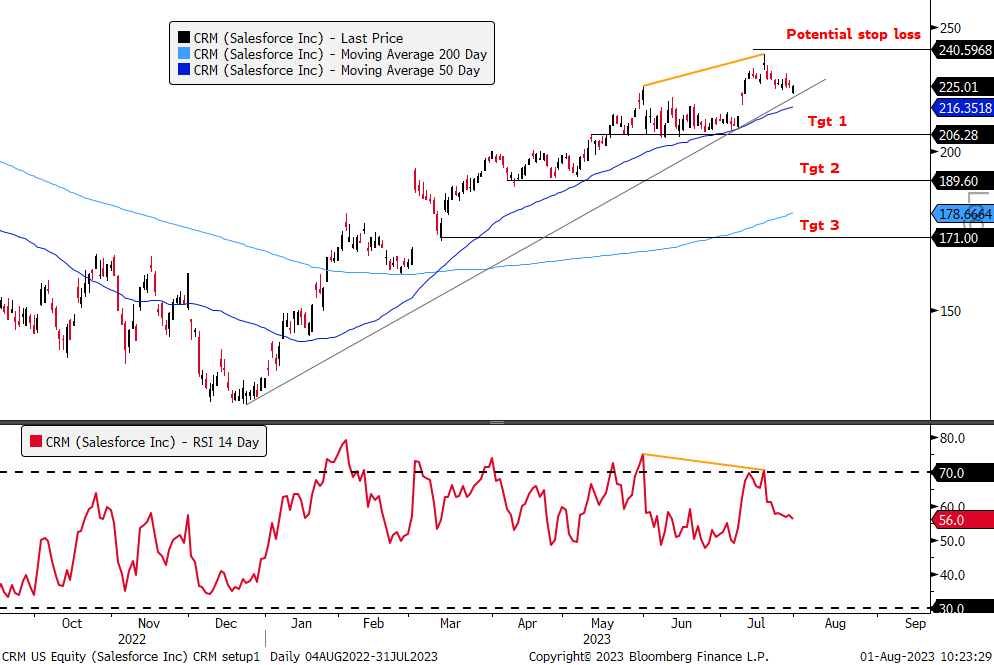
Short: Salesforce Inc. (CRM)
-Bearish momentum divergence with price making a higher high in mid-July and RSI making a higher low compared to end of May levels.
-A break of the primary upwards trendline from December of last year, which also coincides closely with the 50-DMA, would provide a sell signal and activate a short trade on a close below it.
-CRM is currently testing this trendline as this is posted which could be followed by a break (activating the trade) or a bounce, continuing the uptrend and potentially extending the divergence.
-Targets 1 and 2 align with key horizontal resistance while target 3 trades closely to the 200-DMA and the unfilled gap area from March.
-CRM has been in a bullish phase for much of 2023, until the recent consolidation around the $206 area from May to July led to a sharp move to a new YTD high. A break of this primary uptrend would be a decisive transition from its bullish structure however.
-The potential stop loss is placed slightly above the YTD highs, allowing for a retest before closing the position.
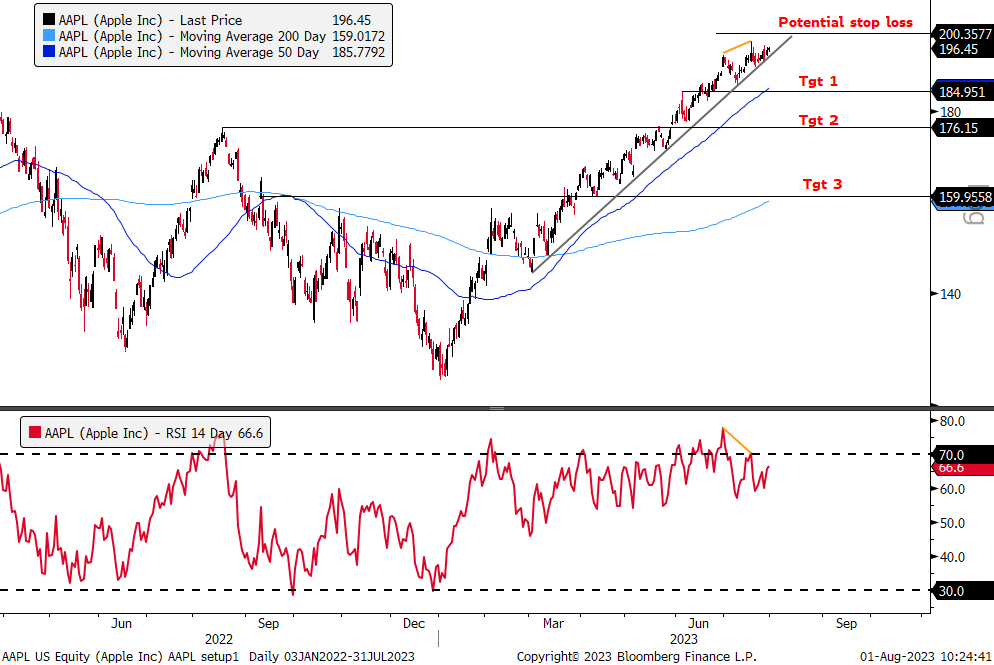
Short: Apple Inc. (AAPL)
-Price made higher high last week while RSI hit a lower high compared to end of June levels, prompting bearish divergence.
-A break of the trendline that dates back to early March would provide a sell signal to enter a short position. Apple reports earnings Thursday so this is a key stock to watch.
-Target 1 aligns with a check back to the 50-DMA, which price has not hit since January of this year. Target 2 is consistent with potential horizontal support levels while target 3 would see price test the 200-DMA.
-Apple has been one of the market leaders this year due to the AI optimism, but a break of this trendline that has held all year would be bearish for the stock and broad market.
-Potential stop loss is placed slightly above all-time high levels.
Equity ETFs
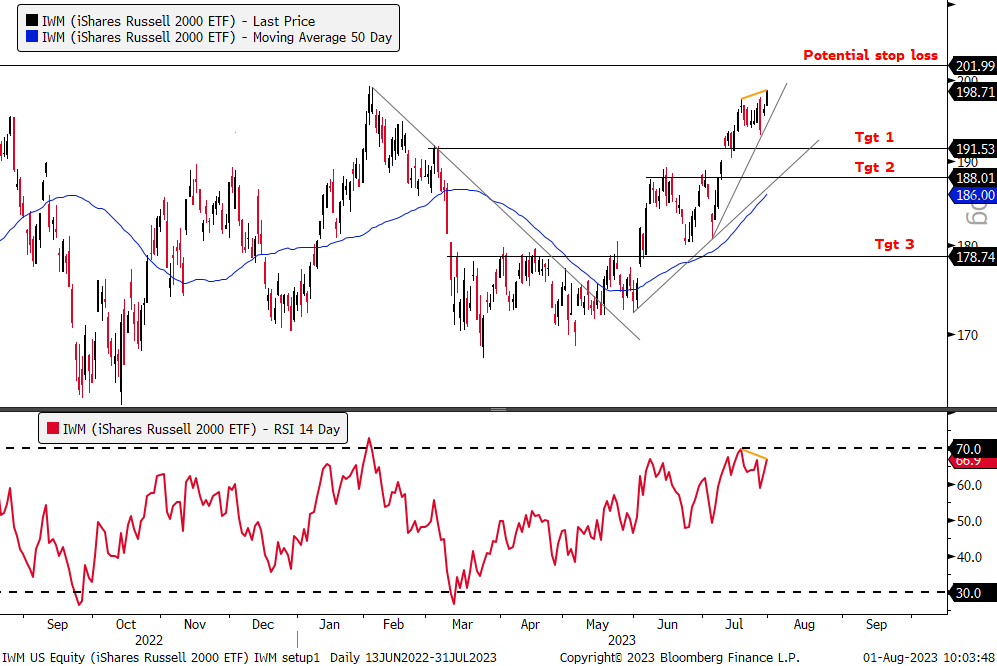
New Setup: Short: iShares Russell 2000 ETF (IWM)
-Bearish divergence setup as price hit higher high and RSI hit lower high in late July compared to mid-July levels.
-Given short-term divergence at just over a week, a break below the short-term from the beginning of July would prompt a sell-signal. The longer term trendline from late May could be met if the ETF falls to target 1.
-Target 1 also aligns with horizontal resistance, while target 2 would see price close to checking back to the 50-DMA. Target 3 is near a key resistance level.
-Small cap stocks have seen a bullish phase after underperforming in the beginning of the year by breaking out of their downtrend that started in February, so a reversal lower here could signal an ominous sign for the broad economy.
-Potential stop loss is placed at August 2022 levels, which would represent new 52-week highs.
-Macro Catalyst: Economic data surprises to the downside which causes the more volatile and economically sensitive small caps to fall.
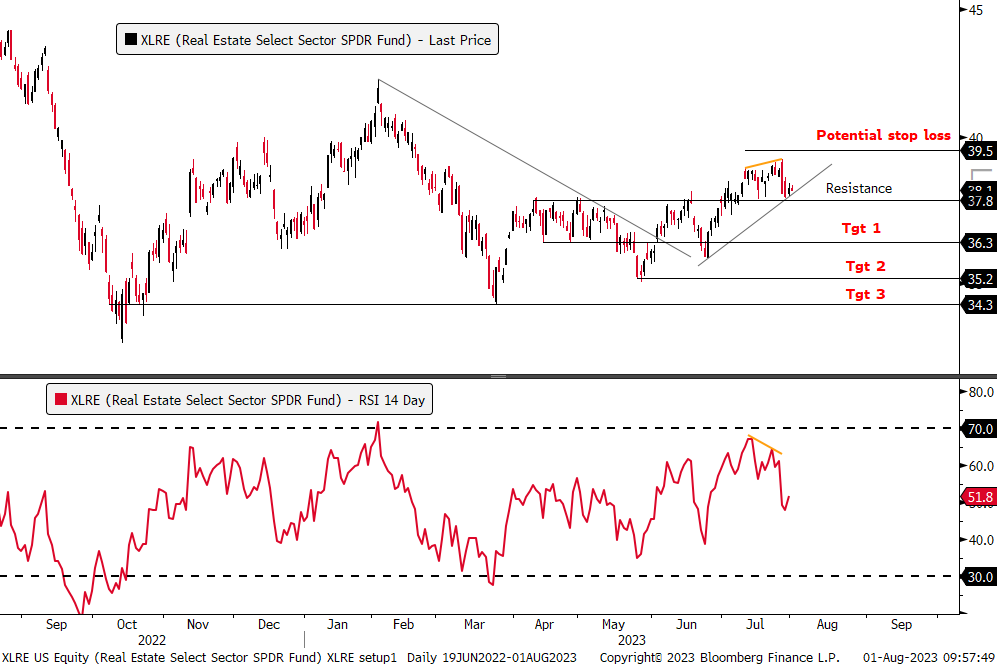
New Setup: Short: Real Estate Sector ETF (XLRE)
-Bearish divergence with price making higher high and RSI lower high in late July compared to mid-July levels.
-A break of the upward trendline from June and the horizontal resistance line would provide an objective sell signal.
-Targets are relatively tight given the short-term divergence, all of which align with horizontal resistance levels.
-A potential stop loss is placed slightly above the July highs.
-Macro Catalyst: If the recent move higher in interest rates continues, this could spark a negative reaction from equities that tend to be viewed as bond proxies with high dividend yields, including Real Estate.
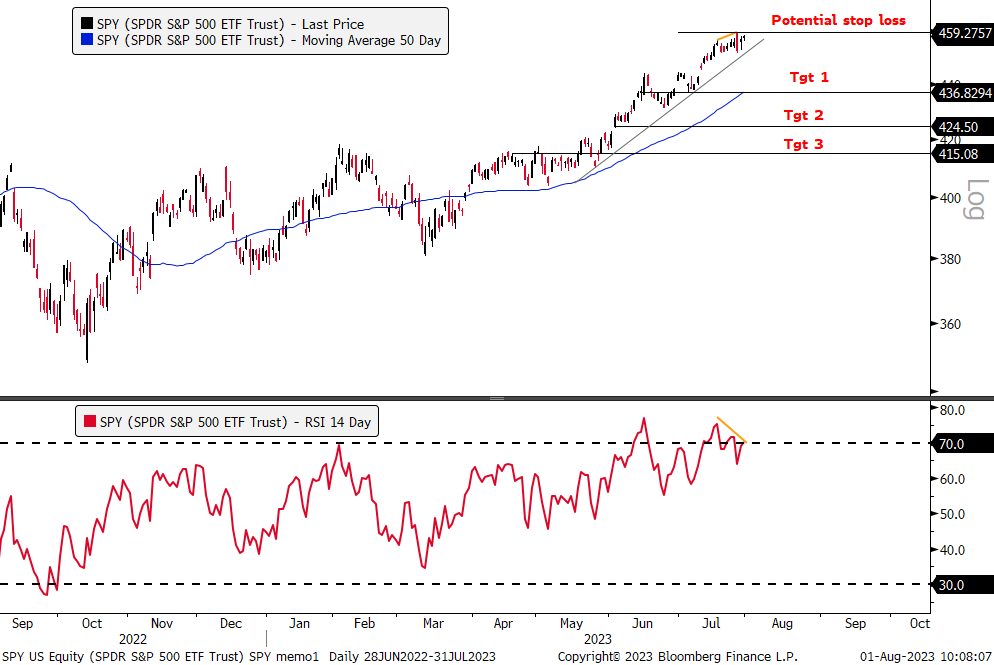
Short: SPDR S&P 500 ETF Trust (SPY)
-Bearish momentum divergence with price making higher high at the end of July and RSI making lower high compared to mid-July levels.
-A break below the short-term support line from mid-May would provide a sell-signal.
-Given the divergence is only two weeks old, this trade has closer targets to increase the potential success rate.
-After trading sideways for all of April and May, the S&P 500 recently broke higher, but this negative divergence could lead to weakness, including a checkback to the 50-DMA, which is at target 1.
-Potential stop loss is placed just above YTD highs.
-Macro Catalyst: With the recent euphoria, any deterioration of hard economic data, including this weeks July jobs report, could bring back recession concerns and cause weakness in equities.
Cryptocurrencies
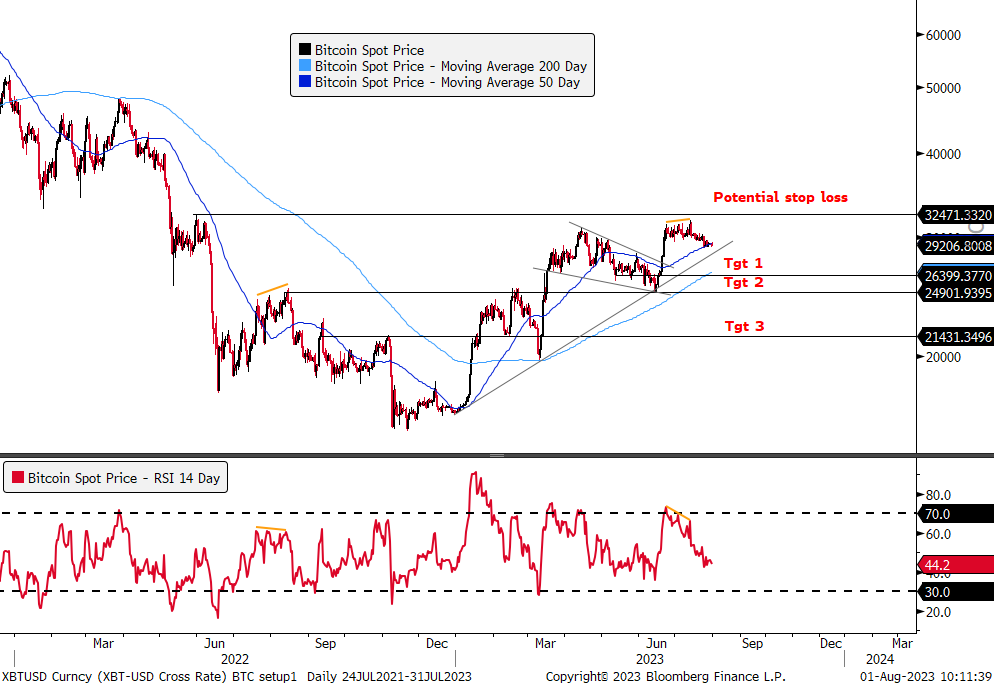
Short: Bitcoin
-Bitcoin hit higher high in middle of July while RSI made lower high compared to end of June levels, causing a bearish divergence.
-Price fell below 30,000, and is now testing the 50-DMA. A break below the trendline that exists from January will provide an objective sell signal.
-Targets 1 and 2 are tight given the bearish divergence is short at three weeks old, allowing for higher probability of targets being hit. Target 3 would need to see price re-enter a bear market.
-Despite all the bullish rhetoric surrounding potential ETF approvals, bitcoin has been unable to break decisively above 32,000, which is strong resistance.
-Potential stop loss is placed at horizontal resistance at the high from May 2022.
-Macro Catalyst: A countertrend rally in the DXY could pressure Bitcoin given its negative correlation to the dollar, in addition to an overall risk-off environment if economic data were to come in weaker-than-expected.
The instructional video does not seem accessible if we just have the Trader Membership. Is there another link or set of instructions that we do have access to?
Hi @amg0001 Apologies if it was not working for you. This link should be working, let us know if not. https://www.gameoftrades.net/updates/introducing-the-new-trader-membership/
thank you very much, @GOT
Its pretty hard to track these trades in these reports, could there be a summary of all swing trades somewhere?
Agreed, if this were setup under one Section like: “Swing Trades” then have columns for the ticker, the pending date, active date, status, link to chart, etc.
I agree totally, the website needs to be revised for clear swing trades that are active then next ones that are in setup mode. The pending is somewhat irrelevant and should be a separate post by itself. The way it is now, I may not renew as it is difficult to take it all in.
Was TLT stopped out with maximum loss?
Which Swing trades are active?
Was MRNA stopped out for maximum loss?
Is SPY activated?
Is CRM active?
Is XLY active?
What is active?
What has been stopped out?
[…] Long MRK (New) […]