Key Developments
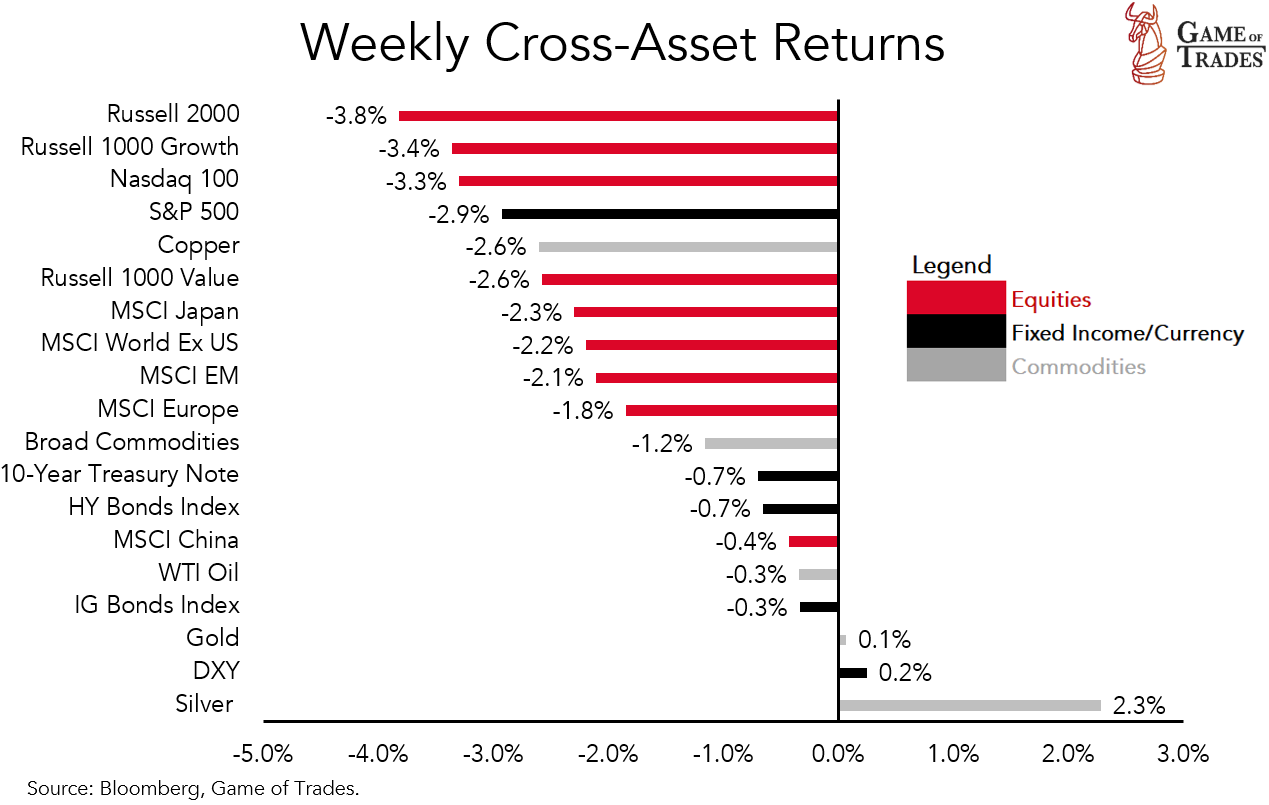
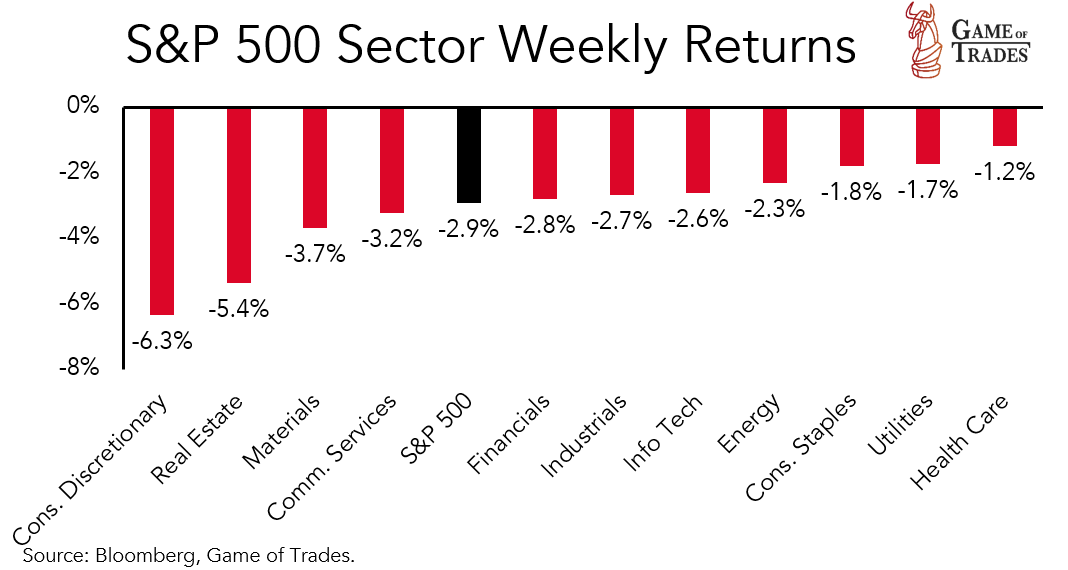
- The S&P 500 declined 2.9% last week, the worst weekly return since March of this year. All 11 sectors were lower. Health Care was the best relative performer, losing 1.2%, while Consumer Discretionary lagged, falling 6.4%.
- The September FOMC was interpreted as hawkish, as the Fed’s median projection for the Fed Funds rate in 2024 rose to 5.1%, up from 4.6% previously. This signifies continued restrictive policy into next year until inflation comes sustainably lower.
- Rates moved higher on the back of a hawkish Powell, with the 10-year yield hitting 4.51% by Friday, the highest since 2007.
- The VIX rose above 17, after hitting a more than 3-year low the week prior at 12.8.
- Housing data throughout the week will be the key data to monitor.
This Week’s Economic Data
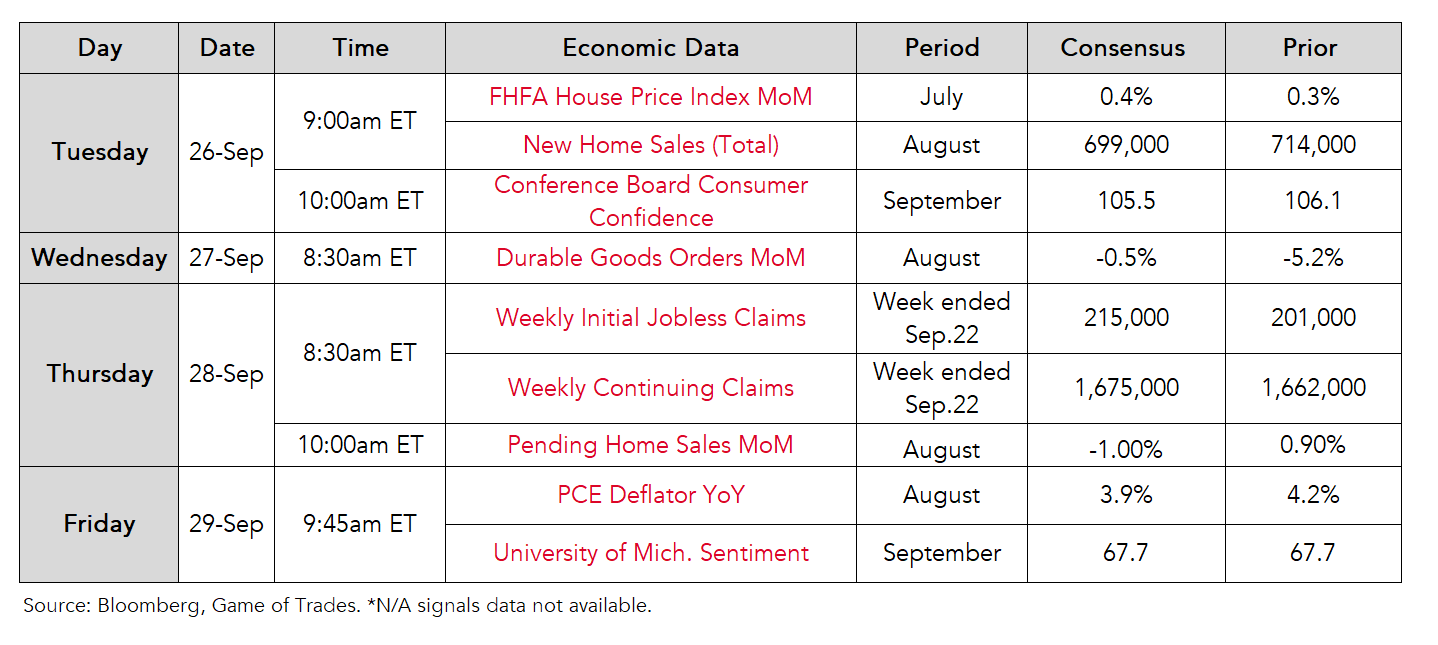
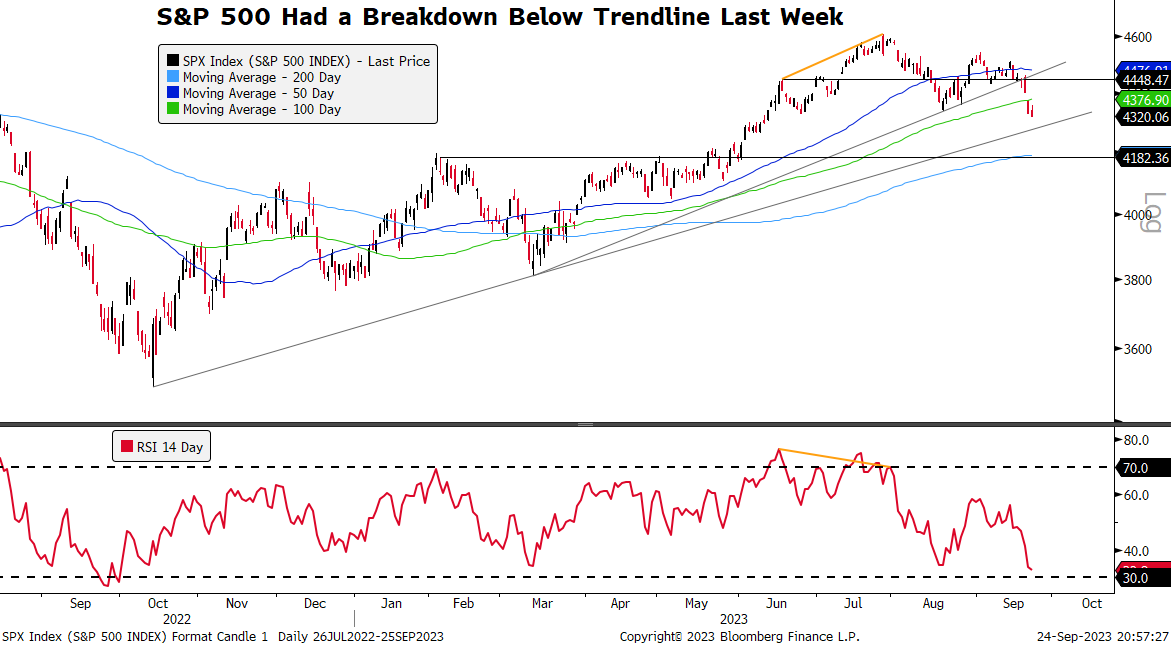
Chart of the Week
S&P 500 Break Below Key Trendline as Recent Weakness Continues
-The S&P 500 broke below 4,450 horizontal support, trendline support, as well as 100-DMA support, a clear negative technical development.
-The longer-term trendline could be tested next if downside were to continue in the near term.
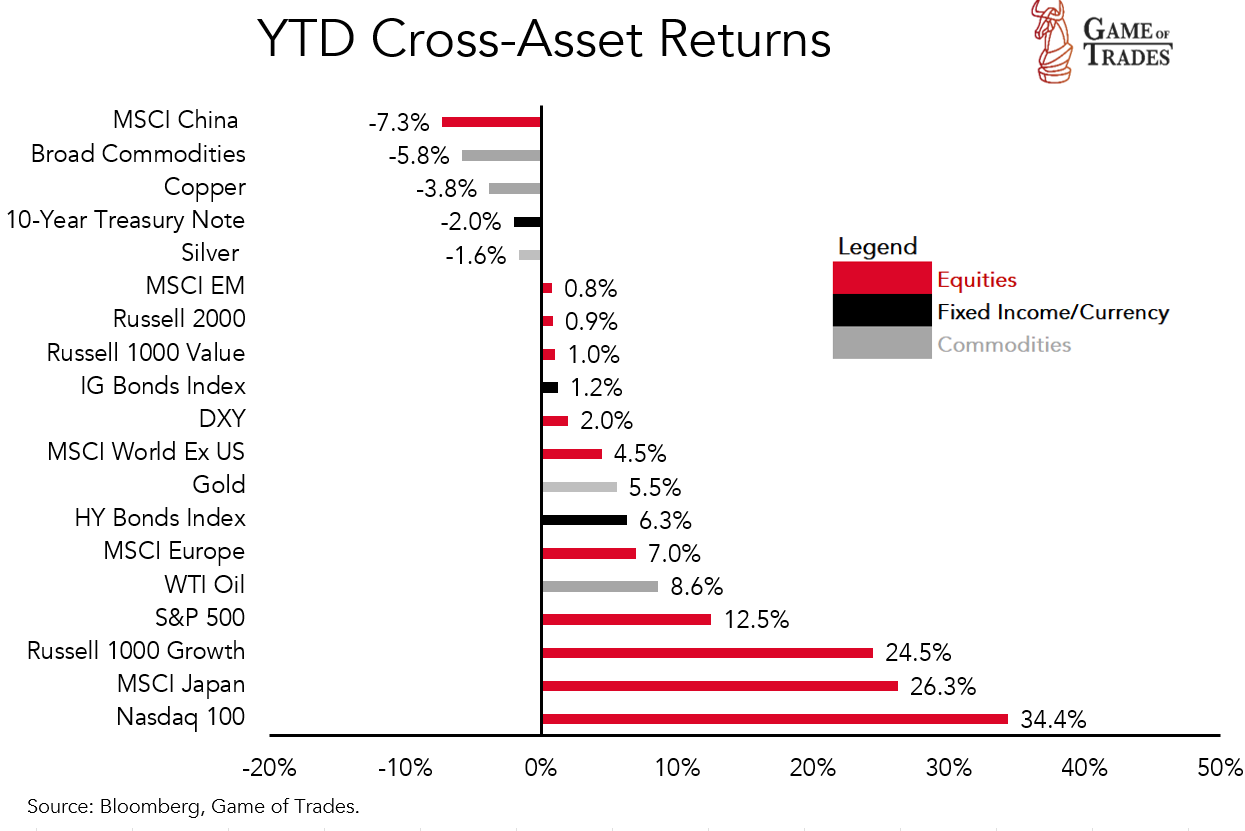
Global Cross-Asset Performance Summary
Weekly
Year to Date
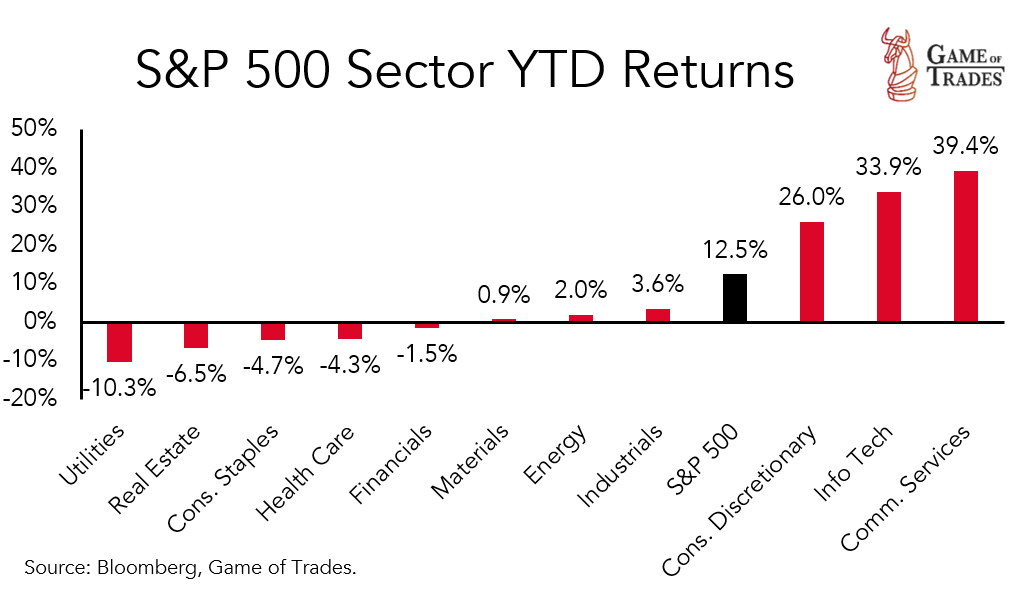
S&P 500 Sector Performance
Weekly
Year to Date
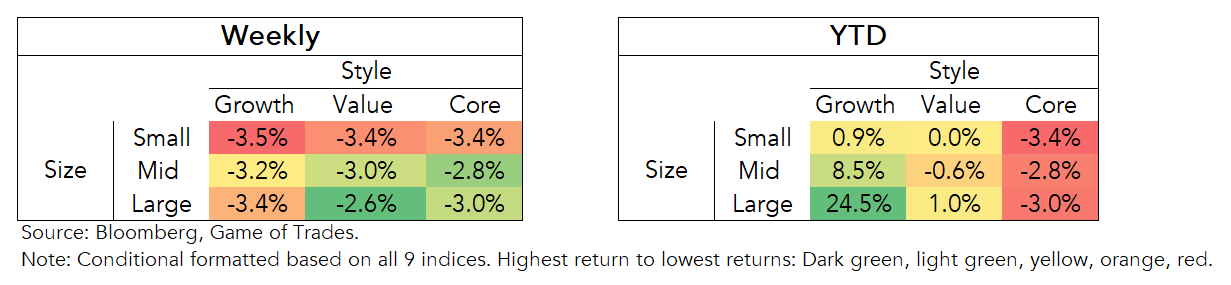
US Equity Market Style and Size Performance
is S&P 500 index not future quote?
Is the German market capitulating and ready for a melt up like TUR is experiencing?