Disinflation and Falling Rates Favor Growth Stocks Next Year
When to bet on value stocks versus growth stocks has been a topic of interest for investors over the decades.
Our portfolio currently favors growth sectors like technology (XLK) and consumer discretionary (XLY), bets on disinflation and falling rates.
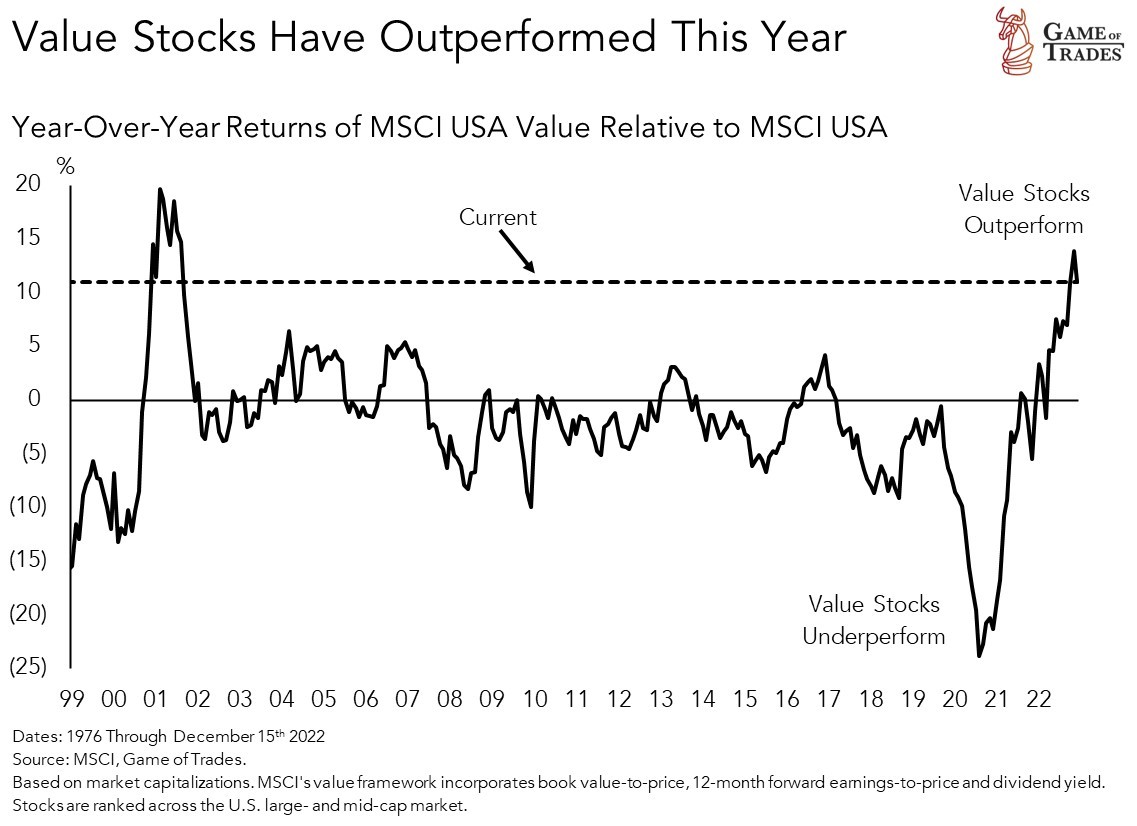
Value’s outperformance this year (i.e., MSCI USA Value relative to MSCI USA), shown below, represents a threat to our thesis.[1] But we believe that will reverse next year.
We believe that disinflation will lead rates lower next year, benefiting growth stocks. In the next few Macro Notes we’ll be providing evidence supporting our thesis.
In this first Macro Note we’ll look at what’s driven the secular performance of value and growth stocks. A lot of it has to do with the economic regime that’s prevailed in the last few decades.
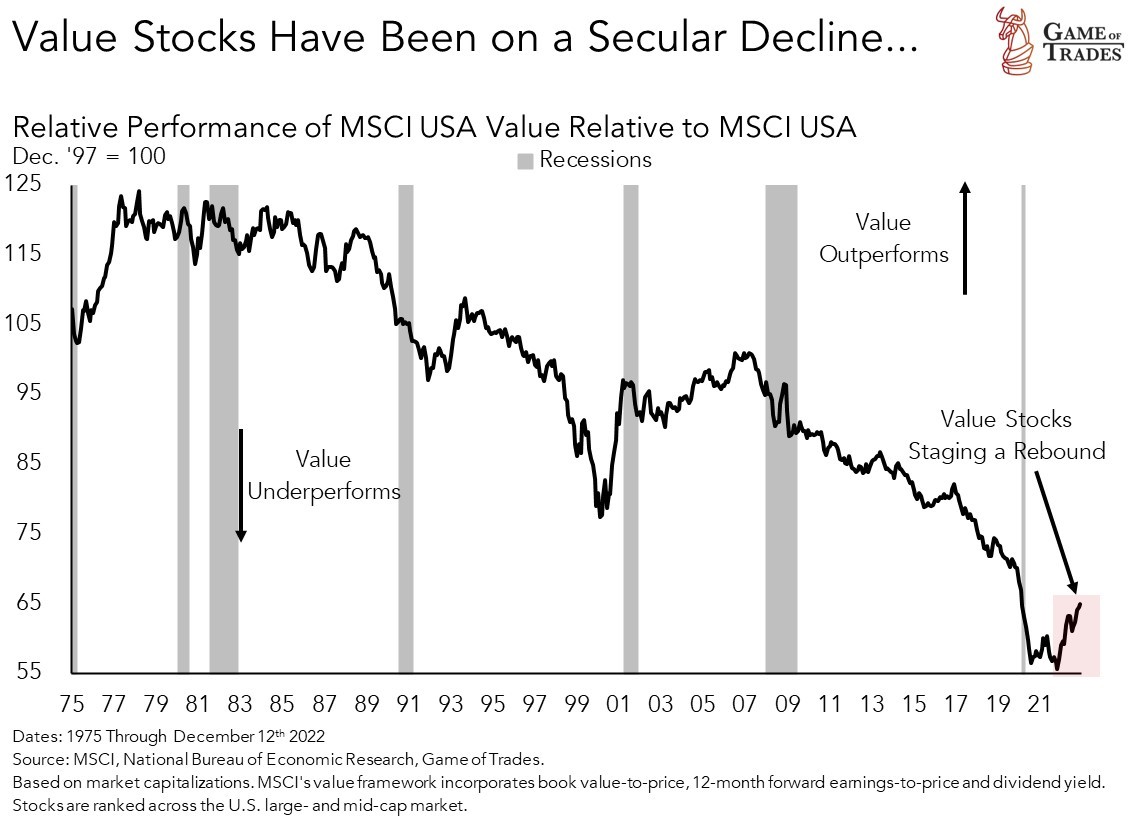
Value Stocks Have Been Secular Losers
Value stocks have underperformed for decades. However, value stocks have been staging a rebound this year.
The market has seen value stocks as less vulnerable to the big rise in interest rates this year resulting from record-high inflation.
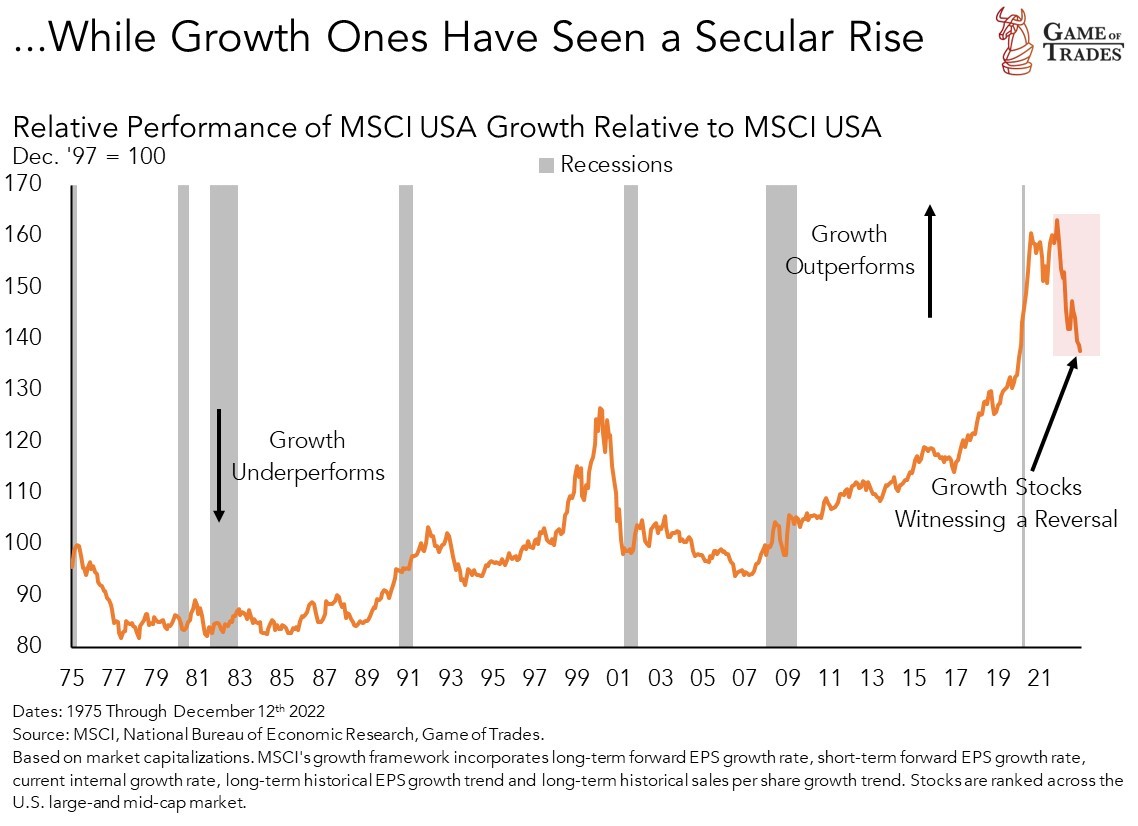
On the other hand, growth stocks (i.e., MSCI USA Growth) have outperformed over the last few decades, but have seen a reversal in their good fortune this year.[2]
Rising interest rates have proven a headwind for growth stocks, given their frothy valuations.[3]
Let’s now take a look at what’s driven value and growth stocks’ secular performance.
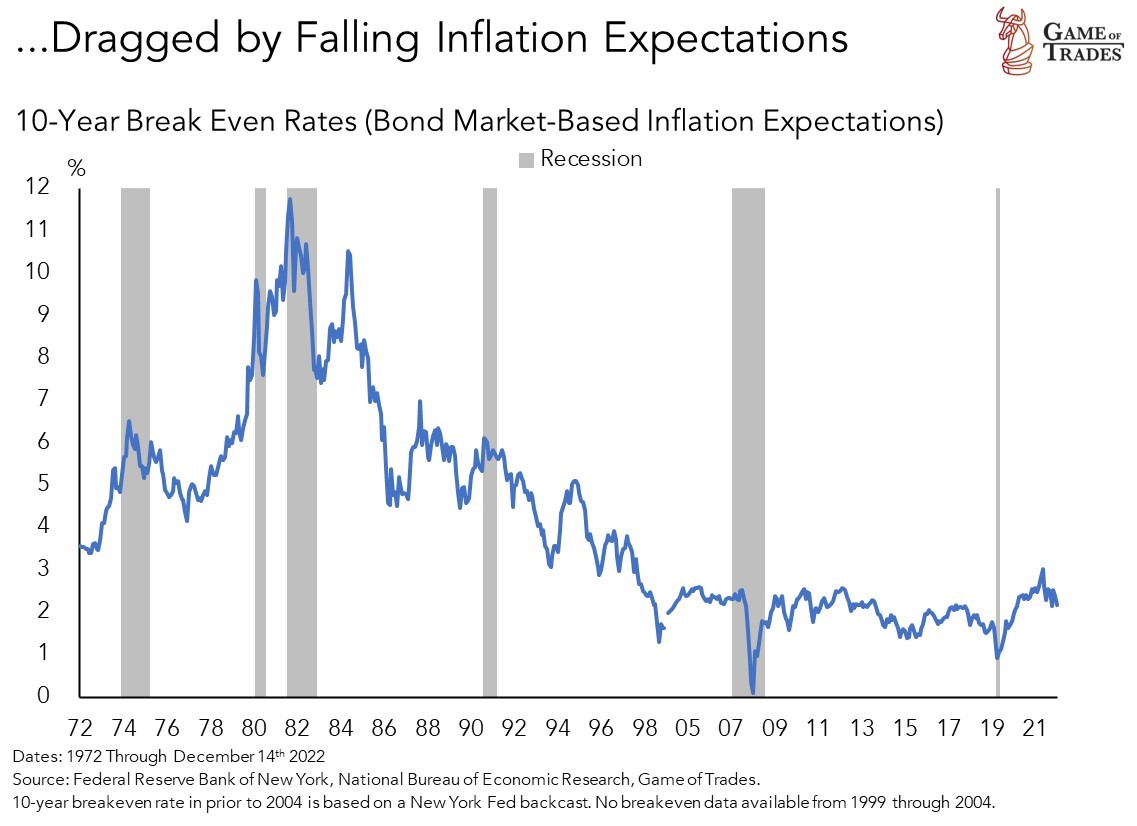
Falling Inflation and Rates Have Favored Growth Stocks
The secular performance of value and growth stocks has much to do with the economic environment.
Following the Great Inflation of the 1970s and early-1980s, investors sought out growth stocks because they delivered faster earnings growth than what could be found elsewhere.
Waning economic growth over the years was reflected in falling interest rates over time.
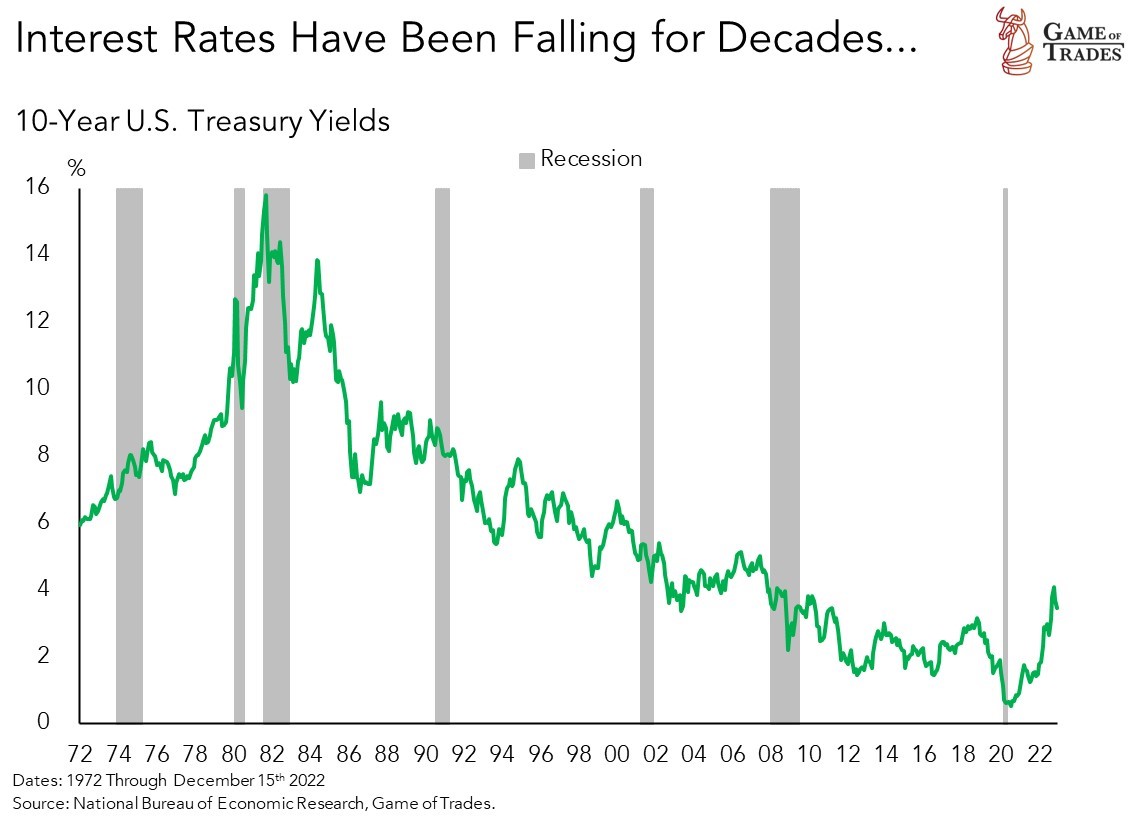
The fall in interest rates of the last few decades was driven by falling inflation expectations. A slowing economy leads to waning price pressures.
Nominal interest rates, like those of the 10-year Treasury bond, incorporate expected inflation in their pricing.
Growth Stocks are the Real Story Here
As the economy slowed over the decades, it became more difficult to find profit growth. That’s where growth stocks came in with an attractive proposition.
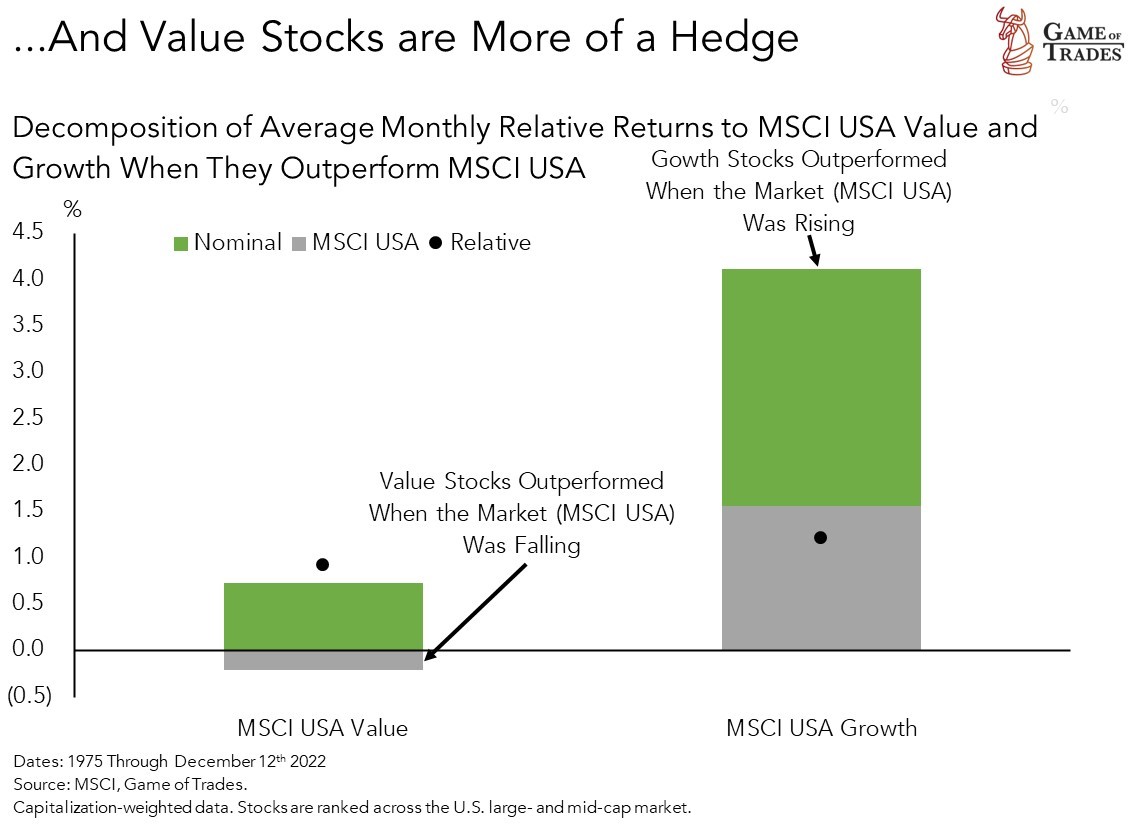
Growth stocks generate high nominal returns (i.e., absolute returns) when they outperform the market, as shown below.
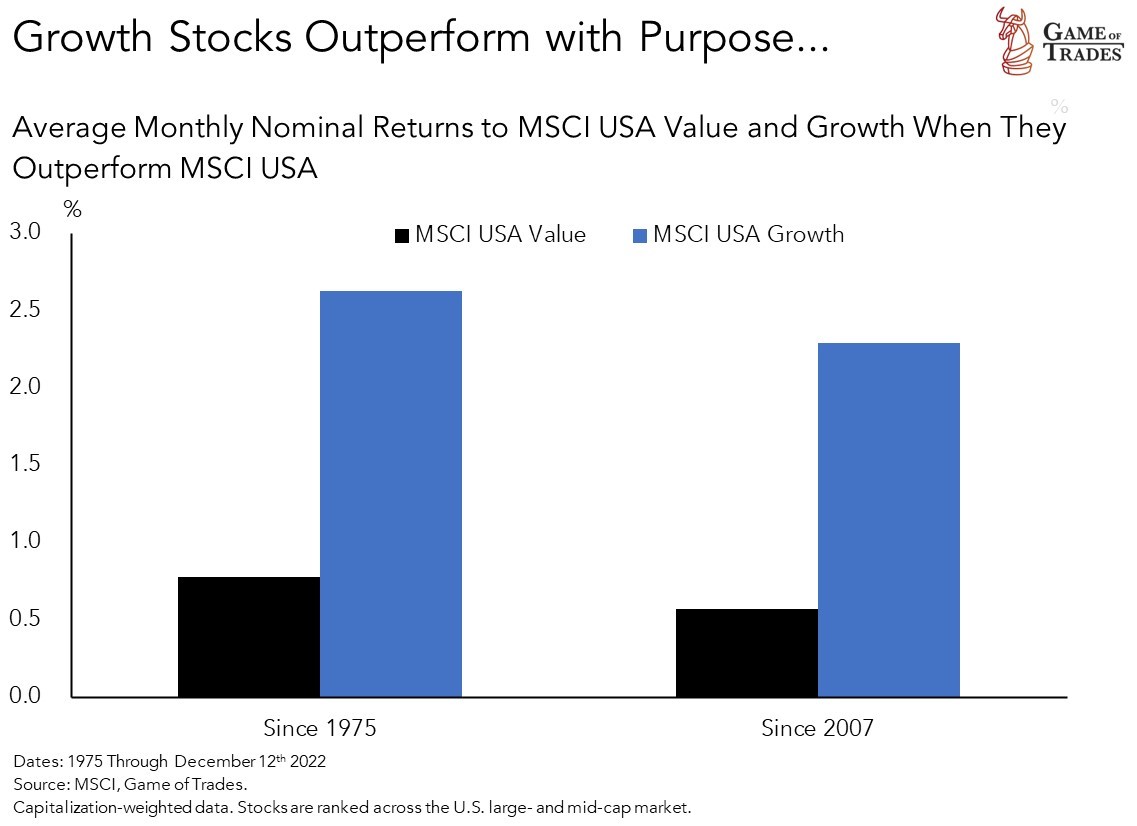
At some point, however, investors get overly optimistic about growth stocks, driving valuations to extremes. That’s when value stocks come in.
On average, value stocks outperform when the market is falling. They’ve acted as a hedge as their low valuations make them less vulnerable to the worries that make growth stocks falter.
Growth stocks generally trade at premium valuations, given their growth advantage.
Early next week we’ll follow-up with a Macro Note on how we define value and growth, and why that’s important.
We found that the performance of value stocks depends on how it’s defined. We’ll also take a look at what sectors screen as value and growth today.
Footnotes
[1] Here we’re using the MSCI USA Value Index, which captures a cohort of U.S. stocks with low valuations as measured by a composite of various valuation metrics like book value-to-price, 12-month earnings-to-price and dividend yield. The composite valuation metric is ranked across the U.S. large- and mid-cap market.
[2] Here we’re using the MSCI USA Growth Index, which captures a cohort of U.S. stocks with growth characteristics as measured by a composite of various growth metrics like long-term forward earnings-per-share growth rates, short-term forward earnings-per-share growth rates, current internal growth rates, long-term historical earnings-per-share growth trends and long-term historical sales per share growth trend. The composite growth metric is ranked across the U.S. large- and mid-cap market.
[3] Highly-valued stocks are vulnerable to rising interest rates because their free cash flows go out further into the future than for the average stock (i.e., high duration). Discounting these higher-duration free cash flows at higher interest rates reduces their present value to a greater extent than for the average stock.
On a side note, we’re trying the Macro Notes as shorter and more frequent updates of our strategic research. In the comments below, let us know if you find them a good addition to the service!
If you look at current short dated treasury rates, there is only a slight discrepancy between FED projections and market projections. The highest rate is the 6 month around 4.7%. The second highest is the 1 year at about 4.6%. Rates longer than the 1 year decline with the 10 year at under 3.5% and the 20 year at 3.7%. So if you read what these rates are saying, the market expects a peak rate of about 4.7% six months from now = less than the FED 5.1%. IMO, the market is really not pricing in a FED pivot in 2023 as the one year rate of 4.6% is only slightly below the six month rate around 4.7% so the market is pricing in a very low possibility of a .25 cut from the highest rate. So how is the market diverging from the FED if you read the rates? The market thinks the FED will not be able to raise rates to 5% or need to. Maybe two small .25 increases next year. The market is anticipating the FED will hold rates for the next year as the one year is very close to the six month rate, but from a lower terminal rate. Those claiming there is a huge divergence between what the FED has outlined and what the market is predicting are wrong imo. Other than a lower terminal rate = 5% vs 4.7%, the market and the FED are pretty much in lockstep. Neither is predicting a pivot imo in 2023.
It would seem loading up on 6month or 12 month bills via Treasury Direct might be a good way to get a return in 2023. My mirror model portfolio is looking wrecked, alot of red ink. Need to see some return in 2023 since 2022 didnt fare so well.
Steve,
Yeah I have some $ in 6 month treasuries. And 3 months too.
My gut is we will be able to buy the one year at a higher yield as the current data suggests the FED will in fact raise rates toward 5% rather than just 4.7% but of course that’s just a guesstimate.
With all the uncertainty, 4.5% isn’t a bad return with inflation expected to decline while things sort themselves out.
Of course the market could rally to 4800 and it would be better to be fully invested, but my gut says there will be lower price to get in.
The Oracle, wow thank you! What you just shared makes perfect sense – there really isn\’t a HUGE disconnect from the markets and the FED, at least insofar as terminal rates. Absolutely correct and I\’ve been wrong in viewing the gap to be so dauntingly large. Get some cool CPI\’s and some 25 bps rate hikes and I see that scenario you laid out well. There *was* the discrepancy between WHEN the fed will begin cutting rates but I now see the market has a rate hike pauses in it\’s place with 2 .25 bps rate hikes next year priced in.* Edited to indicate I\’m caught up to speed here! Markets pricing in FED come to the rescue. I\’m still hung up on this Philadelphia jobs revision report released December 13th, 2022 (this Tuesday). I\’m repeating myself a lot here but I\’m itching for some folks to chime in here. Instead of 1.1 MILLION net new jobs created in Quarter 2 this year, they found there was only 10.5 THOUSAND net new jobs created in that time. Thus taking away the burning question I\’ve had about which survey is more accurate (The Housing survey or The Establishment survey). The Philly fed just corroborated that, at least for quarter 2, the housing survey was the accurate survey. 1.1 Mil is a very different number than 10.5 K. ESPECIALLY considering the context of a fed desiring the destruction of demand (thru raising rates and unemployment). The data dependent FED here is apparently using exponentially incorrect data. So….they\’ve already overdone things is my takeaway.
Editing doesn’t seem to work here for me haha. I now see the market is pricing in 2 25 bps rate hikes and indeed a pause in hikes and a hold of rate rather than cuts next year.
Yeah, I need more information on why the Philly Fed has such a huge different labor number. It is definitely something to do more research about and thanks for bringing it to our attention.
Truly my pleasure. I’m here to learn and soak in as much as possible! You can look into it more via the Philadelphia Feds page or Google “Philadelphia early benchmark revisions or state payroll employment.”
Considering it came out on Tuesday Dec 13 2022, we didn’t hear any mention of it at fomc. So idk. For now I’m just considering it noise, but I’m keeping an eye on it.
You really helped me understand the current markets pricing of fed policy today. Very grateful!
Also, The Oracle, I’m starting to find articles pop up (so far from more of the fringe media outlets) concerning this jobs reporting discrepancy. In fact, an article dated Dec 3, 2022 from ZeroHedge (never heard of until now) dives right into this a full 10 days before the Philly Fed dropped their revision.
Article is titled “Something is Rigged: Unexplained, Record 2.7 Million Jobs Gap Emerges in Broken Payrolls Report.” by Tyler Durden.
Idk… this is wild. When people ask my the WHY of bitcoin this is something I’d show them.
If we look at the Dec. ’23 Fed Funds futures contract today, it’s pricing in a Fed Funds rate of 4.5% for year-end ’23. The Fed’s estimates released this week show a Fed Funds rate of 5.1% for year-end ’23. Hence, the differential between the STIR futures market and the Fed is around 60 basis points. It’s not a massive differential relative to the ramp-up in rates that began earlier this year but does signal a divergence.
The future contract has to price in the probabilities of more significant recession. The FED otoh is assuming a mild recession when it creates its projection. That is really the difference, and as I have pointed out, something more than a mild recession might lead to a FED pivot but it is not good news for the economy or stocks in the short term. I would not call this a significant divergence. The FED is projecting on current data, the future contracts are incorporating some future possibilities (more severe recession requiring a pivot) currently not in the present data. Think of it as a present value vs future value thing.
Makes sense – if the ten year is the driver for market valuations we have a big rally coming. This if yields reach the GOT target of 3% while earnings meet analysts forecasts. The fed does need to pause for that to happen. A fed rate hike of .25 in January would be confirmation of that. While a 50 bp move would not. Do you agree?
A side note – I see conflicting stories – If 90% of recessions are proceeded by a spike in oil prices / why are you short oil? A spike is likely in the growth case for stocks. Would it not be far better to use dxy or uup as the hedge? At least until we have an energy price spike (again). Then pivot back to oil short? Oil short could lose you 50% or more in a price spike – while a declining dollar 10-12% – from the elevated spike in energy prices you would then be in a much better position to profit as well.
I am not sure you can have both a growth stock story and an energy price collapse in todays supply constrained world.
Dana, great questions! So GoT posted in a prior post (a week or two ago?) that while they do see oil continuing to fall into next year the risk reward at this point isn’t nearly as desirable as when short oil was first added to their portfolio. Essentially capturing a lot of the big move down we’ve had in the past months on oil. So while it’s still in the portfolio GoT has trimmed the position down. Personally I exited my short oil trade entirely last week.
Back to the spike in oil before recession – the yield curve has already inverted signaling a recession to come and we had our SPIKE in oil this summer, preceding the recession the yield curve suggests is coming. Hope this was helpful!
As of December 9, 2022, the S&P500 P/E ratio is 41% higher than its modern era average and is Overvalued. To fall back to the modern era average, the S&P500 would need to return to around $2,700.
Looking forward to your Macro Notes and profitable sector choices for Value and Growth as we end 2022.
Hi Andrea, indeed since the 1960’s the average P/E of the SP500 has been 17.87 and our current P/E is ~19.99. This argument has been used by many to justify further retracement in the market. I believe the 41% level you’re referring to is the current trailing 10 year P/E ratio of ~28. I think there’s probable cause for the trailing 10 year P/E to continue working its way down over the next few years and 2700 spx isn’t a wild price target to look to in the future. The current forward P/E is ~19.30. What happens between now and then no idea!
Peter,
Since this article is about growth vs value. The ARK ETFS are the most affected this year and down 65% this year. Can you give your opinion on this ETF. I am sort of stuck as a bag holder. Contemplating to cut the loss and rotate into other growth etfs (less volatile), or is there hope for Cathie Wood. Your opinion is greatly appreciated.
SIG
I wouldn’t mind hearing GoT’s take on Arkk too. I would presume that Arkk will run when the environment favors risk-on. We’ve been in and remain in a very risk-off environment. Also Arkk holds disruptive and deflationary companies – that’s their investment theme. Considering we’re in an inflationary environment I assume this doesn’t bode well for Arkk for now until our inflation story cools off and we enter a risk-on environment.
Personally I would get rid of ARKK, I feel that growth companies could rebound next year but you want to be in the so called GARP (growth at a reasonable price) names. Many of the companies in ARKK are unprofitable growth companies with very little cash flow. Stick with growth companies that actually have cash flow and low PE. Many of the companies in ARKK have negative PEs and aren’t expected to turn a profit for many years. If interest rates stay this high they will burn through their cash before they become profitable.
Should we be holding any inverse index ETFs as a hedge? Art Cashin on Thursday said if we failed to recapture 3900 last week his technical indicators say it opens up the possibility of a market crash Monday or Tuesday. I usually ignore what most talking heads on TV say but he’s made some pretty prescient calls in the past. https://twitter.com/squawkstreet/status/1603476516830121984?s=46&t=lz0Or8WAHW9te-1Mo-3JYA
Thanks. Loving the content at the minute. Clear, actionable, timely without being over focused on the day-to-day.
Especially liked ‘what would it take to turn bearish’. A lot rides on earnings holding up. China is moving on from zero Covid. So the main risk is a big shock earlier than expected. Important to have any underlying shifts highlighted, so we can derisk earlier.
[…] in mid-December we mentioned that the down beaten growth sectors would stage a comeback in […]