Request by @dob
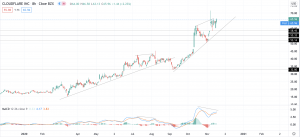
Here is a chart analysis of NET. Despite having limited data to look at past price action on NET, we’ve noticed a technical development worth noting. Bearish momentum divergence is currently building on the 8h chart between the price and the MACD. The previous bearish divergence led to a 24% drop in price from the second high.
However these kinds of divergence can continue extending higher, traders need to wait for an objective sell signal before entering a trade. We’ve highlighted a wedge pattern on the chart, a break below the up trend line would trigger an objective sell signal. We’ve highlighted support levels where price could fall in the event of a break of trend.