Chart request by @applebanana
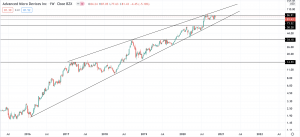
We covered AMD a while back on the site, we’ve added the chart which was posted on October 12th.
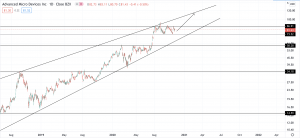
We highlighted a trading range on AMD with significant resistance at 86.9. Right now the intermediate term picture on AMD remains the same. We have a long term price contraction line (wedge pattern) which was recently tested on the 5th of August. Typically a test of the price contraction line triggers a fall back to the up trend line (price bounces back and fourth between these levels) our preferred scenario on AMD is a sideways consolidation in the current trading range to eventually test the up trend line.
However, a break out and above the 86.9$ resistance level could be an objective buy entry with a stop loss just below. A test of the 73.5$ support level could also provide an objective buy entry on AMD with a stop loss just below.