Summary:
- Consumer sentiment is at all-time lows and stagflation fears abound. But in nearly 70 years of data the equity market has generally done well when consumer pessimism has been this bad.
- We assessed the health of the consumer and believe there is a good chance they’ll ride out the inflation storm. While goods spending has fallen quickly, jobless claims haven’t jumped, a rarity if we look at the history.
- Consumer cyclical stocks have fared the worst since the yield curve peaked over a year ago. We sought out to find whether they now represent an opportunity given our view that inflation is close to peaking.
- To do that we ran an event study to identify who have been the winners and losers across the equity market in five episodes when the inflation rate fell from high levels going back to 80 years or so. Consumer cyclical stocks were well-represented in the winning cohort.
- Combining the findings from the event study with today’s sector valuations, we conclude that the transportation and retailing stocks express our best bets on the coming disinflation. This is a strategic view that we expect to play out over the next six to 12 months.
Survey Says: Consumers are Dour
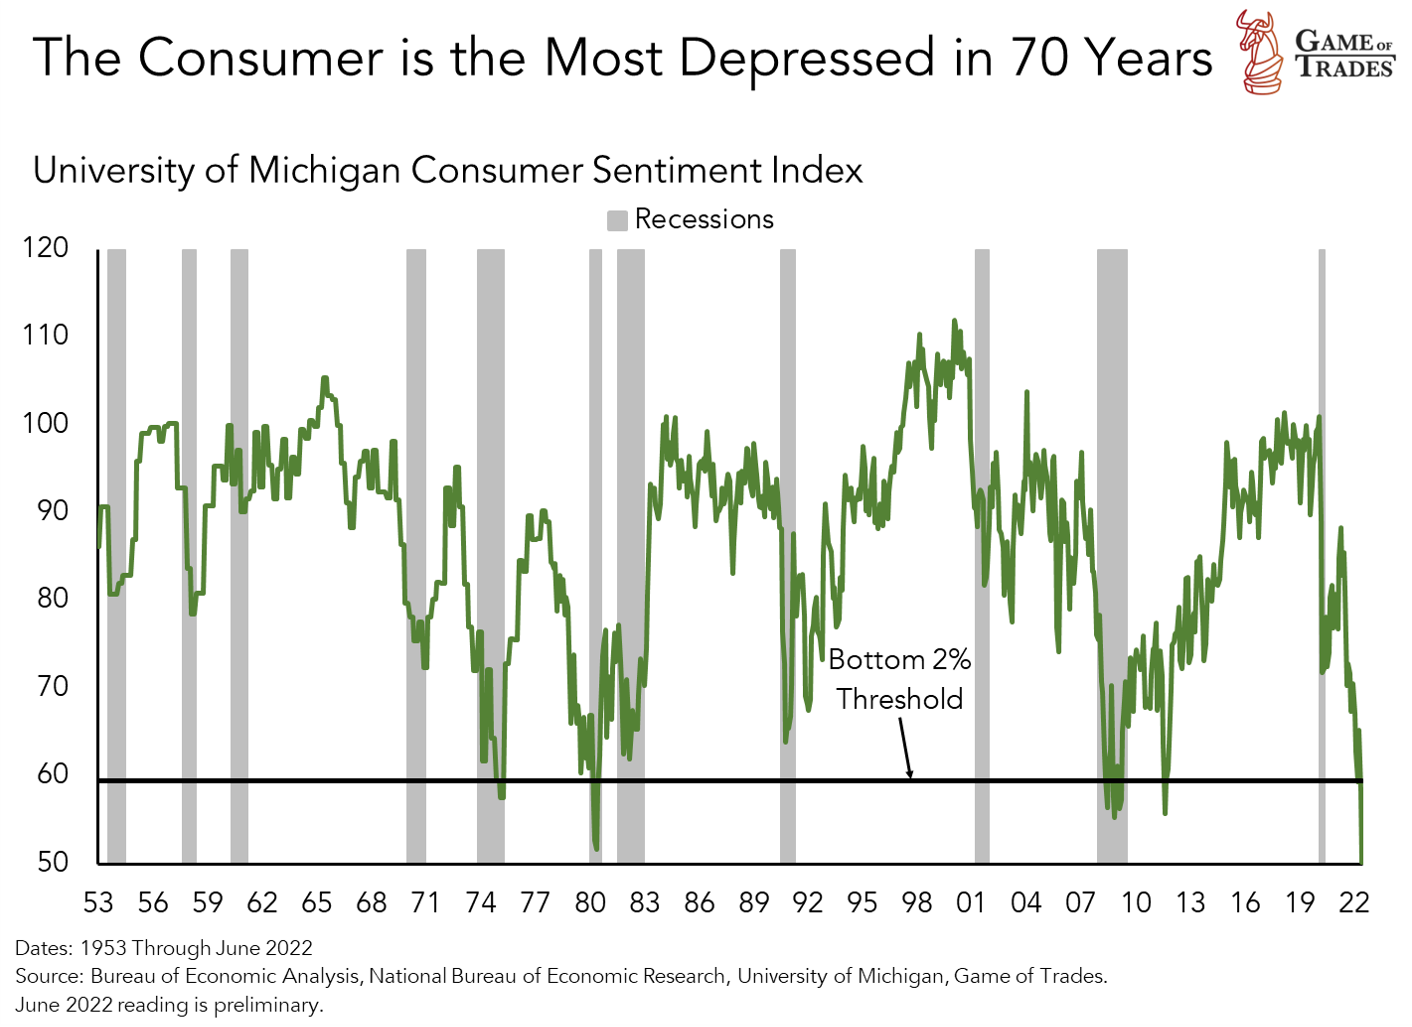
Consumer sentiment, as captured by the University of Michigan preliminary reading for June, printed its worst number since 1953, as shown in the chart below. Readings this low haven’t been too frequent in the last 70 years, but have almost invariably been associated with recessions. The reading in 2011 proved an exception, when concerns related to the debt ceiling crisis quickly dissipated.
The worry of today is that the consumer will succumb under the weight of stagflation as was the case in the 1970’s and ‘80s, when the aforementioned sentiment indicator was also on the floor.
In this research we take a look at the health of the U.S. consumer. We think they have a good chance of riding out the inflation storm. We’ll also touch upon the consumer cyclical stocks, that have been underperforming after the yield curve peaked over a year ago. That group comprises retailing, automobiles & components, hotels, restaurants and entertainment. We’ve also lumped the transportation stocks into the group (i.e., logistics, rails and airlines) given the impact consumers have had in the pandemic-induced goods spending boom and their shunning of travel amidst Covid variants. We find that some of these look like attractive opportunities to express our views on disinflation.
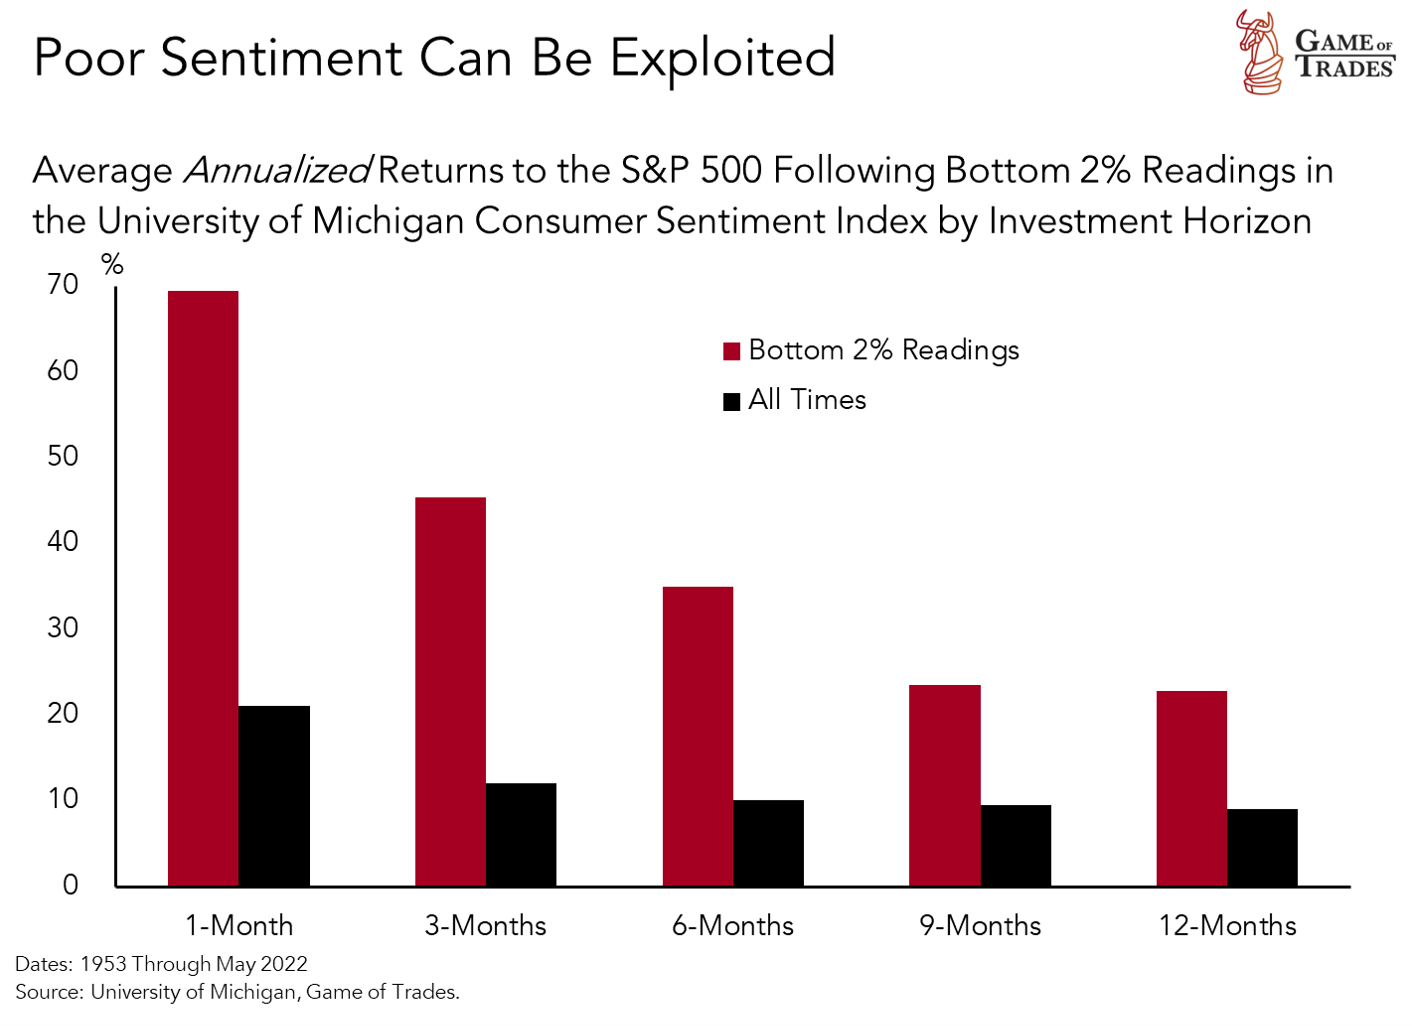
Given the horrible consumer sentiment number reported on Friday, we started out this note by looking at whether that level of pessimism told us anything about what lies ahead for stocks. We found it actually did an excellent job of anticipating very favorable moves in the S&P 500 over the next 12 months, as depicted in the chart below.
Moreover, those gains tended to be front-loaded, as the annualized returns shown are much larger in the first one-to-three months horizons. That’s why assessing the risk-reward setup is critical, because it can help us rationalize being a bit early. As we’ve been documenting in our work, we think the today’s setup is attractive for stocks.
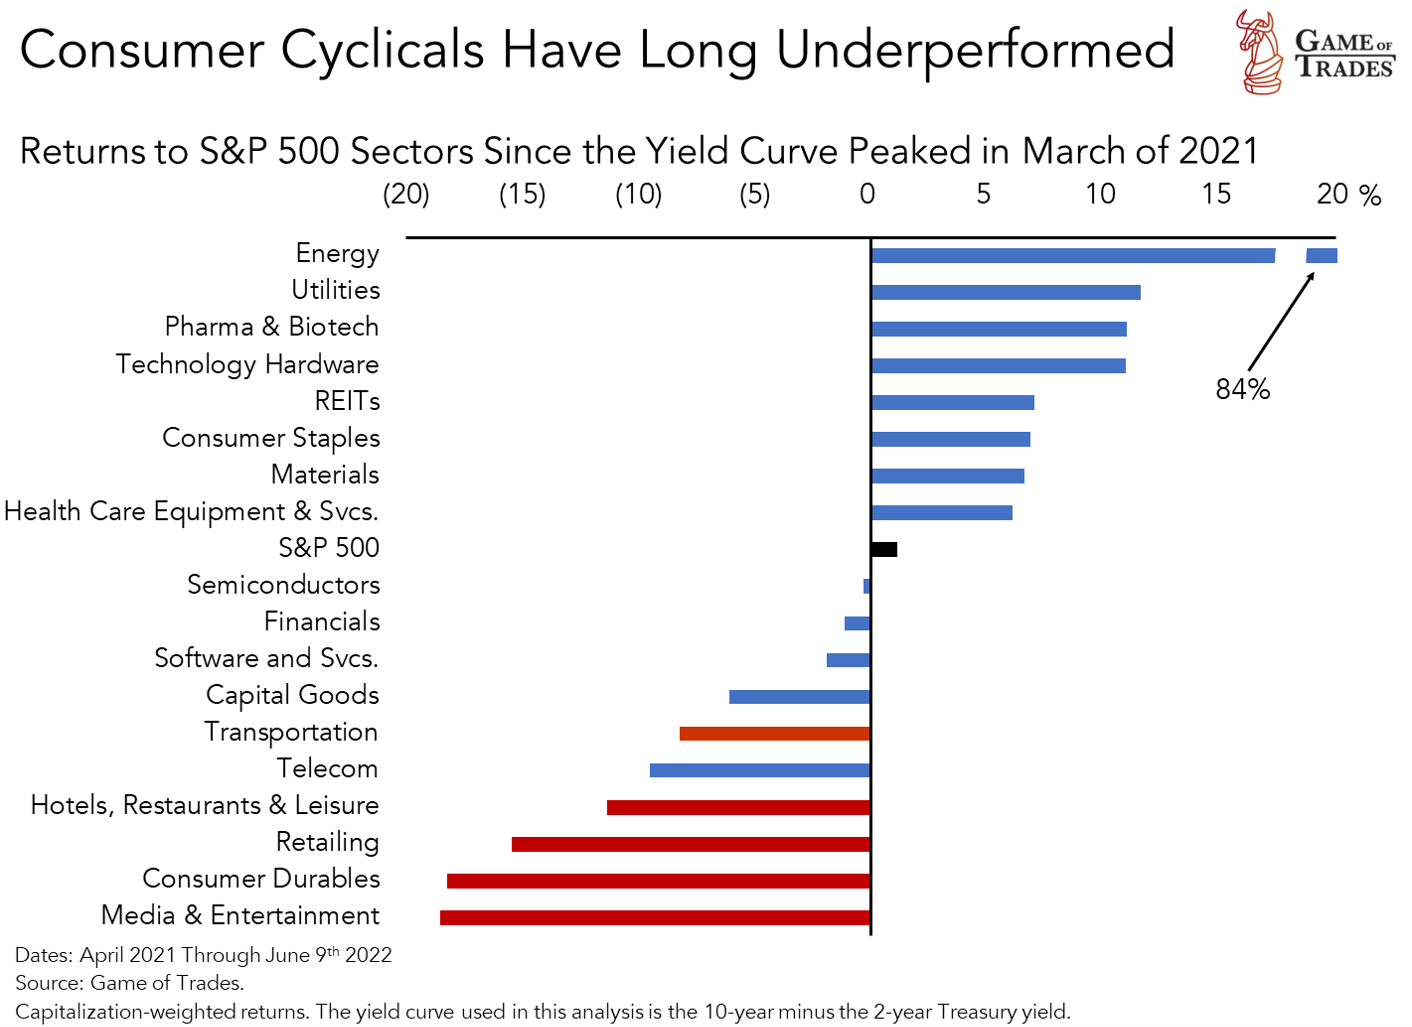
The pessimism is evident in the performance of consumer cyclical stocks following the peak in the yield curve in March of last year, as investors began discounting the fiscal drag associated with the removal of pandemic stimulus. The consumer cyclical stocks have fared the worst across the S&P 500 sectors since then.
The Consumer is Riding Out the (Inflation) Storm
We went through various indicators to assess the health of the consumer, and we’ll discuss them shortly. The bottom-line is that we didn’t find convincing evidence that their behavior is indicative that a recession is imminent. At least not yet.
One concern of late has been the fall in goods spending on an inflation-adjusted basis as documented in the chart below. Since the end of the Second World War, that’s almost always triggered recessions, with 1951 the only exception.
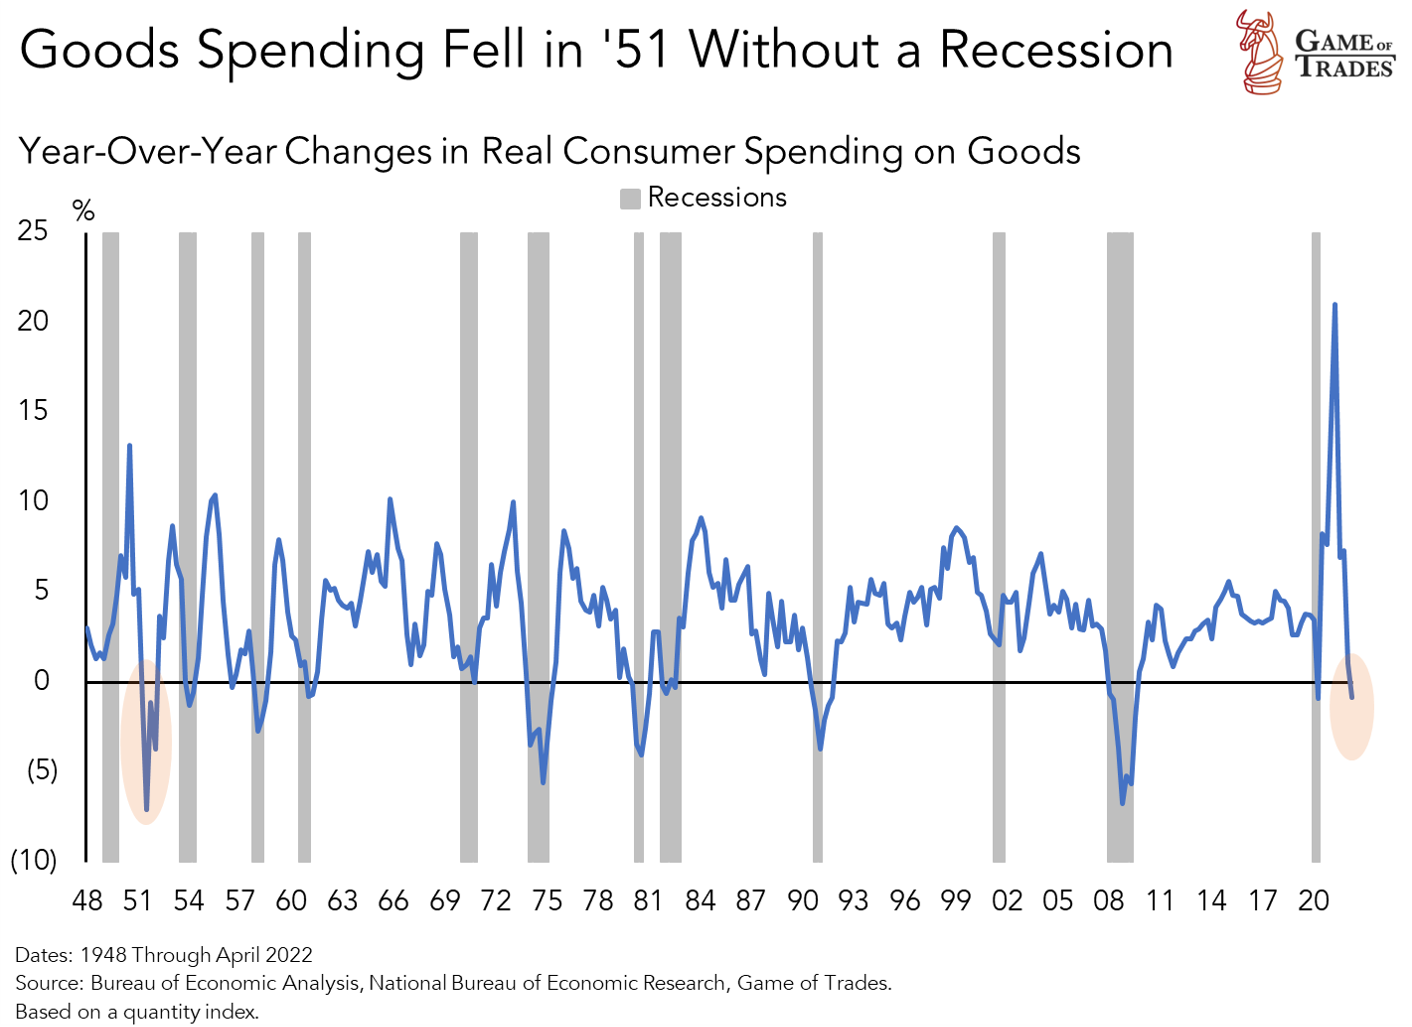
Pent-up demand for goods exploded in 1945 and 1946 following years of war-related austerity. As that demand was satiated it then fell precipitously, but it was more than countered by massive government spending attributed to the Korean War effort. Today, it’s the rebound in services spending that’s saved the day.
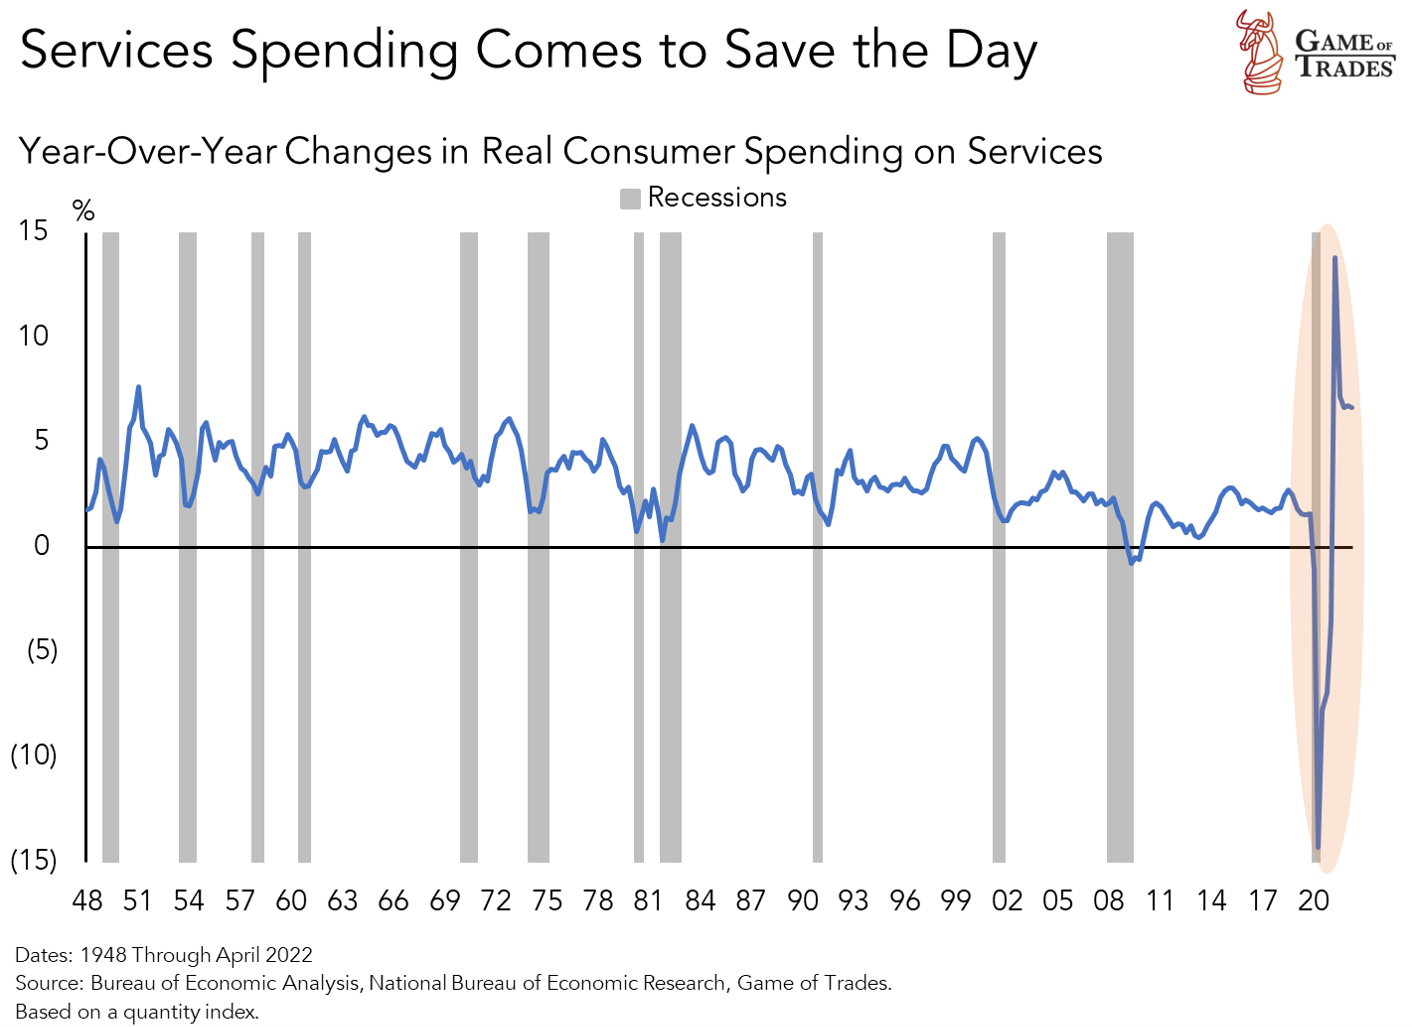
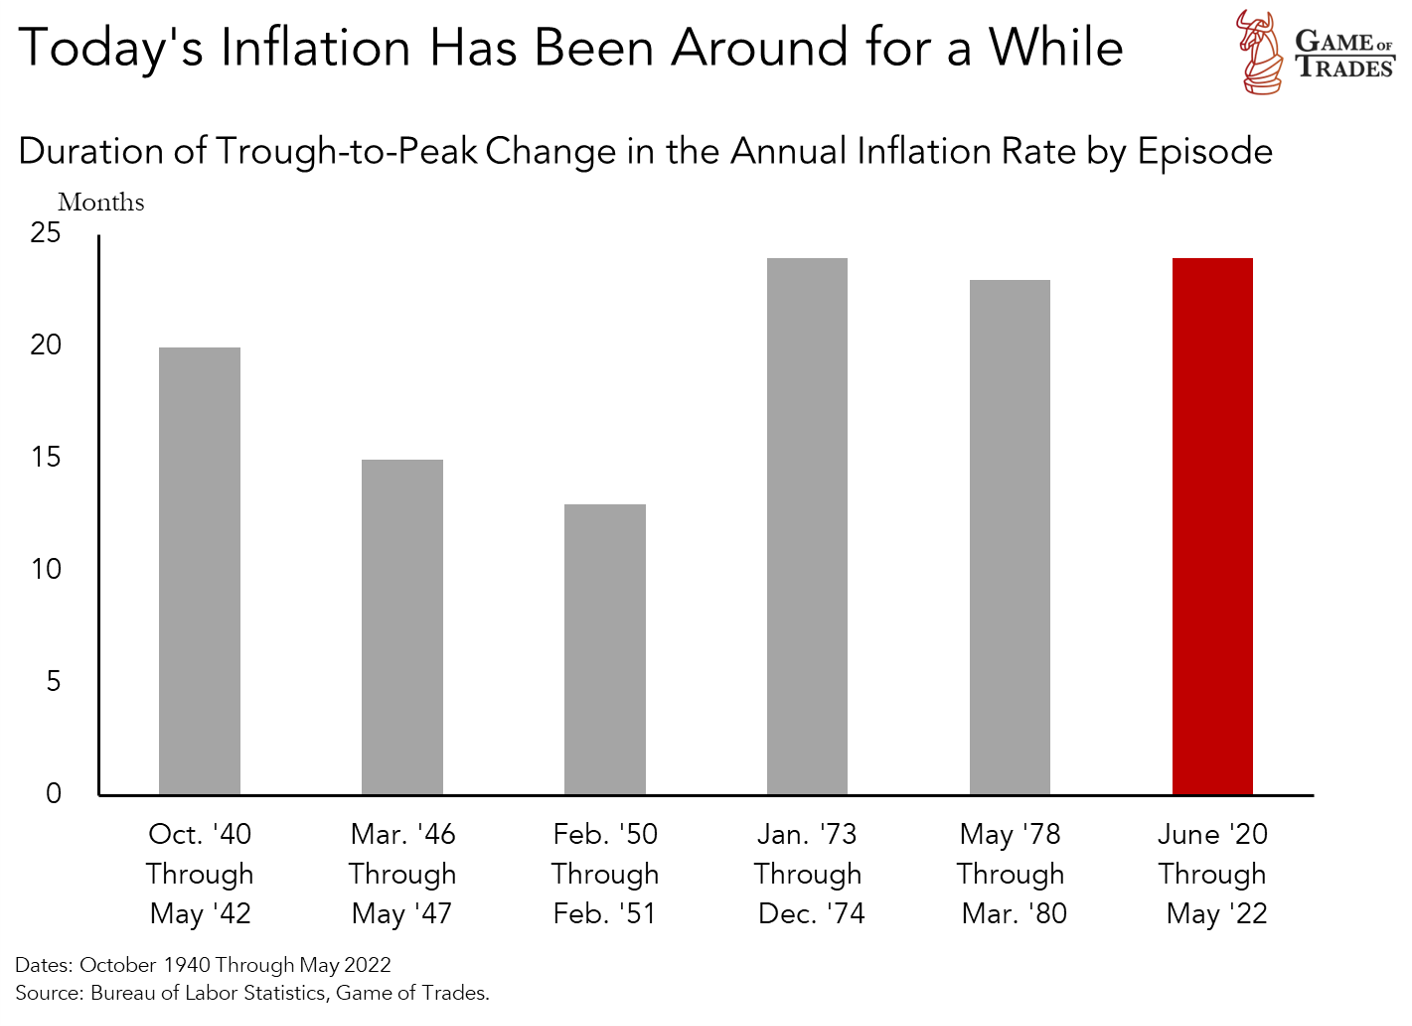
That can buy the consumer time to ride out the inflation storm while the supply and demand imbalances in the economy work their way through. What’s certain is that the rising inflation of today has overstayed its welcome, and at two years its longevity has matched that of prior inflation shocks.
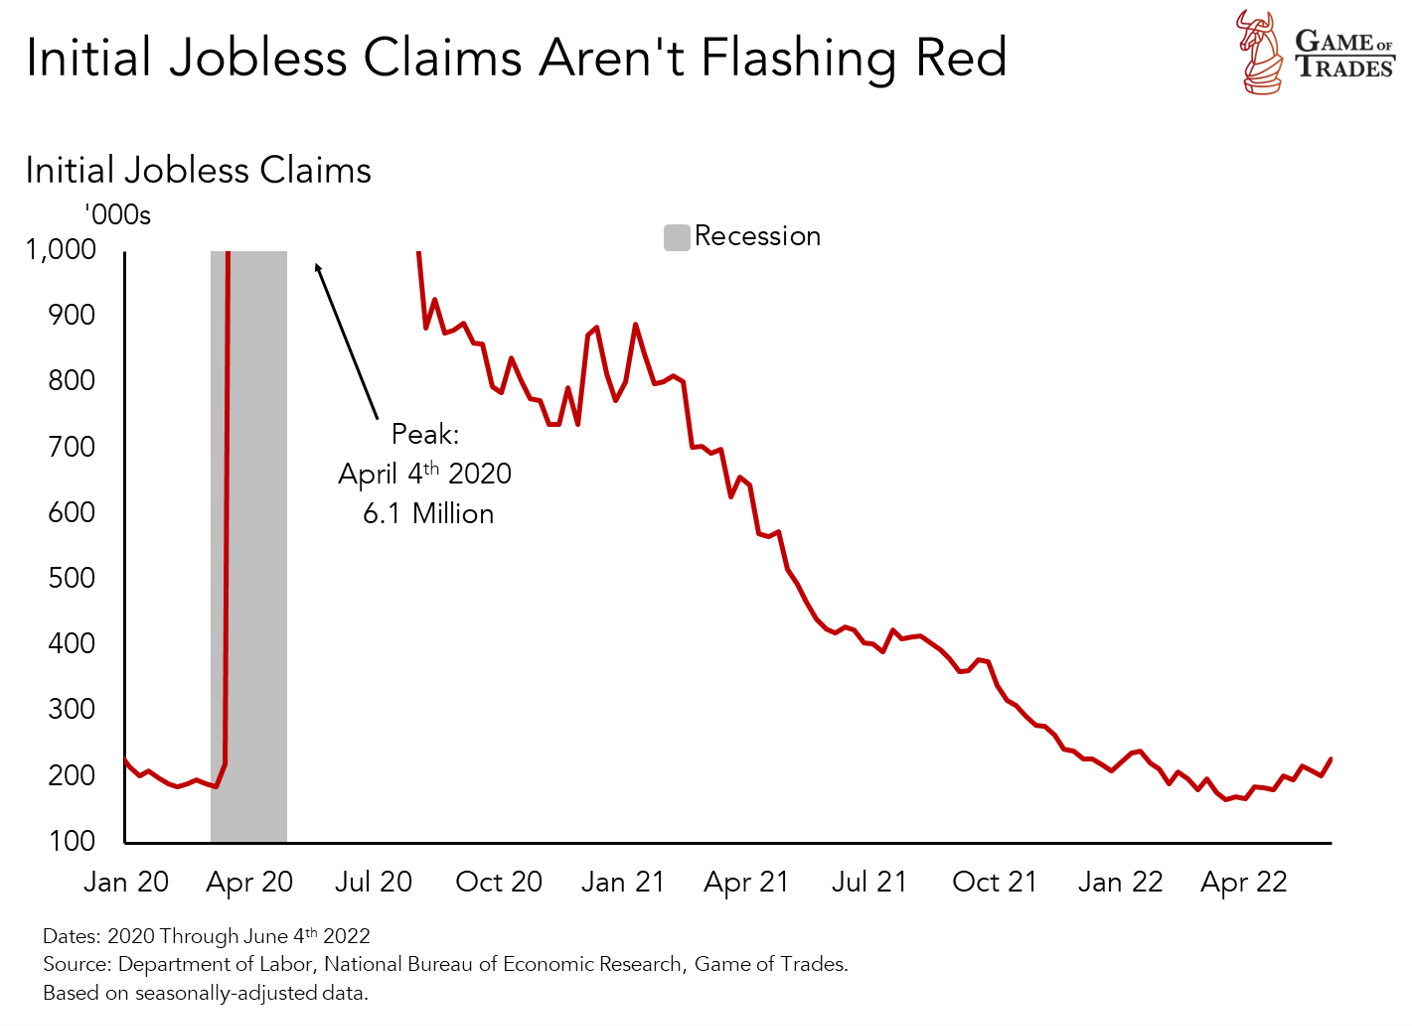
Moreover, the labor market remains very strong. While goods spending has fallen considerably over the last year, it’s not yet been associated with a jump in initial jobless claims. That’s a rarity if we look at the history in the chart below. The decline in goods spending of late falls within range of those seen in the Financial Crisis, the deep recession of 1991 and the stagflation episodes of the 1970s and early-1980s that by this stage had already witnessed big jumps in jobless claims.
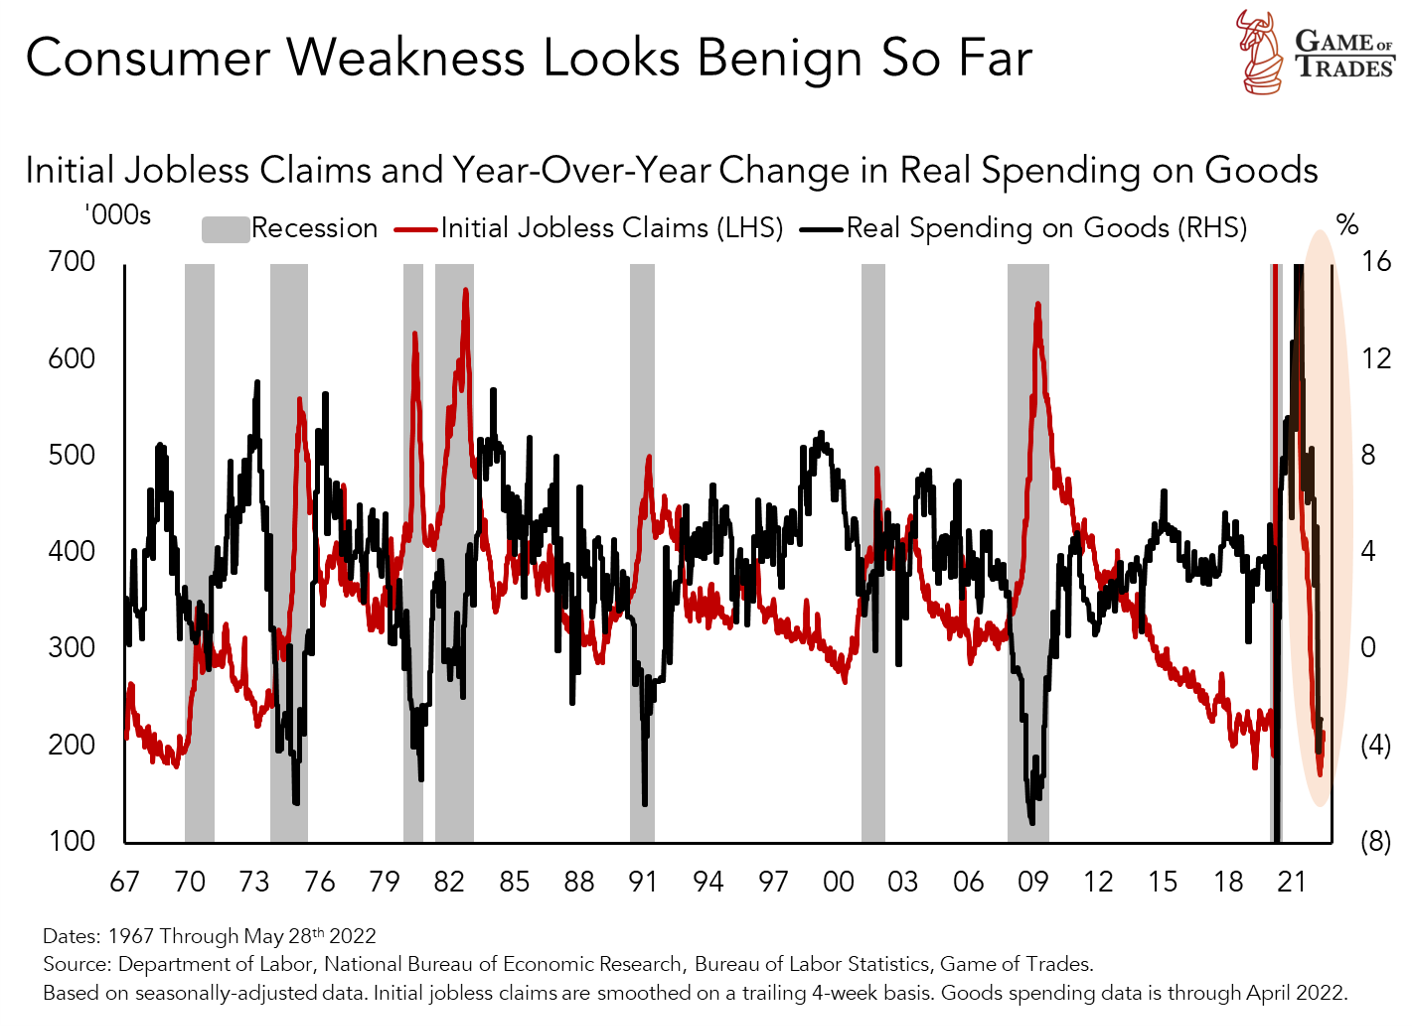
The latest claims numbers appear to have bottomed sometime in March but aren’t rising quickly. We’re tracking it closely for any signs of deterioration.
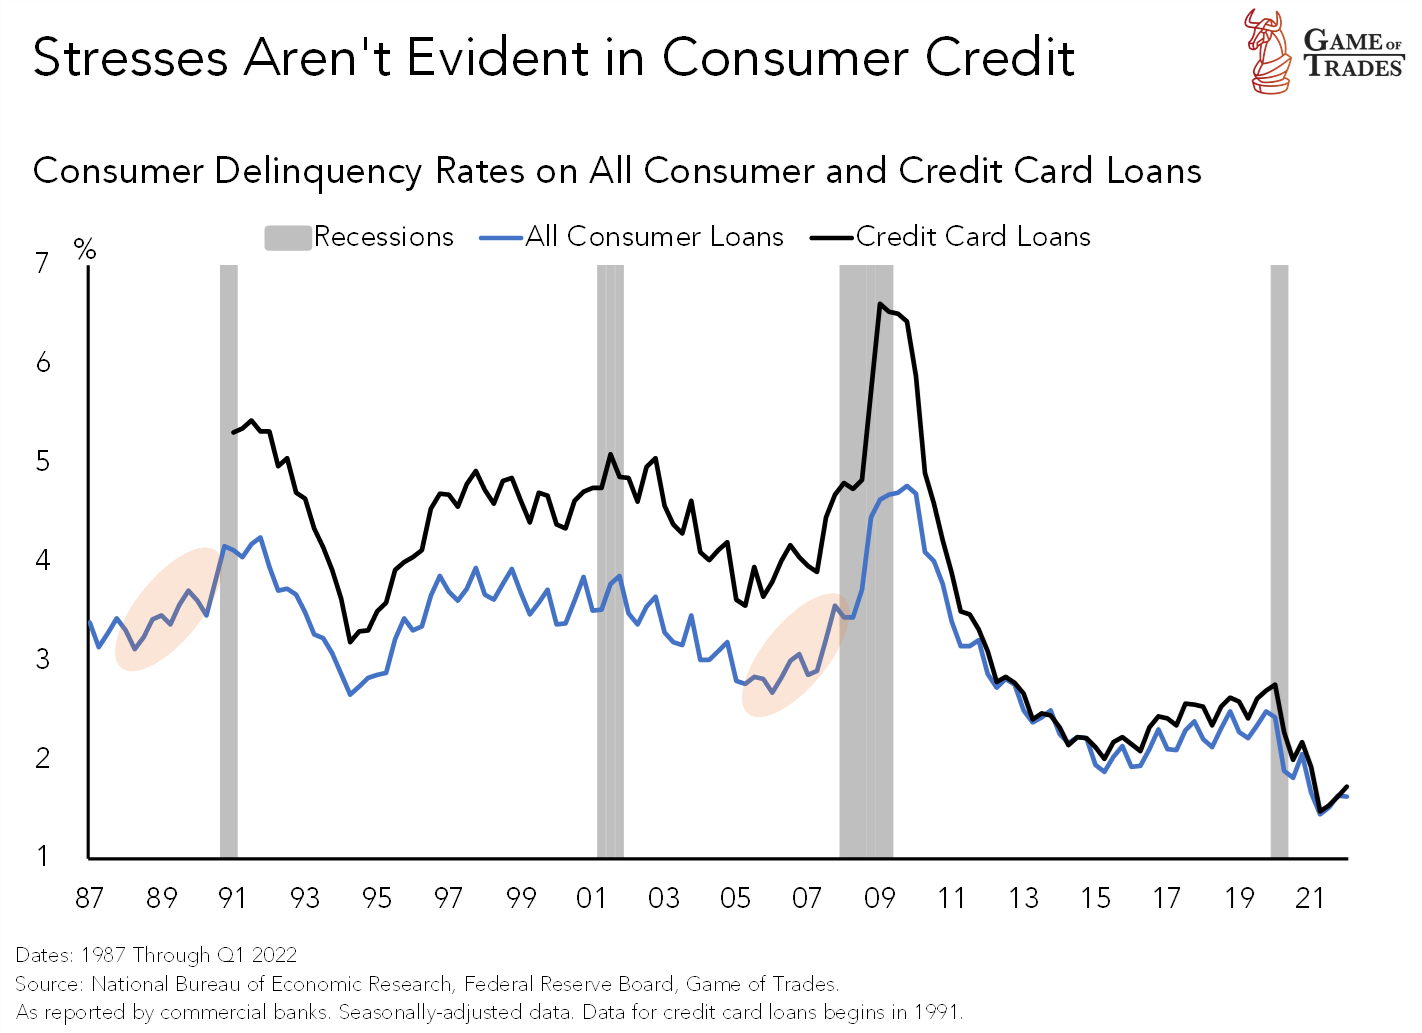
Moving on to consumer credit, delinquencies are at one of the lowest levels in over 30 years. That’s in part due to the deleveraging process that ensued following the Financial Crisis. Delinquencies don’t show similar signs of stress as they did leading into the recessions of 1991 and 2008, even though the contraction in goods spending is now well under way. Household credit-to-GDP ratios fell from close to 100% at the end of 2007 to 78% today, the level seen in the early-2000s. We don’t see signs that excesses have built up in consumer credit.
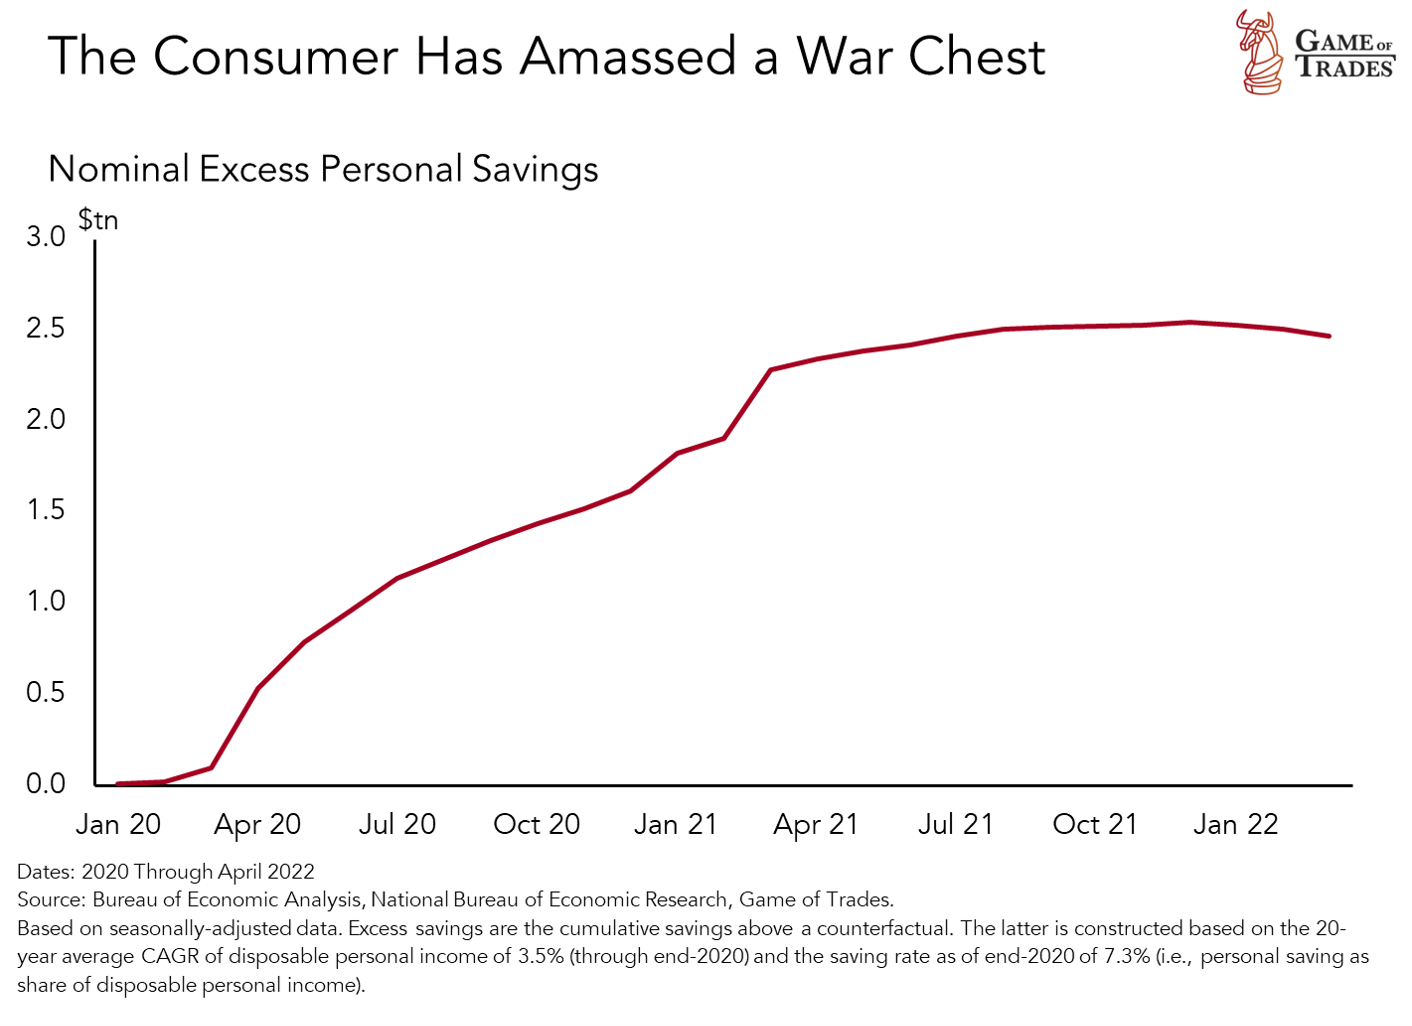
What’s also been relevant in the current state of affairs has been the accumulation by households of about $2.5 trillion in excess savings during the pandemic as shown below, a combination of saved stimulus checks and foregone spending. That war chest can help consumers ride out the headwinds, while they restrain spending. That can help let off some of the demand-driven inflationary pressures without necessarily bringing a recession. Of note, the excess savings are a different concept than the traditional saving rate that has been falling precipitously over the last year. The traditional saving rate is used in the calculation of the excess savings as documented under the Source section directly below the chart that details the methodology. The excess savings capture an accumulation of saving dollars throughout the pandemic; it’s not a saving rate.
Consumer Cyclical Stocks: Disinflation Winners?
In recent research we highlighted our outlook for inflation, indicating that the odds favor that a disinflationary regime will come sooner rather than later, with falling oil prices the driver.
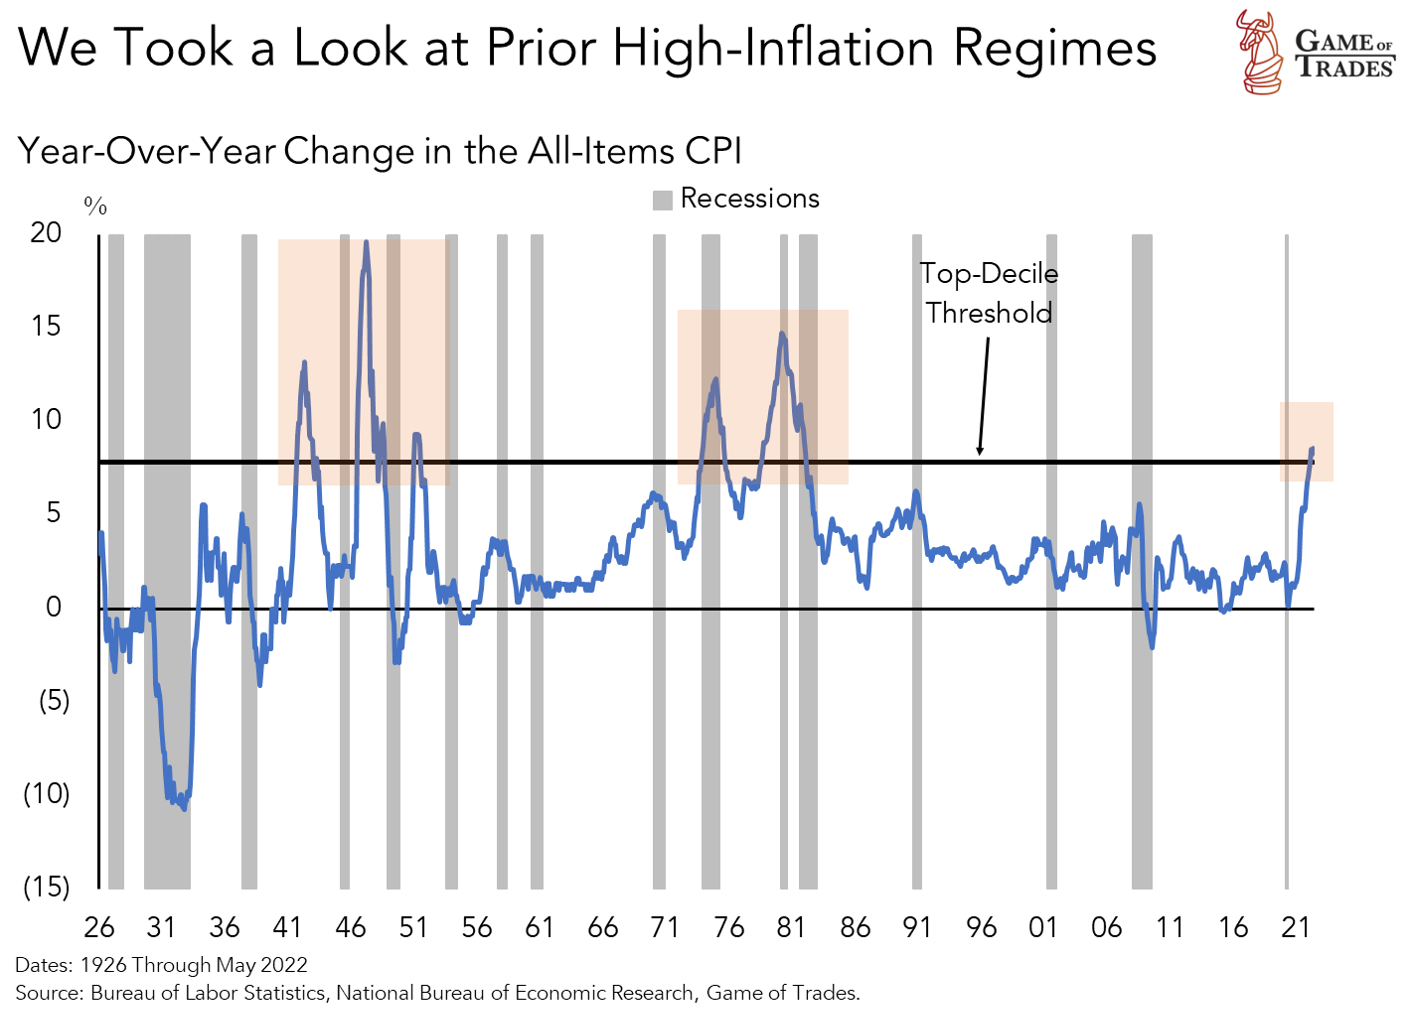
In anticipation of that, we took a look at what sectors drawn from the equity market have done best in episodes when the inflation rates subsided from very high levels. Annual inflation today ranks within the top-decile of the distribution going back to 1926. Outside of that, there’s only been five of those episodes, captured in the chart below. They comprise the years following the end of WWII when pent-up demand was unleashed, as well as the stagflation episodes of the 1970s and early-1980s.
We wanted to assess whether consumer cyclical stocks did well when the inflation rate turned down from high levels. To do that we ran an event study on the performance across various equity market sectors in the 12 months following the peak in inflation in those five episodes. The results are summarized in the table below.
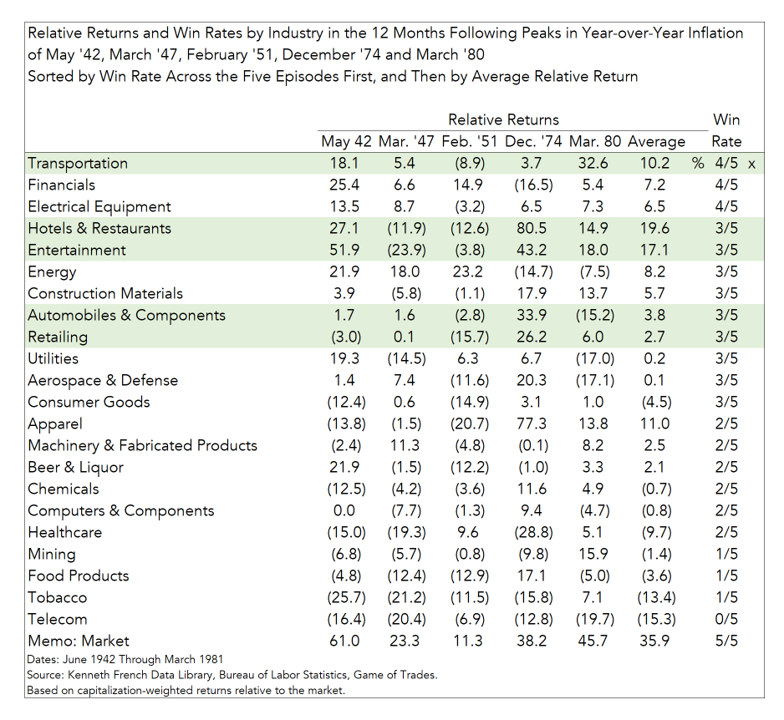
The sector returns are expressed relative to the market, so a positive one indicates the sector outperformed in the year following the peak in inflation. The consumer cyclical stocks are highlighted in green. The average returns across the episodes, as well as the win rates, populate the columns on the right side of the table.
Among the consumer cyclical stocks, transportation offered the best win rate across the five episodes when inflation fell from high levels. Hotels, restaurants and entertainment followed, boosted by the huge returns when inflation cooled off in 1974. Autos and components, and retailing also outperformed, albeit with less impressive numbers. Of particular note, the broad equity market posted solid returns across the five episodes, so simply betting on the S&P was good enough for success.
On the other hand, the consumer staple stocks (i.e., food products, tobacco, beer & liquor, and consumer goods) fared rather poorly when the inflation rate subsided, as investors favored risk rather than stability. Commodity-related sectors like chemicals and mining also trailed.
Transportation and Retailing Stocks Look Attractive
To assess today’s opportunity set across these sectors, we looked at the valuations on a trailing price-to-earnings ratio basis as they stood today compared to their pre-Covid numbers (i.e., current share price divided by the trailing 12-month earnings-per-share).
The results are shown in the chart below with the consumer cyclicals highlighted in green. Within that group, the retailing and transportation stocks have seen the largest falls in P/Es. On the other hand, valuations don’t particularly look attractive for the rest of the consumer cyclical stocks as market capitalizations (i.e., numerator) have dropped less than the earnings have (i.e., denominator). The setup isn’t as favorable there as more pain might get priced in.
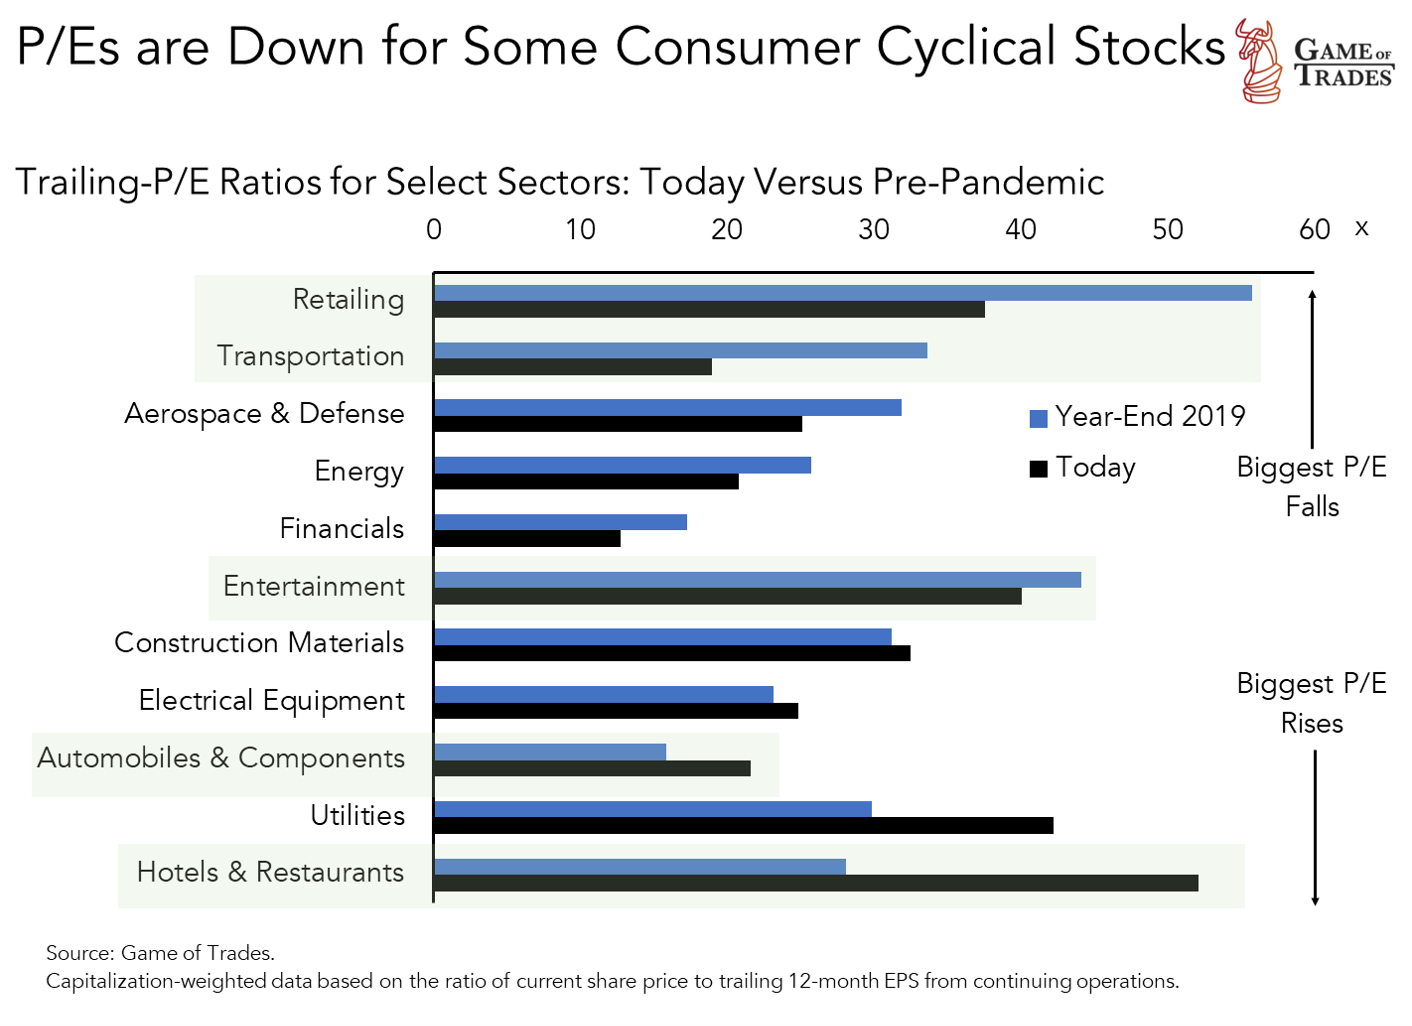
Putting together the findings from our event study following peaks in inflation, with our comparison of pre-to-post-Covid sector valuations, it’s the transportation and retailing stocks that really stood out.
Transportation stocks outperformed in four out of the five episodes we studied, producing an average relative return of more than 10%. They’ve also witnessed their P/E cut in half post-pandemic, so a lot of the concerns have been priced in already. We believe the stocks represent a bet that a reversal of the high-inflation regime will boost consumer sentiment and support spending on goods. That will ultimately bring relief to the logistics, rail and trucking operators that transport those goods and have been under immense pressure lately.
Airlines, that also comprise the transportation stocks, are a bet that consumers will continue to rebalance their spending towards experiences, including travel. Moreover, as the rapid run-up in the oil price subsides, the disinflation that ensues will offer relief for the consumer to increase discretionary spending. Lower oil prices would also boost airline profit margins. We believe the best expression for transportation stocks is through IYT, an ETF with holdings of stocks of this ilk.
While the retailing stocks didn’t fare quite as well as the transportation stocks across the disinflationary episodes, they still managed to outperform the market by nearly 3 percentage points with a respectable win rate. We’re not aloof to recent concerns related to potential inventory bloating amidst a pullback in goods spending. But we’re also cognizant that the stocks are about 20 P/E points cheaper since the pandemic erupted. That helps swallow the contrarian pill a bit easier, while the work detailed in this research showed the consumer has a good chance of riding out the storm despite the pessimism. We believe the best expression is through the XLY, an ETF with holdings of consumer discretionary stocks, with retailing stocks weighted heavily in it.
An important distinction here is that the post-WWII years, and the 1970s and early-’80s, were characterized by multiple bouts of high inflation over the course of many years, as was shown in the one the prior charts. For those with investment horizons that span multiple years (i.e., long-term), we acknowledge that it was the commodity-related stocks like energy, mining and chemicals that outperformed over those longer-term horizons. Our view described in this work, on the other hand, is predicated on disinflation taking course over the next six- to 12-months. We’re not taking a view whether another inflation regime will creep up 2 or 3 years from now. That will be a story for another day.
I think given the extreme level of income and wealth inequality that have developed over the past decades, and throughout the pandemic, it’s important to separate the situation for the top 10% of consumers vs the other 90%. While the top 10% and perhaps top 1% have amassed a pandemic war chest, I would be surprised if the bottom 90% of Americans are in the same boat.
Very good point
Super good point. Thank you.
There are two sides, top and bottom, for a wealth inequality ratio. If the top gets bigger, it is no skin off my nose. It doesn’t matter if the rich get richer. They always will because they have the excess money to invest. Wealth is not zero sum. It matters what percent of middle class income is disposable after necessities. I am a teacher, and we live much higher on the hog than I grew up. My dad worked for the government. Recently we have had to seriously cut into savings because of inflation. The budget has been bad. The savings situation will not improve form here, but there might still be a warchest. I think a lot of people saved the covid stimulus.
Agreed wholeheartedly. And I personally don’t think consumers will ride out inflation. Many people are hurting already and layoffs are beginning. Tech companies and cryptos like coinbase are starting to layoff employees. The housing market is dead in the water so expect massive layoffs in that sector coming soon. Energy IMO is going to keep going higher and commodity prices have no end in sight. The bond market showed its’ true colors before the FED rate decision when the 10 year yield spiked for 3 days. Today, after a 75 basis point announcement, the rate came down. That should not have happened. Maybe some “entity” is trying to prevent a crash you think???
Great information, but how does it all correspond to the 10 year yield, 2 year yield? Will yields continue to rise?
@Randall Holgate We remain of the view that the disinflation will come to the fore in the next six to 12-months, limiting the upside for the 2-year yield. If inflation continues to accelerate then we expect the Fed to tighten further, looking to slow down the economy from the demand-side of the equation. The supply-side issues complicate the matter as the Fed can’t exert much influence there. Financial conditions have tightened considerably with mortgage rates doubling to 6% from the turn of the year.
Could GOT quantify how \”limited\” is the further upside to the 2y yield? And when it finally corrects, what\’s the extent of the correction? GOT has been saying the upside for the 2-year yield is “limited” for some time already. And over that time the 2y yield has shot up. Of course one day the 2y yield will fall, and GOT will come out trumpeting its “right” call. But let’s not forget that even a broken clock is right twice a day.
Sadly GOT seems to have gotten quite a few things wrong over that past (at least) six months. Based on GOT recommendations my portfolio has lost quite a lot of its value. The sooner GOT stands behind their views at least with the model portfolios they promised approximately six months ago the better
Traderstever I feel for you. The analysis herein would benefit of taking in consideration the liquidity injection(QE) or liquidity removal (QT) by the FeDs Monetary policy and the governments fiscal policy. Do yourself a favor and invest in accordance with liquidity plus or minus into the markets via the banks and what the bottom 90% people are getting into their wallets. Do you see that they are getting “richer” or “poorer”? I see that the QT with less fiscal government support is a headwind for long equity investment. Tread carefully until the Fed sounds the alarm bells for stopping QT – that’s your opportunity to go in big on stocks. I think the GOT could sit on their hands sometimes and wait for GOOD LONG S&P500 opportunities or simply be more aggressive on the short side. Since late January it has been great being short stocks. I wish GOT would go short sooner and work on when to cover, when to wait and when to go long.
I feel for you too. I agree GOT has not been on the right side of the market most of this year. But remember they don’t control your finances. They only give their educated opinions based on their research, which is very detailed and thorough. However, no one is right all of the time. You have to gather as much info as possible from several avenues and make your own decisions. Don’t rely on others to manage your investments ever.
The FED has been communicating it thinks the neutral rate is about 2.5%. That\’s a rate that neither helps nor harms the economy. To tame inflation they need to go above that rate, i.e. to be restrictive. I have seen some long time bond traders say that the terminal FED rate = highest rate — is going to be about 4%, which would push the 2 year up or beyond that rate. The two year is around 3.3% today with a sell off from slightly higher numbers. And that assumes inflation starts to moderate but doesn\’t crash down. There is also talk the FED wants a recession. I doubt that but the thinking is that would rapidly kill inflation. The other positive is the long term metrics are deflationary, i.e. low population growth and rapid technological advancements, so we have that going for keeping inflation in check. Update: The FED raised it\’s rate by .75 points and now projects 3.4% by year end for the FED Funds rate and 3.8% for 2023. The 2023 is not guaranteed but the 2 year should follow for at least the short term that 3.4% year end target.
Some thoughts while reading this. The FED has said they want to see unemployment rise. If it hasn\’t achieved that yet, we may see more unemployment coming which changes your unemployment graph, although we\’re at a good starting point for unemployment to rise. On oil, the war in Ukraine is affecting oil supplies (and natural gas) from Russia to the rest of the world. If other oil producers can\’t fill that gap, as a free market would, and the war or sanctions continue for longer, we could see oil prices stay high, keeping inflationary pressure on prices high which would delay peak inflation and the reversal in market direction to the upside. Just a thought. I\’m waiting for a reversal either way.
Technically the FED would never say publicly they want the unemployment rate to rise unless I missed something. I think more precisely they said they want to see the job market tighten, quoting 2 job openings for every person looking for work, which puts wage pressure on companies looking to hire.
The thing that is really scary is what\’s happening in the bond market. In the past 2 days the 10YR and 2YR yields have been spiking very rapidly, in a manner which is unseen in the past. We are talking rapid spikes of capitals that are much larger than the ones involved in the equity market. According to some, this could lead to a financial catastrophe and a liquidity crisis. Would be interesting to hear what GOT thinks about this.
If the 10yr continues to spike uncontrollably won’t that destroy the stock market?
Rising Treasury yields exert pressure on stocks through the valuation channel (i.e.., a rising discount rate used to price future corporate cash flows to the present). So far, market-based longer-term inflation expectations, like the 5-year/5-year forward inflation breakeven and swaps, aren’t making new highs. That’s indicative that the bond market still doesn’t expect a de-anchoring of inflation expectations over the long run. As financial conditions tighten (and they’ve been tightening quite a bit with 30-year mortgage rates doubling to 6% since the turn of the year) we expect inflation to decelerate, led by a repricing of the oil price downward as demand factors start to act as drag and offset the supply-driven dynamic that’s been driving its price for several months now.
EXCELLENT ANALYSIS despite being a bit complicated and not too predictive.
A couple of thoughts:
-Many people are still in the market and having their 401ks diminished. It can take years for people to get back to the prior high.
-Oil/gas prices rising putting more pressure on families and their budgets
-The housing market will slow down with interest rate hikes
-Layoffs and hiring freezes starting across the country primarily in the tech industry
-With incomes threatened by layoffs and hiring freezes this leads to using one’s savings to survive by paying for gas and mortgages. If the equity in housing starts to decrease I can see a situation where a families 401k is cut in half (like in 2001/08), savings depleted due to being forced to pay for items to stay afloat via mortgage payments, higher food prices and gas prices because of layoffs. I’m seeing lots of headwinds. If the fed tries to continue to slowly increase interest rates and we know they are way behind, easily they might not catch up until the end of the year. This would cause additional downward pressure on the markets for that duration of time. I can easily see a domino impact. Tech firms initially impacted by layoffs, companies starting hire freezes, stock earnings decrease, stock valuations follow, more downward pressure. Until the inflation pressure is resolved (end of year) lots of headwinds… The unemployment rate hasn’t risen yet but in 2-3 months of the domino impact, it will.
You are a smart man Paul. Totally agree with your thesis and will invest accordingly.
You write that Transportation will outperform in a disinflation period, does this include the shipping sector (dry bulk, container) as well?
Many of the shipping companies have low P/Es and are paying a very good dividend yield (15-20% yield)
@Helge Samuelsen The transportation sector covered in this article does not include dry bulk or container as there are none of those constituents in the S&P 500. The transportation sector here is mainly logistics, rail and airlines.
Invest with the Fed book says during restrictive monetary environments (which we are in) that these sectors outperform: Energy, utilities, food, precious metal mining, consumer goods, financials.
These are the sectors that outperform during expansive policy: Retail, apparel, autos, durable goods, construction, business equipment, fabricated products, transportation
My thoughts are we are early for transportation and retail.
I agree 100%. I am short Retail and CONSUMER DISCRETIONARY until the fED reverses policy to QE and the personal savings rate of change accelerates. Right now the bottom 90% are racking up credit card debt as never before. Probably to pay for gas. ONLY a Crude Oil crash can save the consumer.
Great analysis and thought-provoking. Thank you for this superb work.
GOT, any thoughts about Japan selling US bonds to support the Yen? This selloff could be the reason US govt yields are spiking, which means the Fed has lost control and another central bank is selling US bonds as well as the Fed’s planned QT. So rates will go much higher therefore destroying demand for all goods and services, and also killing off inflation because we’ll be in a depression!
Thank you.
Consumer sentiment: I see a big difference in this graph, that is that the other two times that were so low it was in a recession. It could be amended if in July we get a second GDP red quarter then since January we have been in a recession.
It seems that we are in a recession already and the markets are already 25% to 70% down is clear that now is not the moment to sell, we are closer to the bottom than the top. Is clear that a relive rally is overdue.
What I see is a relive rally in the next two month when CPI starts to go down and then the last dip to hell when that consequences of all this mess starts to affect the companies and layoffs are every where then in the next 3-6 month we’re going to touch rock bottom. But then with inflation going going down like creasy the Fed changing its tone, every thing really cheap and that the people is going to realice that is not as bad as it seemed as for consumer savings, that the banks aren´t exploding as in 08 is going to be hell of a ride.
Now I started to get my reserve out and I’m starting to buy BTC for now.
Might be my favorite article of the year! Love the 6-12 month timeframe and the specific sector research.
Perhaps the Crypto market is on pause until there is further clarification.
The attraction of the crypto market was that it was an exponential asset in a time where the flood of liquidity boosted risk assets. Now crypto is just a triple levered tech etf and liquidity is draining.
I REALLY like the model portfolio idea. So many questions…
Should we buy now or wait 6 months?
Should we sell in 6 or 12 mo.?
Average in and average out?
Do you like to buy when there is headwind (QT) or tailwind (QE)?
The exact ideal strategies behind the model portfolio will be specified along with the website update. The idea is to have a strategic model portfolio where we highlight our preferred assets/sectors looking out 6-12 months, this will go hand in hand with the tactical (shorter-term) side of the service where the objective will be to identify the ideal entry and exit strategies to increase risk/reward on these ideas.
The FED raised it\’s short term rate by .75. They leaked that intention a couple days ago so not a surprise. They also set their dot plot expected year end FED funds rate at 3.4%, and the two year is following what it expects the FED to do and is right around 3.4%. End of year is a long way off and I expect the FED to continue to react to inflation data. What is interesting is that the FED said they expect the 2023 Fed Funds rate to go to 3.8%. It is a forecast but it\’s so far off I don\’\’t know if it has much meaning today other than it communicates if data — inflation, economy, unemployment etc — happens as they project today that is where they will end up.
Markets seems to like Chairman Pow’s comments in the press conference.
We always need to be careful to not read too much into the initial market reaction to news, it can sometimes be misleading. We still expect that the big signal which would confirm a reversal will come from oil breaking down in a significant manner.
GOT I have heard your thesis and respectfully disagree. I believe oil is going higher. Russia has no intention of ending its’ egregious war on Ukraine. And Biden won’t end his green war on oil.
Michael Burry is reporting that the US Personal Savings has already fallen to 2013 levels and the savings rate to 2008 levels by the end of May. Why is his data, US Personal Savings SA (PIDSS) from Bureau of Economic Analysis completely contradictory to your graph showing personal savings near all time highs, from the same source? How do distinguish which is an accurate representation of personal savings?
https://twitter.com/BurryArchive/status/1530278033839509505/photo/1
The same data Burry is showing is on trading view under PMSAVE
MATTCLARK111 you nailed it! I went through the same analysis today and found the same thing.
In the article we address this exact topic. You can take a look at the source on the bottom portion of chart that shows the excess savings in the article. This is not a saving rate, it’s a nominal dollar figure saved while the saving rate ran significantly above trend due to the booming in savings from stimulus checks and shunning of services spending.
When the FED provided QE it was Buy the Dip. Now when the Fed is clearly doing more and more QT you are saying Buy the Dip. Hmmmm….. I think QE is Do NOT fight the FED and buy the the dip and QT equals Do NOT fight the FED and sell the rip. Being a contrarian is fine but follow the liquidity and what the FED is actually doing. I’d appreciate if you included in your analysis if QE or QT was performed in your time periods described. In my view is ALL ABOUT THE LIQUIDITY THE FED PROVIDES no more no less. Good Luck out there being a contrarian to the FED. Please save this comment of mine for 6 months and then comment please.
I asked 2 or 3 times in response to articles here about the effect of QT. Crickets. I think you are correct Mats that QT must not be ignored, and liquidity in general.
If the fed is tightening and most people are struggling to pay higher rents, fuel, food etc, then the retail investor is not going to be adding much if any liquidity to the stock market.
Peter remember me how can I find Yield Curve chart US10-US02 something like this.. thanxs
Trading view: US10Y-US02Y
If the FED pivots early then the party can continue. If they do what they say then the party will end in Q1 or Q2 for consumers party life. Over the summer we did witness a wild party environment with endless spending. That has dropped off by 45% in September, but it could be seasonal. The pivot will be here soon enough if it is going to happen.